

Markets
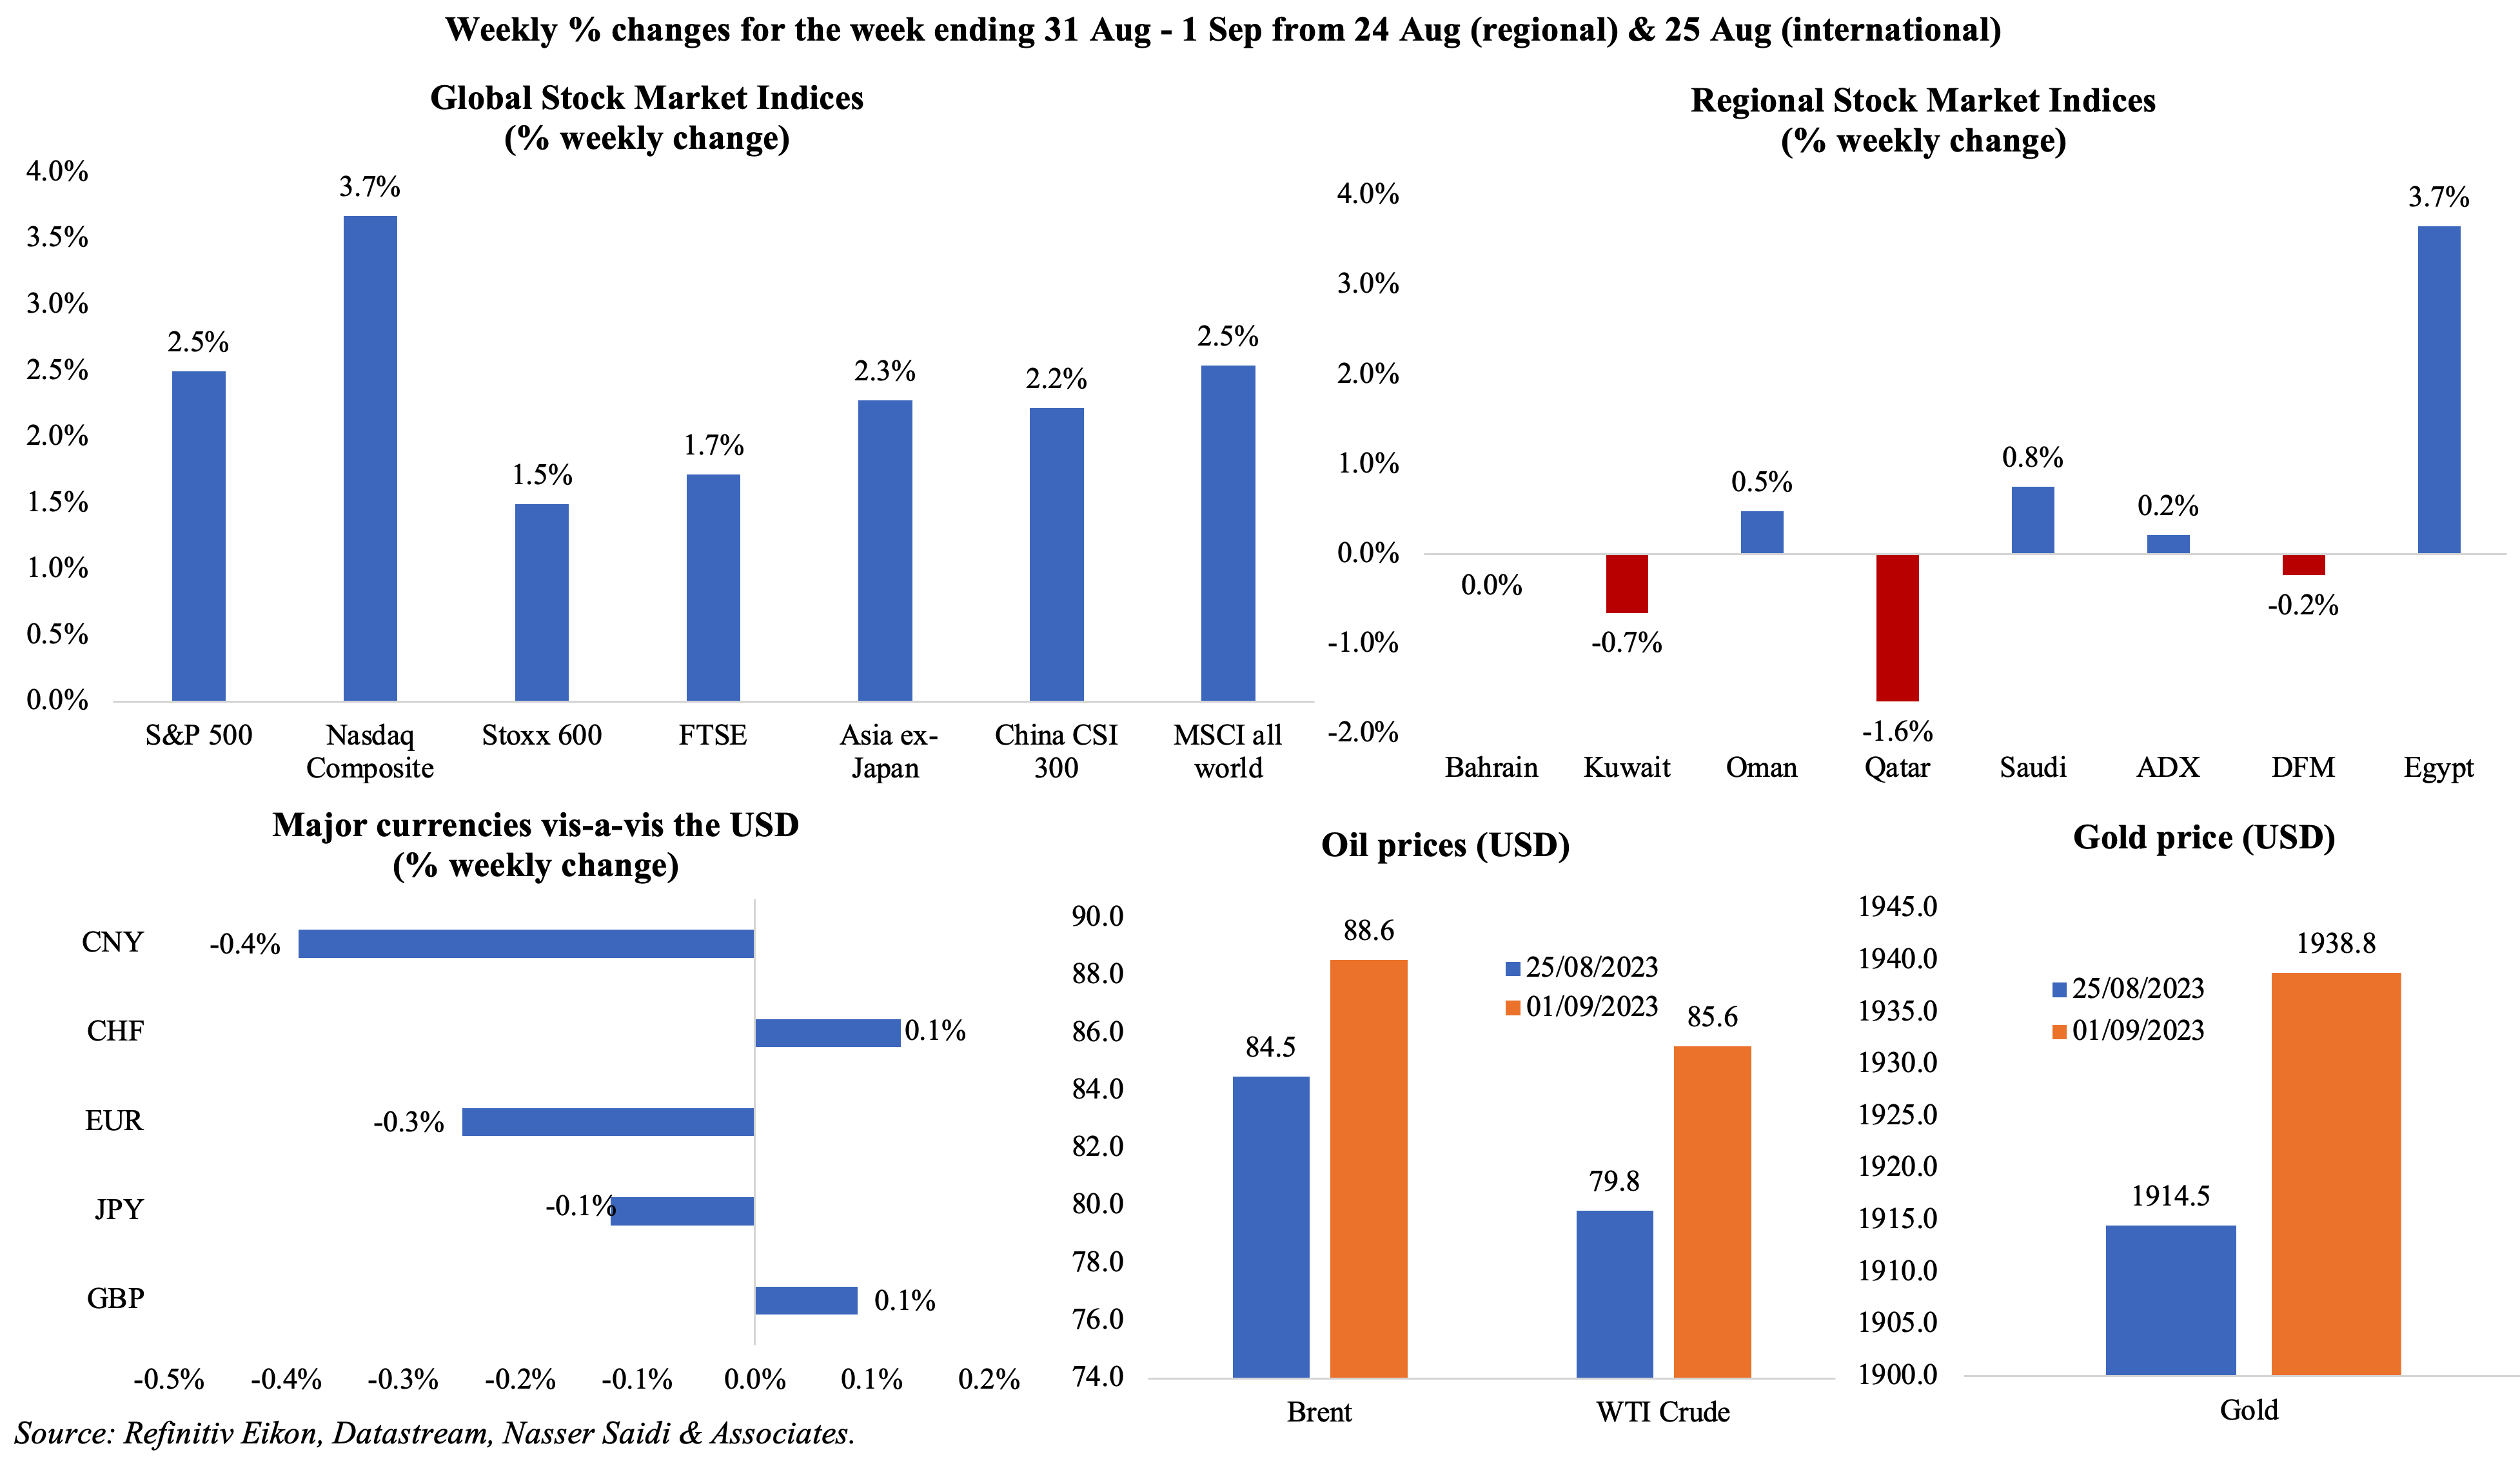
Global equity markets settled higher last week on expectations of rate pauses; US stocks and Stoxx600 posted the biggest gains since mid-Jun and mid-Jul respectively; China’s CSI 300 gained after an unexpected increase in manufacturing PMI. Regional markets were mixed, with Egypt posting the largest weekly gain (and up by over 7% in Aug alone, as investors preferred to hedge themselves in the backdrop of devaluations and rising inflation). The dollar posted its seventh weekly gain in a row, and advanced against the euro and yen. Oil prices rose (after 2 weeks of declines) on worries of tighter supply, after Russia signalled support for supply cuts. Gold price inched up.
Global Developments
US/Americas:
- US GDP growth was revised down in Q2, up by a 2.1% annualised rate (previous estimate: 2.4%; Q1: 2%), given declines in exports, residential fixed investment and private inventory investment.
- Non-farm payrolls rose to 187k in Aug (Jul: 157k), with the healthcare sector gaining the most (71k). Labour force participation rate increased to 62.8% (Jul: 62.6%). Unemployment rate increased to 3.8% in Aug (Jul: 3.5%), the highest since early 2022.
- Personal income inched up by 0.2% in Jul (Jun: 0.3%) while spending rose by 0.8% (Jun: 0.6%). The savings rate fell to 3.5%, the lowest since Nov 2022 (Jun: 4.3%).
- The PCE price index ticked up by 0.2% mom in Jul, matching Jun’s uptick, as food prices and energy prices rose by 0.2% and 0.1% respectively. In yoy terms, PCE price index rose by 3.3% (Jun: 3%) while core PCE was up by 4.2% (Jun: 4.1%).
- Private sector jobs increased by 177k in Aug (Jul: 371k), the least in 5 months, with the services sector adding 154k jobs versus the goods-producing sector’s 23k jobs.
- JOLTS job openings fell to 8.827mn in Jul (Jun: 9.165mn), the lowest level in 2.5 years. There were 1.51 job openings for every unemployed person in Jul (Jun: 1.54), the lowest since Sep 2021.
- Initial jobless claims fell by 4k to 228k in the week ended Aug 25th and the 4-week average rose by 0.25k to 237.5k. Continuing jobless claims increased by 28k to 1.725mn in the week ended Aug 18th, down from a high of 1.86mn in mid-Apr.
- US goods trade deficit widened to USD 91.2bn in Jul (Jun: USD 88.2bn): exports grew by USD 2.4bn to USD 164.8bn while imports were up USD 4.7bn to USD 256bn.
- The S&P Case Shiller home price index advanced by 0.9% mom in Jun, but declined by 1.2% yoy (May: -1.7% yoy).
- Pending home sales gained by 0.9% mom in Jul, rising for the second consecutive month. In yoy terms, it fell by 14%.
- Dallas Fed manufacturing business index improved to a 5-month high of -17.2 in Aug (Jul: -20) amid declines in production and shipments to -11.2 and -15.8 (Jul: -4.8 and -2.2).
- Chicago PMI increased to 48.7 in Aug (Jul: 42.8), staying for the 12th month in a row in contractionary territory.
- S&P Global manufacturing PMI in the US slipped to 47.9 in Aug (Jul: 49), as new orders and output fell, and output expectations for the year ahead was the weakest in 2023.
- ISM manufacturing PMI increased to 47.6 in Aug (Jul: 46.4), thanks to an increase in employment (48.5 from 44.4) while new orders edged lower (46.8 from 47.3); prices paid rose to 48.4 in Aug (Jul: 42.6).
Europe:
- Inflation in the EU remained steady at 5.3% yoy in Aug with food & beverages prices slowing to 9.8% (Jul: 10.8%) and core inflation easing to 5.3% (Jul: 5.5%). Preliminary HICP inflation reading in Germany eased to 6.4% in Aug (Jul: 6.5%).
- Manufacturing PMI in the eurozone rose to 43.5 in Aug from Jul’s 38-month low of 42.7 though slightly lower than the preliminary estimate of 43.7: new orders and new export businesses declined at record rates and employment levels fell for the third month in a row.
- Economic sentiment indicator in the euro area slipped to 93.3 in Aug (Jul: 94.5), the lowest reading since Nov 2020; the indicator worsened in France, Germany and Italy while improving in Spain and the Netherlands. The consumer inflation expectations index jumped to 9.0 in Aug (Jul: 4.9), rising for the first time in 5 months.Consumer confidence in the euro area slipped to -16 (Jul: -15.1), the first drop in sentiment since Sep 2022.
- Eurozone money supply (M3) shrank by 0.4% yoy in Jul (Jun: +0.6%), the first time since 2010, as lending to the private sector slowed to 1.6% (slowest since 2016) and lending to governments declined by 2.7% (the biggest fall since 2007) while deposits fell at a record rate of 1.6%. This is likely to lead to a slowdown in GDP and will likely prompt ECB decision to pause on rate rises.
- German manufacturing PMI inched up to 39.1 in Aug (Jul: 38.8), the second-lowest reading since May 2020 and staying below-50 for the 14th consecutive month. Output declined at the fastest pace since Covid shutdowns and new orders dropped the most in over 3 years.
- The GfK consumer confidence survey in Germany worsened heading into Sep, with the reading falling further to -25.5 from Aug’s -24.6 reading. Income expectations index slipped by 6.4 points to -11.5 in Aug and the index for propensity to buy was down 2.7 points to -17.
- Retail sales in Germany unexpectedly fell by 0.8% mom and 2.2% yoy in Jul, worsening from the previous month, as persistent inflation dampened consumer demand and spending. Food sales however grew by 2% mom.
- Unemployment rate in Germany inched up to 5.7% in Jul (Jun: 5.6%), with unemployment levels increased by 18k to 2.63mn persons (vs a 4k drop the previous month).
- Manufacturing PMI in the UK stood at 43 in Aug (Jul: 45.3), a 39-month low and below-50 for the 13th month in a row, as the output, new orders and new export businesses declined; the latter two posted the steepest declines outside the 2007-08 crisis and Covid pandemic.
Asia Pacific:
- China’s manufacturing PMI rose to 49.7 in Aug (Jul: 49.3), as new orders expanded for the first time in 5 months (50.2 from 49.5) and output grew (51.9 from 50.2). Non-manufacturing PMI eased to 51 (Jul: 51.5), as both new orders and foreign sales remained below-50 for the 4th consecutive month. Caixin manufacturing PMI moved up to 51 in Aug (Jul: 49.2), the strongest expansion since Feb, thanks to output and new orders crossing the 50-mark.
- In a bid to support the RMB, the People’s Bank of China stated that it would cut the amount of foreign currency financial institutions are required to hold in reserve. Additionally, the property market also received a boost after minimum mortgage interest rates were lowered for first-time home buyers in cities including Beijing and Shanghai.
- Japan’s manufacturing PMI stayed unchanged at 49.6 in Aug, though lower than the preliminary reading of 49.7, staying below-50 for the third month in a row; employment grew at the slowest pace in 29 months.
- Industrial output in Japan fell by 2% mom in Jul (Jun: +2.4%), given a decline in domestic and overseas orders. Output of production machinery, electronic parts & devices and semiconductor manufacturing equipment decreased by 4.8%, 5.1% and 16.4% respectively.
- Leading economic index in Japan slipped to 108.9 in Jun (May: 109.1); the coincident index was slightly revised down to 115.1 in Jun (May: 114.3), the highest since Aug 2022.
- Unemployment rate in Japan unexpectedly rose to 2.7% in Jul (Jun: 2.5%), the highest reading in 4 months, as the number of unemployed increased by 110k to 1.84mn in Jul. Jobs to applicants’ ratio eased to 1.29 in Jul (Jun: 1.3), the lowest since Jul 2022.
- Retail sales in Japan grew for the 17th month in a row, rising by 6.8% yoy in Jul (Jun: 5.6%). Large retailer sales grew by 5.5% (vs Jun’s 4.1%).
- India’s GDP grew by 7.8% yoy in the Apr-Jun quarter (Jan-Mar: 6.1%), the highest reading in 12 months, supported by consumption (6%) and construction activity (7.9%) while capital formation eased (8% from 8.9% in the previous quarter).
- Infrastructure output in India grew by a provisional 8% in Jul (Jun: 8.3%), taking the growth to 6.4% in Apr-Jul (vs 11.5% in Apr-Jul 2022).
- Industrial output in Korea fell by 8% yoy in Jul (Jun: -5.9%), the fastest since Apr. Additionally, South Korea’s exports shrank by 16.5% yoy to USD 50.3bn in Jul, the largest drop since May 2020, on sluggish global demand; exports to China plunged by 20% yoy.
Bottom line: JPMorgan Global Manufacturing PMI increased to 49 in Aug (Jul: 48.6), with firms raising prices for the first time in 4 months, driven by rising wage costs and upward pressure from rising raw material and energy costs (the latter rising for the first time in 11 months to the highest since Mar). The final manufacturing PMIs released reaffirmed the weakness in Germany, while China’s latest reading surprised to the upside. With rate pauses being awaited and anticipated rate cuts delayed in the developed nations, expect weakness in global growth to extend into 2024. Meanwhile, the emerging markets have begun lowering rates (Brazil, China, Chile) in expectation that not many Fed hikes are in the offing.
Regional Developments
- Egypt plans to raise USD 5bn from IPOs of 6 projects including power plants, water desalination plants and state-owned enterprises from Oct 2023-Jun 2024, disclosed a report from the Cabinet. The Sovereign Fund of Egypt sold stakes in 13 firms between Mar 2022 to Jul 2023 for USD 5bn.
- Net foreign assets deficit in Egypt narrowed by EGP 24.9bn (USD 808mn) to a negative EGP 812.4bn in Jul, its first decline since Mar. In Sep 2021, before the decline began, NFAs stood at a positive EGP 248bn.
- The Central Bank of Egypt disclosed a 50% increase in its total assets to EGP 4.48trn in Jun 2023: its capital clocked in at EGP 21.6bn, reserves stood at EGP 371.281bn and gold balances rose to EGP 238.604bn.
- Middle East sovereign wealth funds have plans to inject up to USD 120bn investment in Egypt, according to Knight Frank MENA’s “Africa Horizons 2023/24” report.
- ACWA Power’s revealed that it reached financial close for USD 123mn to develop the 200-megawatt Kom Ombo utility-scale solar project plant in Egypt. The total investment was USD 182mn.
- Kuwait appointed Fahd Abdulaziz Al-Jarallah as the new finance minister, following the previous minister’s resignation in Jul. The IMF, which forecasts 0.1% growth in Kuwait this year (2022: 8.2%), recently warned that absent fiscal reforms, risks to its outlook remained substantial.
- Kuwait and UK signed an investment partnership agreement, to boost investments into mutually beneficial sectors such as education, renewables, life sciences and technology over the next 5 years.
- Oman issued 11,540 industrial licenses in H1 2023, up from close to 7000 in H1 2022.
- Hotel revenues in Oman grew by 27.8% yoy to OMR 122.53mn (USD 317mn) in Jul, with the number of guests rising by 25.8% to close to 1.1mn and hotel occupancy rose by 10.3%.
- Qatar GDP grew by 2.7% yoy to QAR 170.1bn in Q1 2023. In qoq terms, GDP fell by 3.9% in Q1 from Q4’s growth of 2.7%. The oil and non-oil sector activities increased by 4.1% and 1.9% respectively in Q1 2023. The fastest growth was reported in accommodation & food services (17.3%), transportation & storage (16.8%) and manufacturing (10.8%) while construction activity fell by 12.5%.
- Trade surplus in Qatar narrowed by 43.5% yoy to QAR 19.6bn (USD 5.4bn) in Jul, as the value of gas exports fell by 44% to QAR 17bn. In month-on-month basis, trade surplus ticked up by QAR 2.2bn or 12.8%.
- Qatar’s budget surplus touched QAR 10bn (USD 2.74bn) in Q2 2023, despite a decline in hydrocarbon revenue (-30.9% to QAR 40.3bn) and a 12.1% uptick in spending to QAR 58.4bn. Total public debt stood at QAR 343.6bn at end-Q2, down 3.5% qoq.
- Visitors into Qatar surged by 91.4% yoy and 2.1% mom to an estimated 288k in Jul; GCC visitors accounted for 47% of the total visitors.
- India’s commerce and industry minister disclosed that the GCC nations want to restart negotiations for an FTA. Discussions had initiated in 2004 towards a potential FTA, but were abandoned after discussions in 2006 and 2008. Imports from the GCC surged 20.3% yoy to USD 133bn in the fiscal year 2023.
- Start-ups in the MENA region raised USD 76mn+ from 18 deals in Aug 2023, according to MAGNiTT. In H1 2023, the region attracted USD 1.1bn in capital from 193 deals.
- EY’s MENA M&A report revealed that UAE dominated activity in H1 2023. Overall number of deals in MENA fell by 14% to 318 in H1 while value remained flat at USD 43.8bn. UAE was the top in terms of target countries (82 deals valued at USD 6bn) and the top bidder nation (115 deals valued at USD 20.2bn).
- Strategy& Middle East projects an expansion in GCC’s assets under management to USD 500bn in onshore assets by 2026 (2022: SD 400bn). The report highlighted that though more than 70% of region’s private wealth is in offshore accounts, “increasing product sophistication and supportive regulatory initiatives” support the appeal of onshore investment.
- Digital economy in the Middle East is forecast to grow more than 4-fold to USD 780bn by 2030, according to a UBS report. This would raise the value of the Middle East’s digital economy to about 13.4% of GDP, from just over 4% in 2022.
Saudi Arabia Focus
- Net foreign assets in Saudi Arabia plunged by USD 16bn to USD 407bn (SAR 1.53trn) in Jul, the lowest reading since 2009, after 2 months of upticks. Aramco’s “performance-linked dividend” payments in Sep should lead to an increase in the near-term.
- Sabic will sell its subsidiary Saudi Iron and Steel Company (Hadeed) to the PIF for SAR 12.5bn (USD 3.33bn), with the transaction to be completed before end of Q1 2024. Separately, PIF sold its 10.9% stake in National Gas and Industrialization Company through a private share sale to Jadwa Investment Company for SAR 491.2mn (USD 130.96mn).
- The Wall Street Journal reported that Aramco is planning to sell USD 50bn through a secondary share offering, and that it could happen before end of this year.
- Saudi crude oil exports plunged to 5.6mn barrels per day in Aug, reported Bloomberg. This is the lowest since Mar 2021 and compares to 6.3mn bpd in Jul. Flows to China fell to 1.3mn bpd, the lowest since Jun 2020 while exports to Japan and South Korea also slipped to the lowest since 2017.
- Overall exports from Saudi Arabia fell by 31.8% yoy to SAR 291.6bn in Q2 2023, according to data from the General Authority for Statistics, driven by the 33.4% drop in oil exports (to SAR 227.7bn). Non-oil exports, excluding re-exports, decreased by 30.8%.
- Tourism revenues more than tripled to SAR 37bnbn (USD 9.86bn) in Q1, thanks to a surge in tourists (7.8mn, its highest quarterly reading and +64% vs Q1 2019). This led to a SAR 22.8bn surplus in the balance of payments for the tourism sector vs a deficit of SAR 1.6bn in Q1 2022.
- Bilateral investments between Saudi Arabia and India are at a new high of USD 24bn, reported the Saudi Press Agency, with the volume forecast to surge to USD 100bn in the next 5 years. Saudi Arabia and India signed an agreement for the former to export over 100k tons of petrochemicals (agricultural and industrial sulfur) to India and East The volume of petrochemicals trade is estimated to touch USD 9.13bn, with an additional USD 1.03bn for agricultural petrochemicals and fertilizers.
- The Saudi central bank issued a license to SiFi, which provides e-wallet solutions, bringing the number of licensed payment service providers to 25.
UAE Focus![]()
- Non-oil trade in the UAE touched a record-high of AED 1.13trn in H1 2023, up 14.4% yoy, and exceeding full-year 2017 numbers. Re-exports grew by 9.9% yoy to AED 341bn and imports were up by 17.5% to AED 693bn in H1 2023. Non-oil exports with its top 10 trade partners alone jumped 22% yoy. China, India, US and Saudi Arabia were the top trade partners, followed by Turkey (recent CEPA). UAE looks set to achieve its non-oil trade target of AED 4trn by 2031, stated the minister of state for foreign trade.
- UAE and New Zealand have initiated preliminary talks towards reaching a Comprehensive Economic Partnership Agreement (CEPA). Bilateral non-oil trade touched USD 805mn in 2022, up 7% yoy and 23% compared to 2020. UAE accounts for 2.5% of New Zealand’s total foreign trade.
- UAE’s CEPAs with Turkey and Indonesia (the third and fourth, after India and Israel) have come into force from Sep 1st, according to the Ministry of Economy. The UAE-Turkey CEPA is expected to boost bilateral trade to USD 40bn in next five years while CEPA with Indonesia will increase it to more than USD 10bn.
- Banks in the UAE disbursed AED 825.9bn to the business and industrial sector in H1 2023, up 3.5% year-to-date according to the central bank. Of this total amount, 90.3% were provided by national banks and the rest by foreign banks in the country.
- About 34,818 new investor accounts were created by brokerage firms in the Dubai Financial Market (DFM) in Jan-Aug 2023, up 51% yoy. Additionally, the 29 brokerage firms listed on DFM conducted over 2.57mn deals on 80bn shares worth AED 136.4bn.
- Financial wealth generated by UAE family offices and ultra-high-net-worth individuals are forecast to touch USD 500bn by 2026, according to a KPMG and Agreus report. This represents a growth of 46% within the next 3 years, a compounded annual growth rate of 6.7%.
- Cards were the most preferred payment tool for e-commerce purchases in the UAE, accounting for 40.8% of online purchases in 2023, according to Globaldata. UAE’s e-commerce market surged by 18.5% to AED 92.4bn in 2022 and is forecast to grow further to AED 107.6bn this year (+16.4%).
Media Review
A mercantile Middle East: article by Dr. Nasser Saidi & Aathira Prasad in IMF’s Finance & Development Sep issue
https://www.imf.org/en/Publications/fandd/issues/2023/09/a-mercantile-middle-east-nasser-saidi-aathira-prasad
UAE’s G42 launches open source Arabic language AI model
https://www.reuters.com/technology/uaes-g42-launches-open-source-arabic-language-ai-model-2023-08-30/
Why the US money supply is shrinking for the first time in 74 years
https://www.goldmansachs.com/intelligence/pages/why-the-us-money-supply-is-shrinking.html
Xi Jinping puts China’s security ahead of tackling its economic woes
https://www.ft.com/content/abe34870-c388-4ba6-b9df-b96154e8c58f
The wrong BRICS expansion
https://www.project-syndicate.org/commentary/brics-expansion-wrong-for-emerging-economies-by-daron-acemoglu-2023-08
Powered by: