

Impact of Iran conflict on oil, trade, food & more. Saudi GDP & IP.
Download a PDF copy of this week’s insight piece here.
Beyond Oil: Global Trade and Food Security Impacts of the Hormuz Disruption, Weekly Insights 13 Mar 2026
1. Economic Consequences from the Iran Conflict
- The outcomes of the war in Iran will eventually depend on three factors: length (i.e. duration of the conflict) + width (i.e. how many countries are affected by it, directly & indirectly; how many sectors are affected – energy production and trade, tourism, transport & logistics, retail, real estate, FDI etc) + breadth (by the scale of destruction). For now, all three are uncertain.
- The biggest global economic impact from the Iran war, and wider conflict in the Middle East, has been from the almost full closure of the Strait of Hormuz.
- Oil and gas production has also been halted across the region in many countries – either due to the energy infrastructure being hit or as a precautionary measure. The alternative export routes, be it via the Yanbu port in the West of Saudi Arabia or UAE’s Fujairah, will not be sufficient to offset the lost flows.
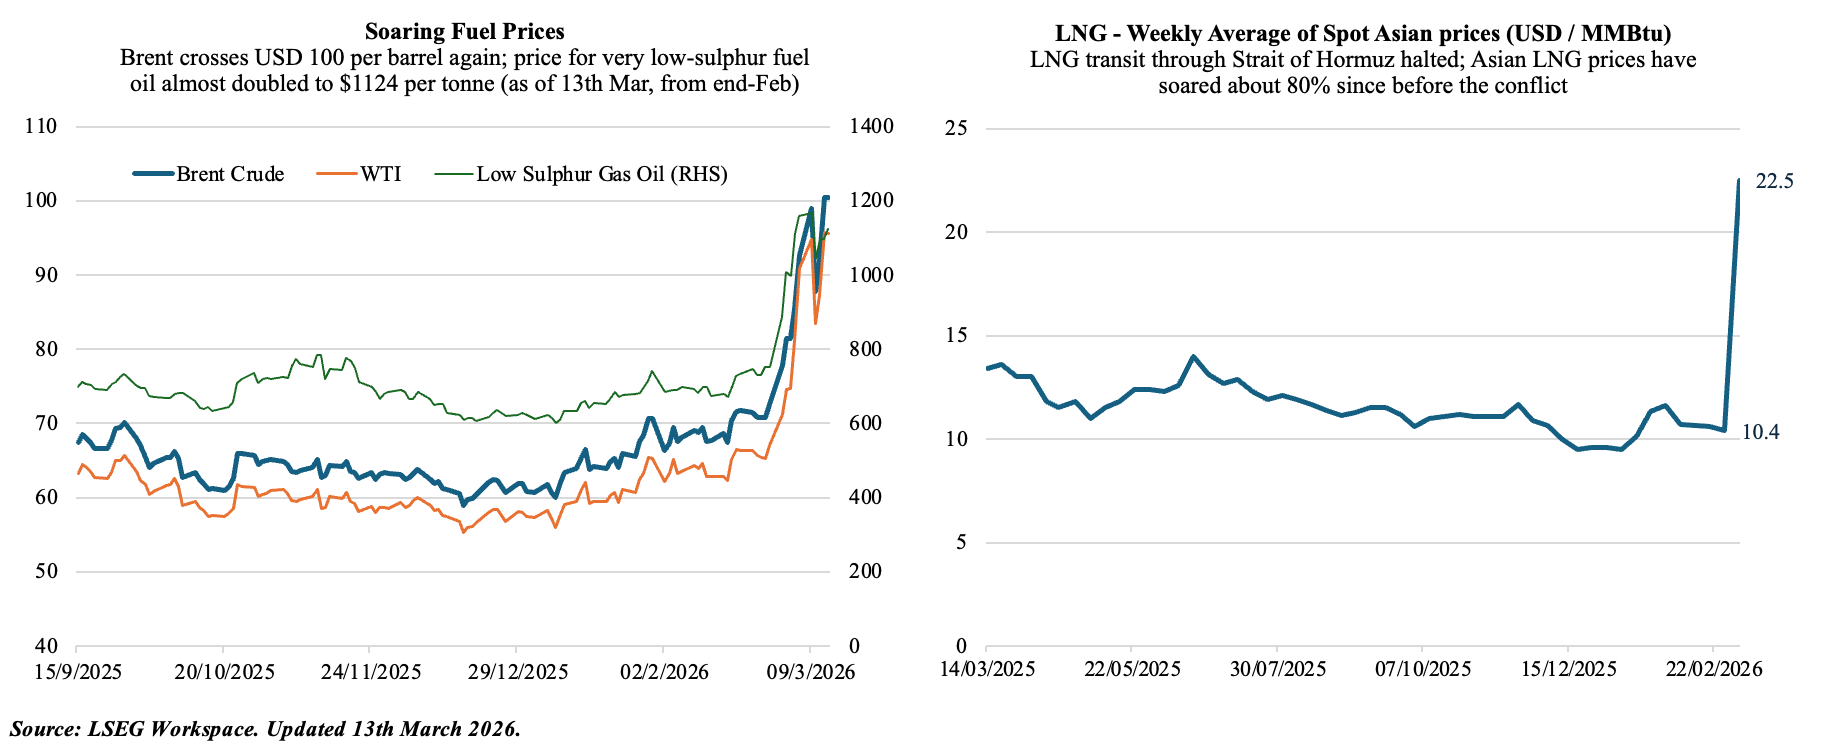
- This supply risk has sparked a jump in energy prices: with Brent crude surging past USD 100 and a jump in the average spot Asian prices for LNG (up more than 70%+ since before the conflict). Cost of marine fuel used by ships has also risen: Singapore’s bunker prices have doubled (raising refuelling costs), with Low-Sulphur Gas Oil crossing USD 1,100 per tonne.
2. Wider Implications from the Iran Conflict & Post-War Recovery
- Impact on financial markets: The US equity markets has been very volatile since the start of the war, given the multiple conflicting headlines, but has remained relatively resilient overall. Markets in Europe are down close to 6% this month, while in Japan and Korea (most dependent on Middle East oil), markets have plunged more than 7% and 10% respectively. Given its direct impact from the war, the GCC markets have seen steep losses (Dubai this week posted its second highest weekly percentage loss in six years).
- Should the war continue for months, the energy price shock will affect macro fundamentals globally, raising risks of higher inflation (which will limit central banks’ monetary policy moves) alongside potential recession. This will have a negative spillover on equities markets performance.
-
GDP in the GCC will likely contract in 2026. There has been differential impact on the region (Oman and Saudi relatively less affected), but the longer the conflict lasts we can expect the decline to be much higher. If the conflict continues for two months, expect double-digit declines in Bahrain, Kuwait and Qatar while it drops by around 8% in the UAE and 5% in Saudi Arabia (Source: Goldman Sachs). For reference, GDP in Dubai fell by 10%+ during the Covid-affected 2020 (with Jan-Feb growing at a normal pace).
- Fiscal impact:
- For the GCC, there is a potential double whammy from lower oil and gas revenue as well as from non-oil revenues (VAT, CT etc.) and income from State-Owned Entities and Government Related Enterprises (DP World, Emirates, Qatar Airways etc) as spending declines. Corporate income (and overall GDP) could be considerably affected, depending on duration of the conflict.
- There will be higher government spending for reconstruction, defence and security.
- In tandem, this will lead to higher budget deficits or wiping out of surpluses.
- Once again this depends on duration, intensity and breadth of the ongoing conflict.
- Furthermore, the recovery in supply post-conflict will not be immediate. Even after a ceasefire, it could take at least 1–2+ months for production & logistics to recover => oil prices may remain elevated in the near term.
- However, it is likely that there will be greater investment in resilience infrastructure such as strategic food reserves or alternative export pipelines (e.g. Iraq’s renewed interest in Mediterranean pipelines via Syria & Lebanon).
- The 2026 conflict is acting as a stress test for the GCC & wider region.
- Can the Red Sea developments allow for the creation of new supply route(s)?
- Could it lead to greater regional integration – new pipelines, inter-modal transportation, a more active common market & Customs Union?
- Just like the post-Covid resurgence of Gulf IPOs (via privatisation of SoEs & family businesses), could this war lead to the creation of a local currency bond market & a yield curve?
3. The Strait of Hormuz closure could lead to a multi-dimensional shock to global cost of living & well-being
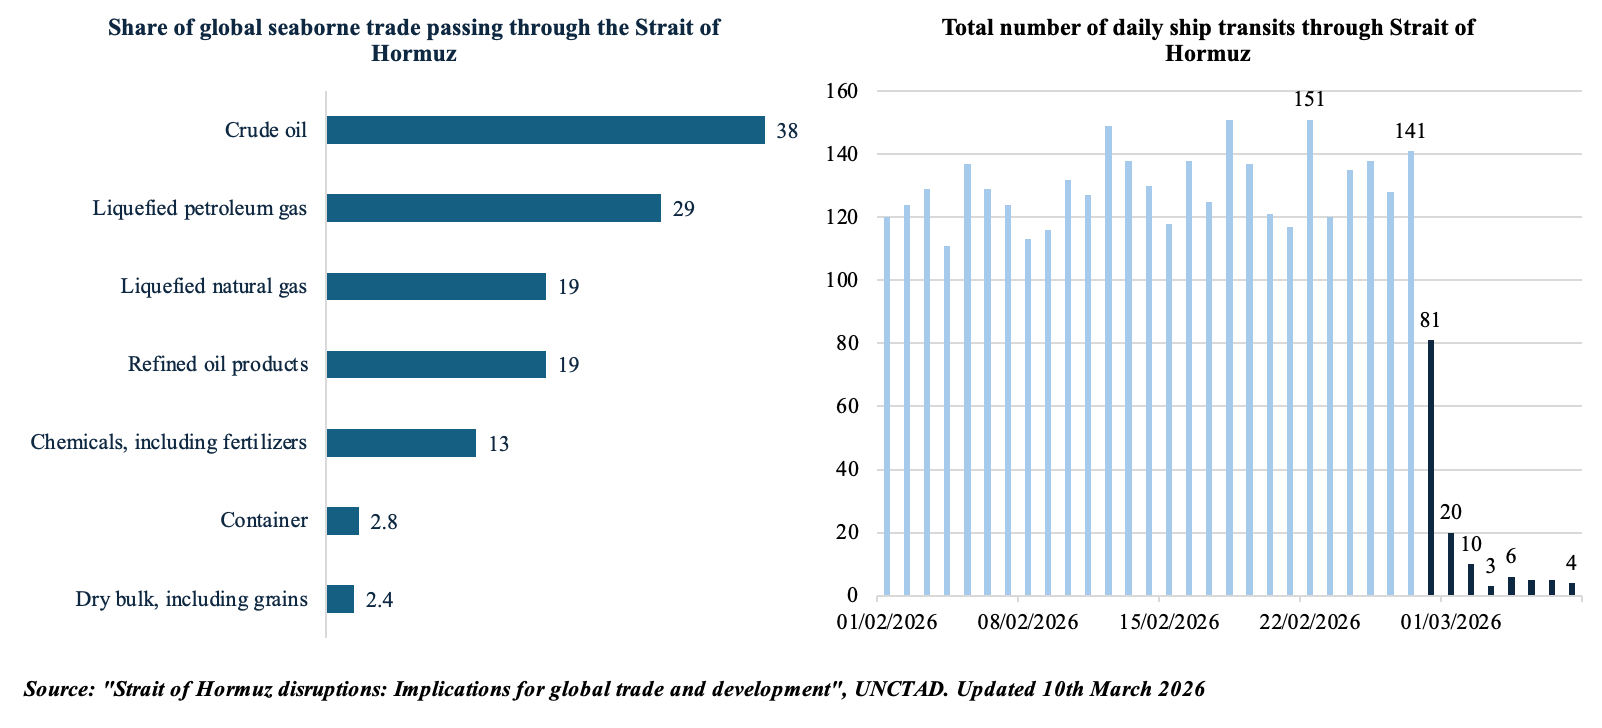
- UNCTAD: In addition to 25% of global seaborne oil trade passing through the Strait (or 20mn barrels per day), it accounted for one-third of global seaborne fertilizer exports (about 16mn tonnes).
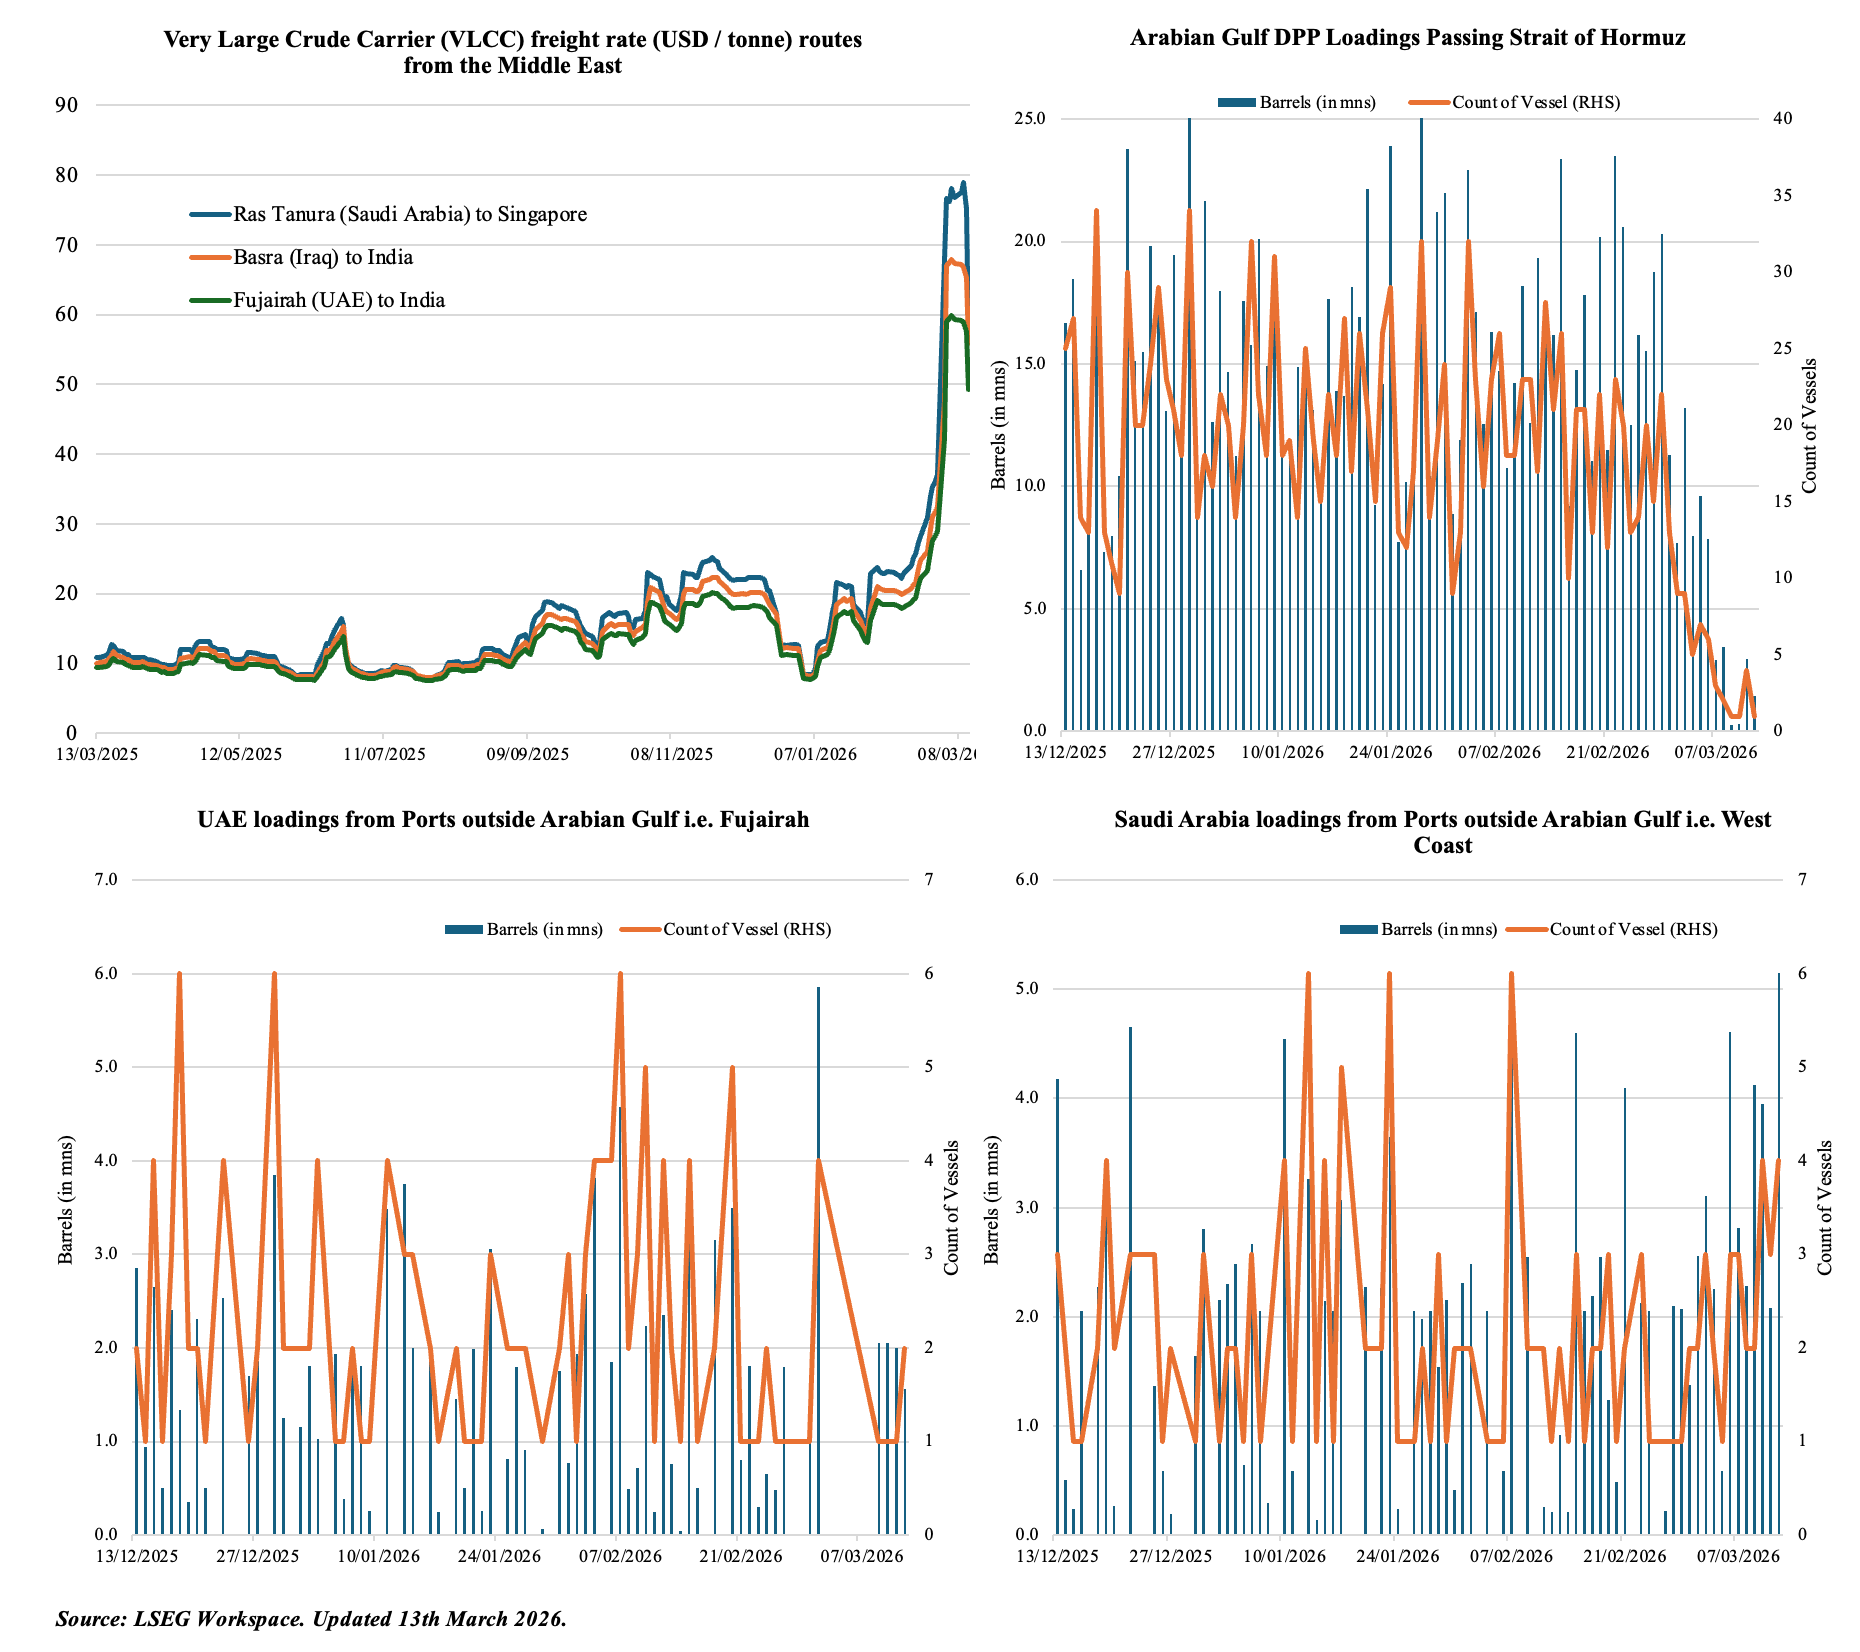
- With shipments at a near-standstill (falling from a high 151 transits per day in Feb 2026 to less than 5), the lack of fuel oil availability is forcing knee-jerk reactions across the globe: (a) global fleet to adopt reducing vessel speeds to conserve fuel – which effectively removes shipping capacity from the market and acts as a hidden inflationary tax on global seaborne trade; (b) countries have adapted in many ways: moved to a 4-day work week, enforced remote working & early school holidays, paused supply of commercial LPG cylinders etc; (c) surge in demand for Panama & Rotterdam fuel could potentially even lead to a permanent shift in global bunkering geography.
- The effect is not limited to fuel. Food imports to many Middle East countries (e.g. to Yemen, Sudan etc) that used to happen as trans-shipments via UAE’s Jebel Ali port has also stalled – could lead to shortages and prices. More than 20 ships carrying 1mn metric tons of fertilizer are stuck that could lead to a fertiliser shortage: this could lead countries to restrict / halt food exports (as seen during the war in Ukraine). The rise in military spending could reduce future development spending, SDGs, climate / clean energy investments etc.
4. Middle East War Disrupts Fuel Oil Shipments via Strait of Hormuz
- With the Strait closed and alternative routes re-routing trade, there has been a substantial increase in container freight rates and high war-risk insurance premiums, that could potentially be passed on to the end-consumers.
- The conflict has also forced countries of the region to explore alternative export routes including Saudi Arabia’s utilization of the East-West Pipeline (via the Yanbu port in West Saudi Arabia) and UAE’s Fujairah port.
5. Asia’s Energy Vulnerability to a Strait of Hormuz Disruption
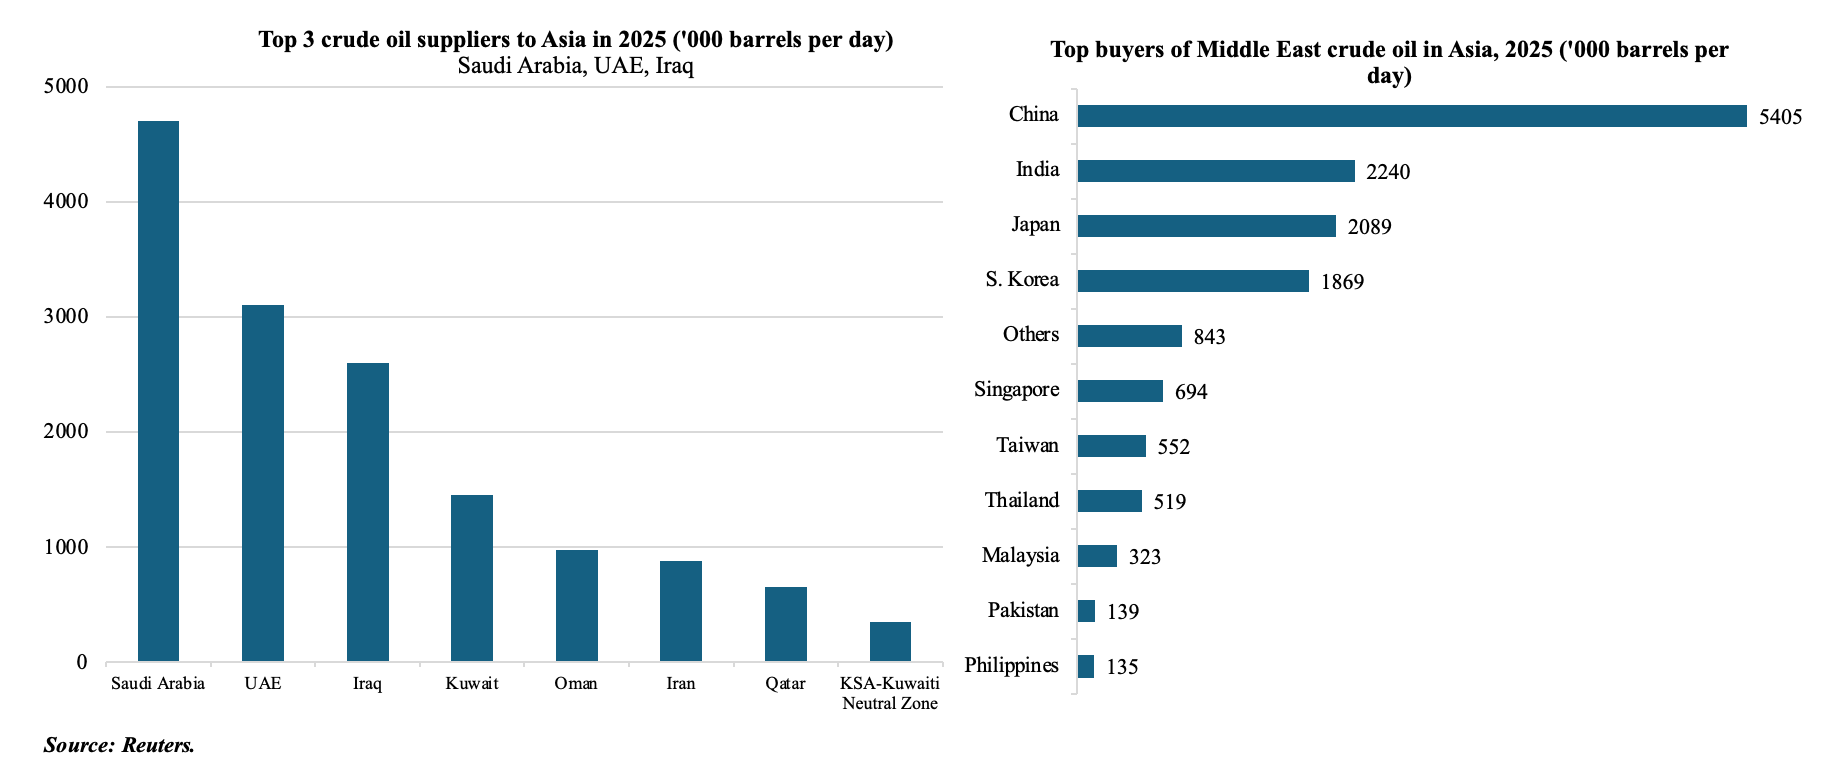
- Asia is the primary victim of the Strait of Hormuz blockade. About 84% of crude oil and 83% of LNG transiting the Strait was delivered to Asian economies (China, India, Japan and South Korea).
- Japan relies on the Middle East for over 95% of its crude oil, almost all of which must pass through Hormuz. In response to the crisis, Japan authorized a historic release of 80mn barrels (45 days of its 254-day reserve) to prevent an industrial shutdown. For India & China it stands at between 40-50%. China is the largest single recipient of Hormuz-bound oil (5.4mn barrels per day), but it also has access to overland pipelines from Russia and Kazakhstan.
- The current surge in oil and fertiliser prices will not only worsen trade deficits but could also result in higher food and overall inflation prints. Countries with high debt servicing burdens may come under additional fiscal strain (especially those increasingly dependent on imported energy, fertilisers and food).
- Could this energy security threat see a further push to renewables? Potentially. But if one looks at the example of Europe during the Russia-Ukraine war – Europe reduced its dependence on Russian gas and moved to US imports (i.e. diversified); though renewables in its energy mix rose, higher interest rates acted as a deterrent to accelerated deployment of clean energy.
6. Saudi Arabia GDP grew by 5.0% yoy in Q4 ‘25, thanks to oil & non-oil growth
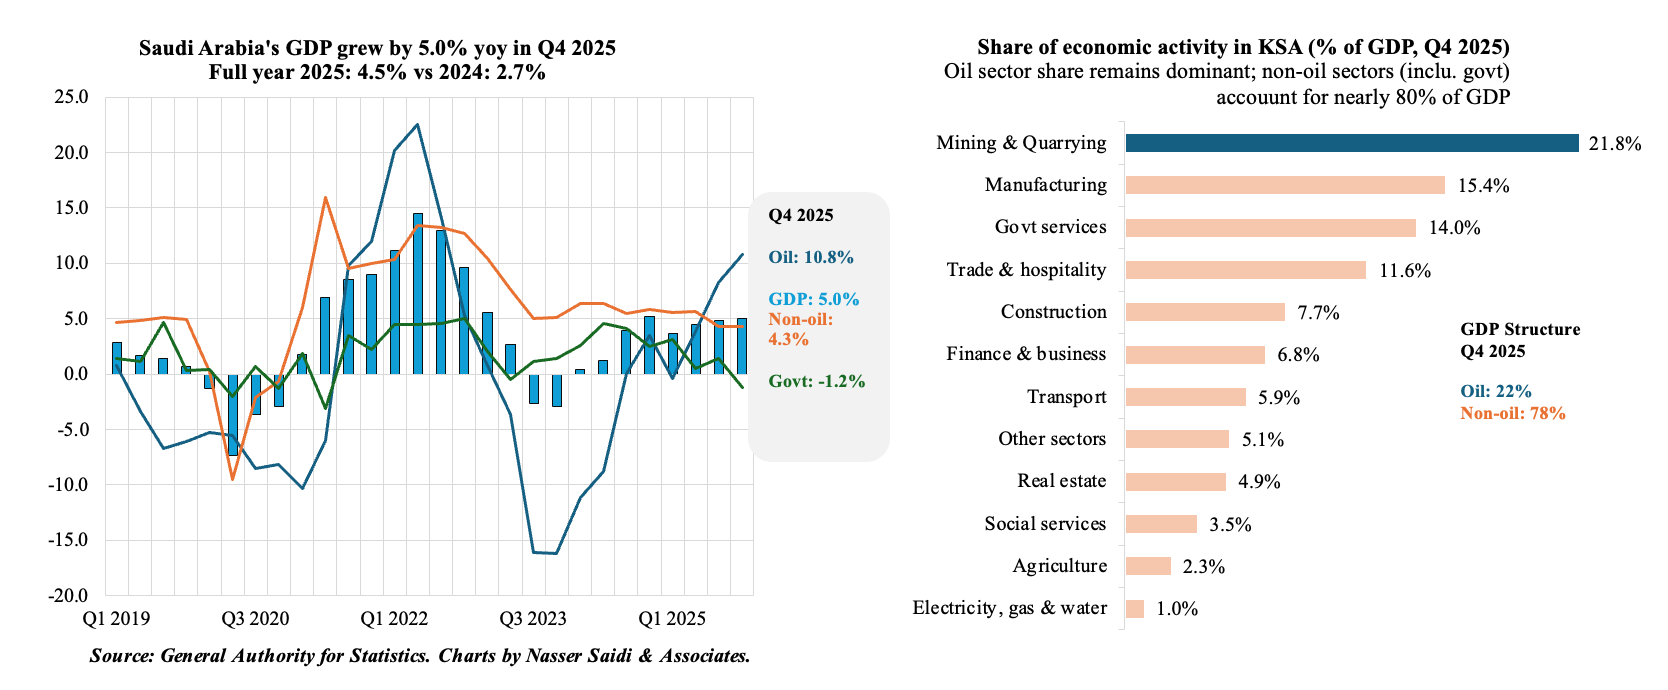
- Saudi Arabia’s GDP grew by 5.0% yoy in Q4 (prelim: 4.9%, Q3: 4.8% and Q4 2024: 5.2%), according to Gastat.
- Growth was supported by a double-digit growth in oil activities (10.8% in Q4 vs 8.3% in Q3 and 3.4% a year ago), resulting from the unwinding of voluntary oil production cuts. By Dec 2025, Saudi crude production reached 10.1mn barrels per day (bpd), from 8.9mn bpd a year ago. Oil sector was the largest contributor to Q4’s growth, adding 2.6 percentage points to headline growth. Crude petroleum and natural gas extraction alone posted the largest sub-sector gain at 12.4%.
- The non-oil sector continued to grow by a solid 4.3% but was overshadowed by the surge in oil sector activity. Interestingly, government activities contracted by 1.2% in Q4 2025 – suggesting a strategic shift toward private-sector-led growth and more disciplined fiscal policy.
- For the full year 2025, real GDP grew by 4.5%, significantly outperforming 2024’s 2.7% growth, primarily driven by the reversal of previous OPEC+ production cuts.
- Saudi non-oil PMI is likely to soften in Mar-Jun 2026 as input prices for construction and technology imports rise, potentially slowing the pace of giga projects. Saudi Arabia’s benefits from the USD 100 per barrel oil price will depend on export volumes via the East-West pipeline. We expect the government/ PIF to utilise any oil revenue gains towards boosting resilient infrastructure & greater localised defence spending (at end-2024, the localization rate stood at 24.9% of total military spending vs just 4% in 2018).
7. Robust industrial momentum pre-war: Saudi IP grew 10.4% yoy in Jan 2026
- While the oil sector remains a major anchor, Saudi Arabia is capitalising its non-oil industrial base and massive mineral wealth to support overall growth; this will also become a buffer during the ongoing maritime disruptions.
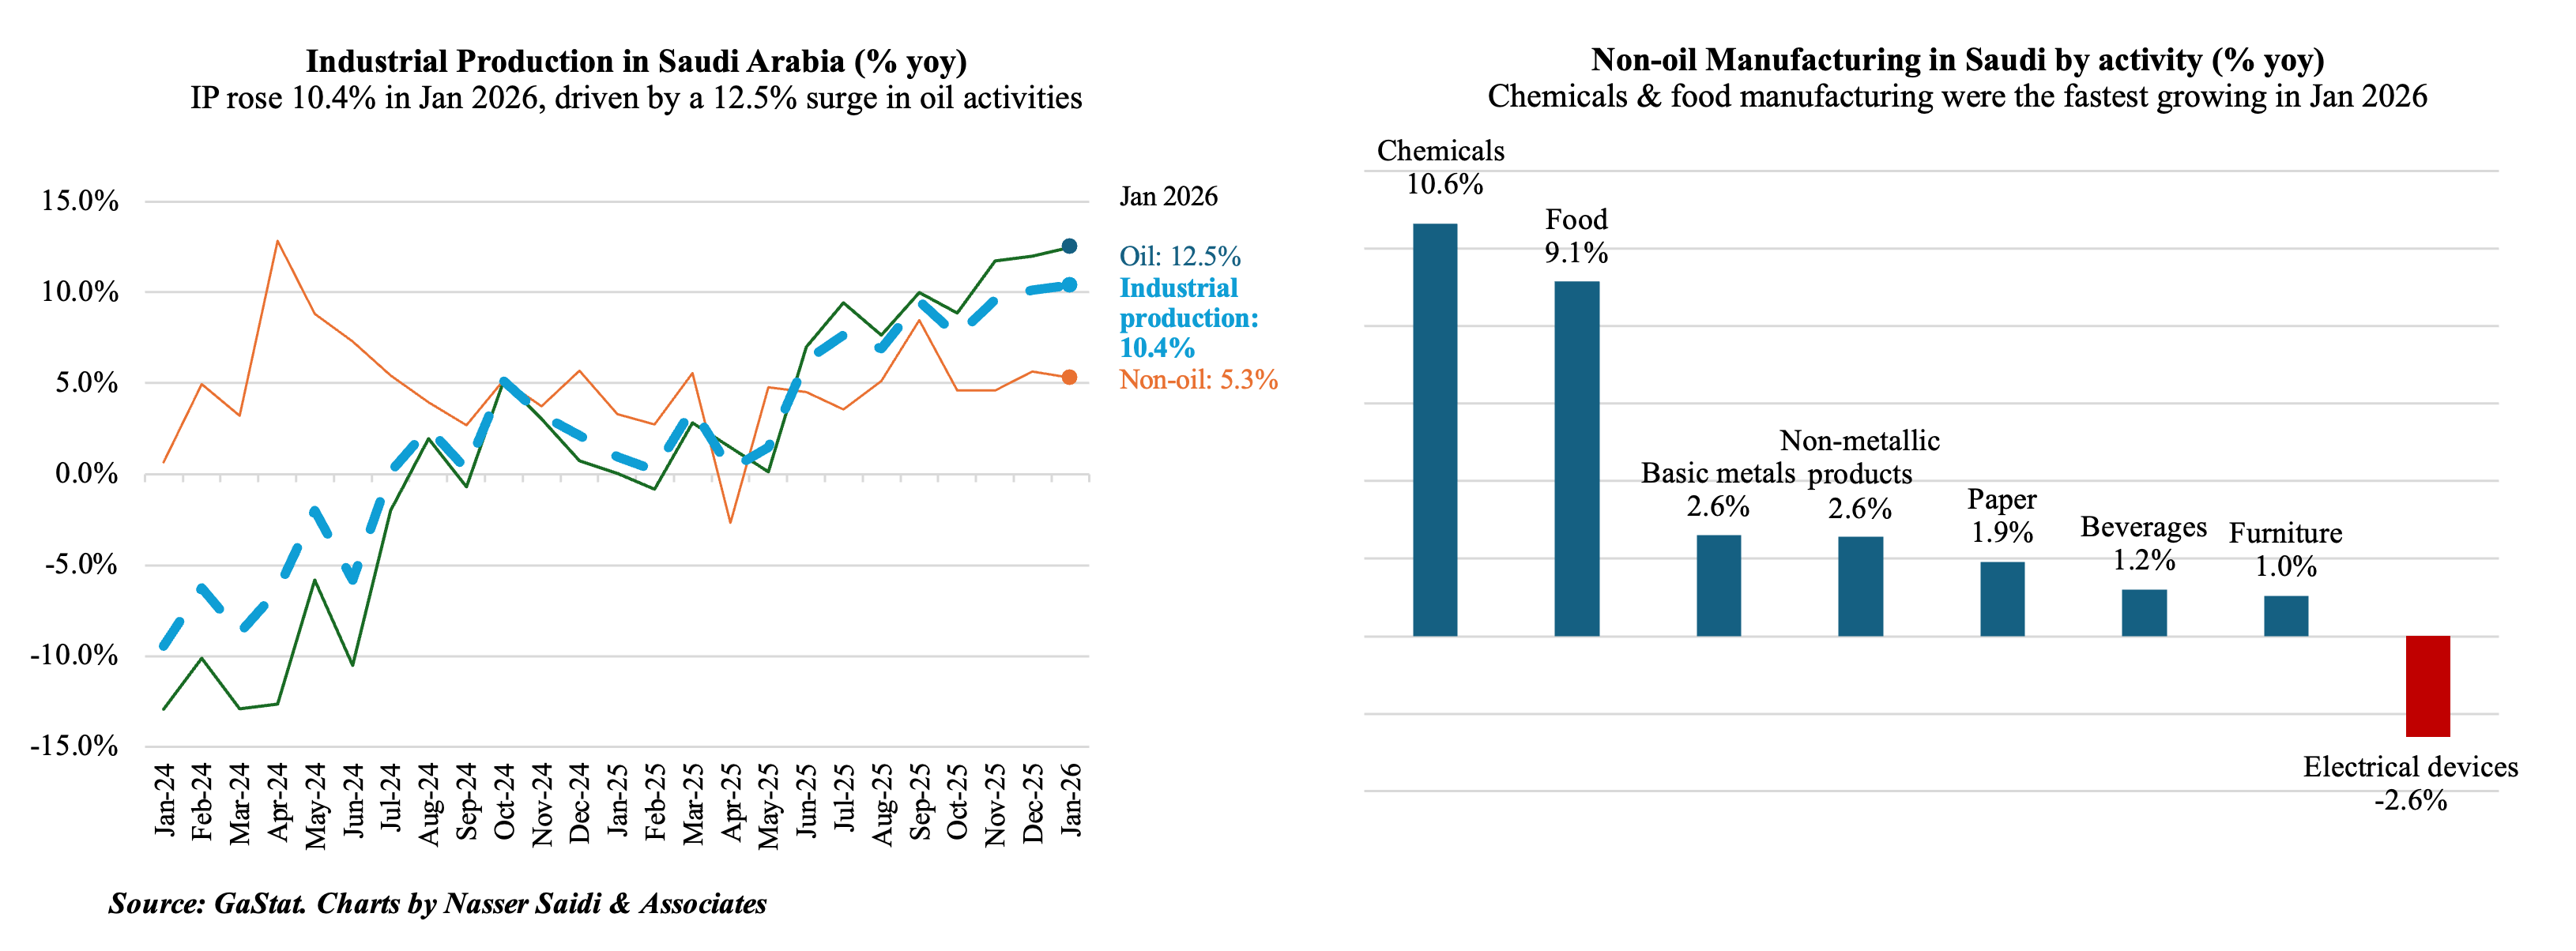
- Industrial production in Saudi Arabia grew by 10.4% yoy in Jan, the strongest since Oct 2022, given the 13.3% surge in mining & quarrying, driven primarily by the ramp-up of crude oil production (10.1mn bpd in Jan vs 8.9mn bpd in Jan 2025).
- Non-oil activities increased by 5.3% yoy in Jan (Dec: 5.7%). Within non-oil manufacturing, the fastest growth was recorded by chemicals (10.6% yoy) – possibly that the extra O&G produced is also feeding into downstream industries (petrochemicals).
- With Saudi mineral wealth now valued at USD 2.5trn, the Ministry of Industry and Mineral Resources issued 736 new mining licenses in 2025(a 220% surge), and 29 in Jan 2026. Valid mining licenses stood at 2,934 as of Jan, with a heavy focus on exploration (1,016 licenses) for gold, zinc, and copper – minerals that are less dependent on volatile maritime chokepoints than bulk hydrocarbons. Saudi also issued 1,660 new industrial licenses in 2025, representing an investment of SAR 76bn (USD 20.5bn).
Powered by:
![]()