

Download a PDF copy of this week’s insight piece here.
Weekly Insights 16 Feb 2024: Economic Diversification in the Middle East amid post-Covid recovery
1. Measuring Economic Diversification
- Diversification is key to reducing macroeconomic volatility and risks, avoid ‘natural resource curse’, achieve a balanced economy, sustained economic growth, trade and development
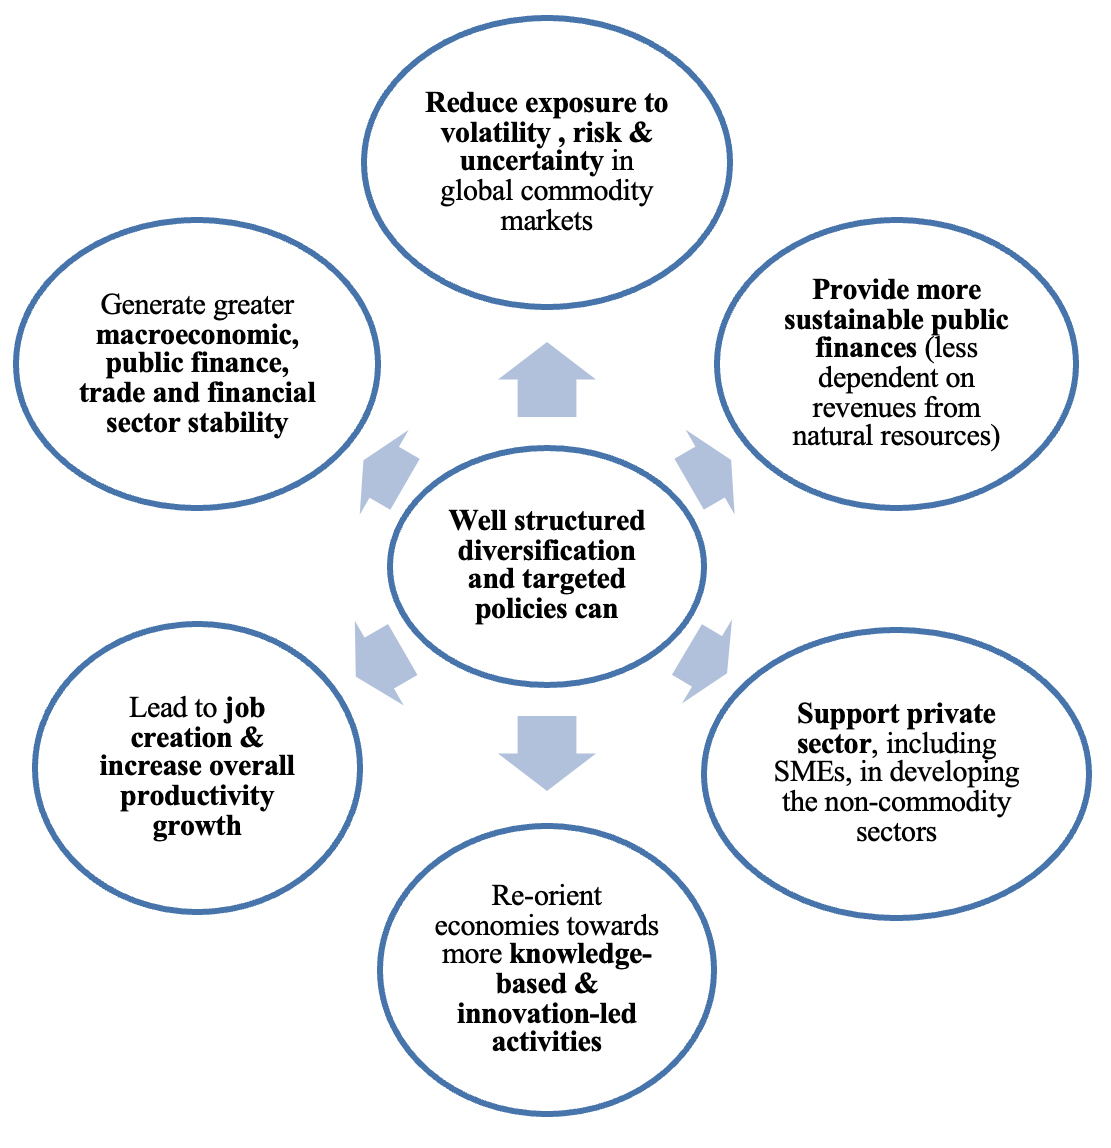 and job creation.
 - Diversification visions and strategies exist: but there were NO harmonized, comparative, comprehensive, quantitative indicators to measure their progress and guide strategy and policy
- The Global Economic Diversification Index fills this gap, by creating an index based solely on publicly available, quantitative measures without qualitative or perceptions indicators. The overall Global EDI is composed of three sub-indices tracking
- Output diversification. As commodity exporters diversify, lower their dependence on resource rents and potentially score a higher score on the EDI
- Trade diversification. Greater trade diversifications reduce impact of trade-related & external shocks, increases economic linkages and product complexity
- Government revenue diversification. For non-diversified nations, when price of the commodity falls, there is a significant decline in government revenue, public spending, current account balance and international reserves: more volatility.
- The Global EDI 2024 tracks the performance of 112 nations (including major commodity exporters, not limited to just oil) over the period 2000-2022, using 25 indicators. Three new digital indicators are further introduced to capture the growth of the digital economy.
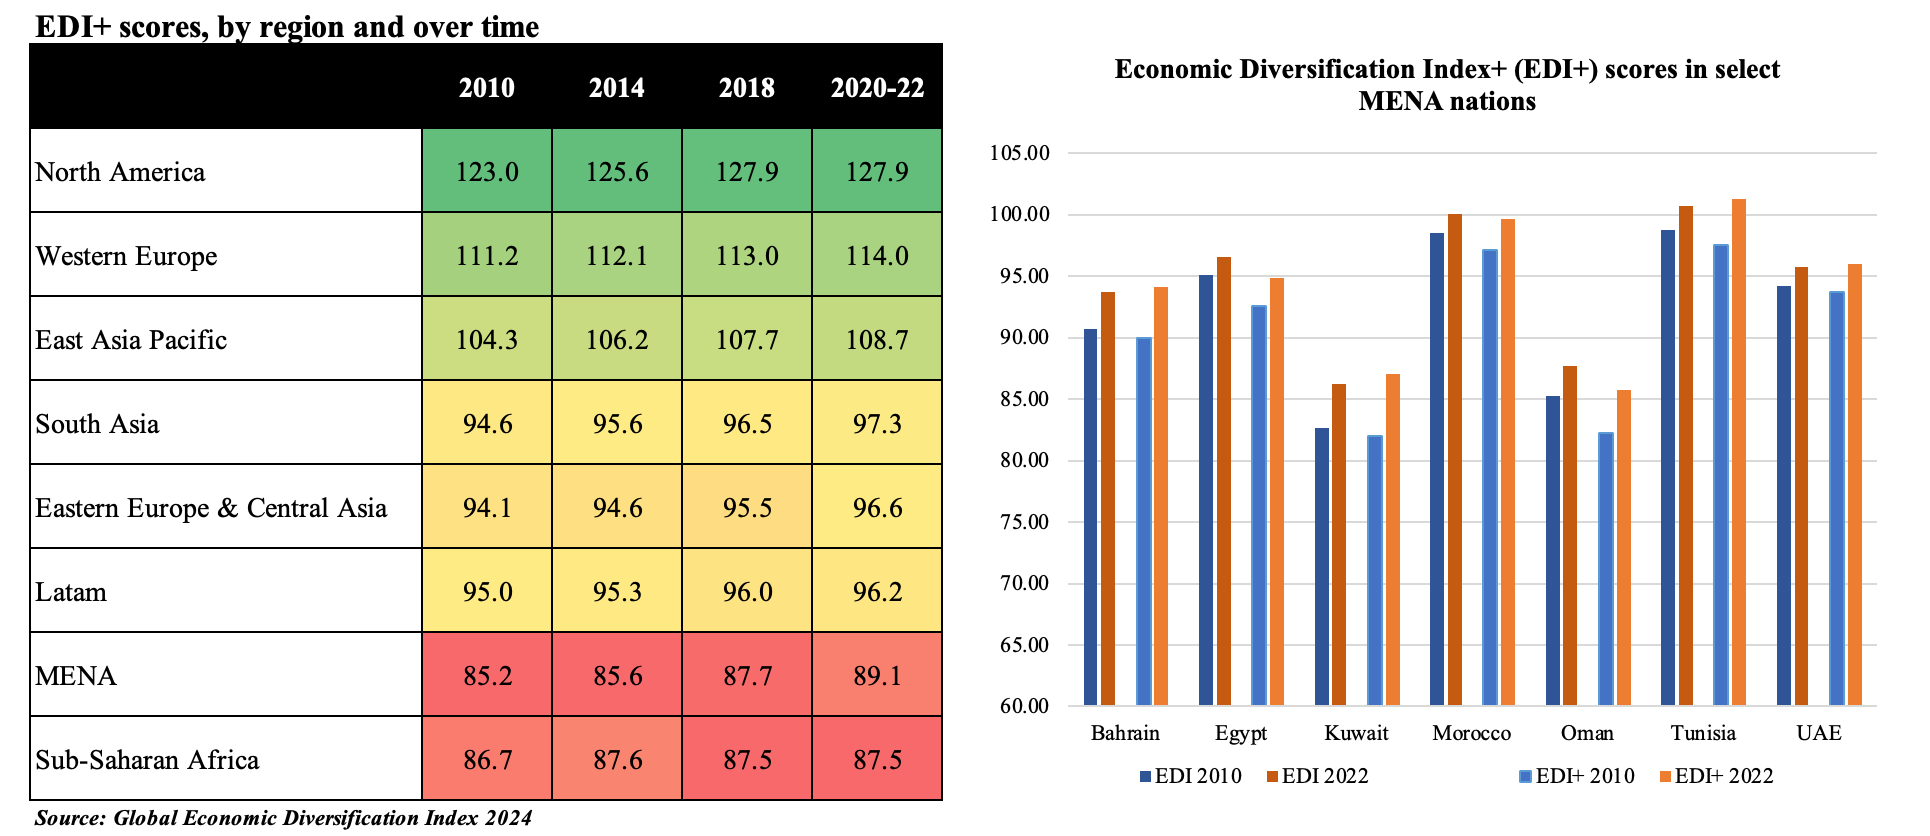
2. Economic Diversification Index by region
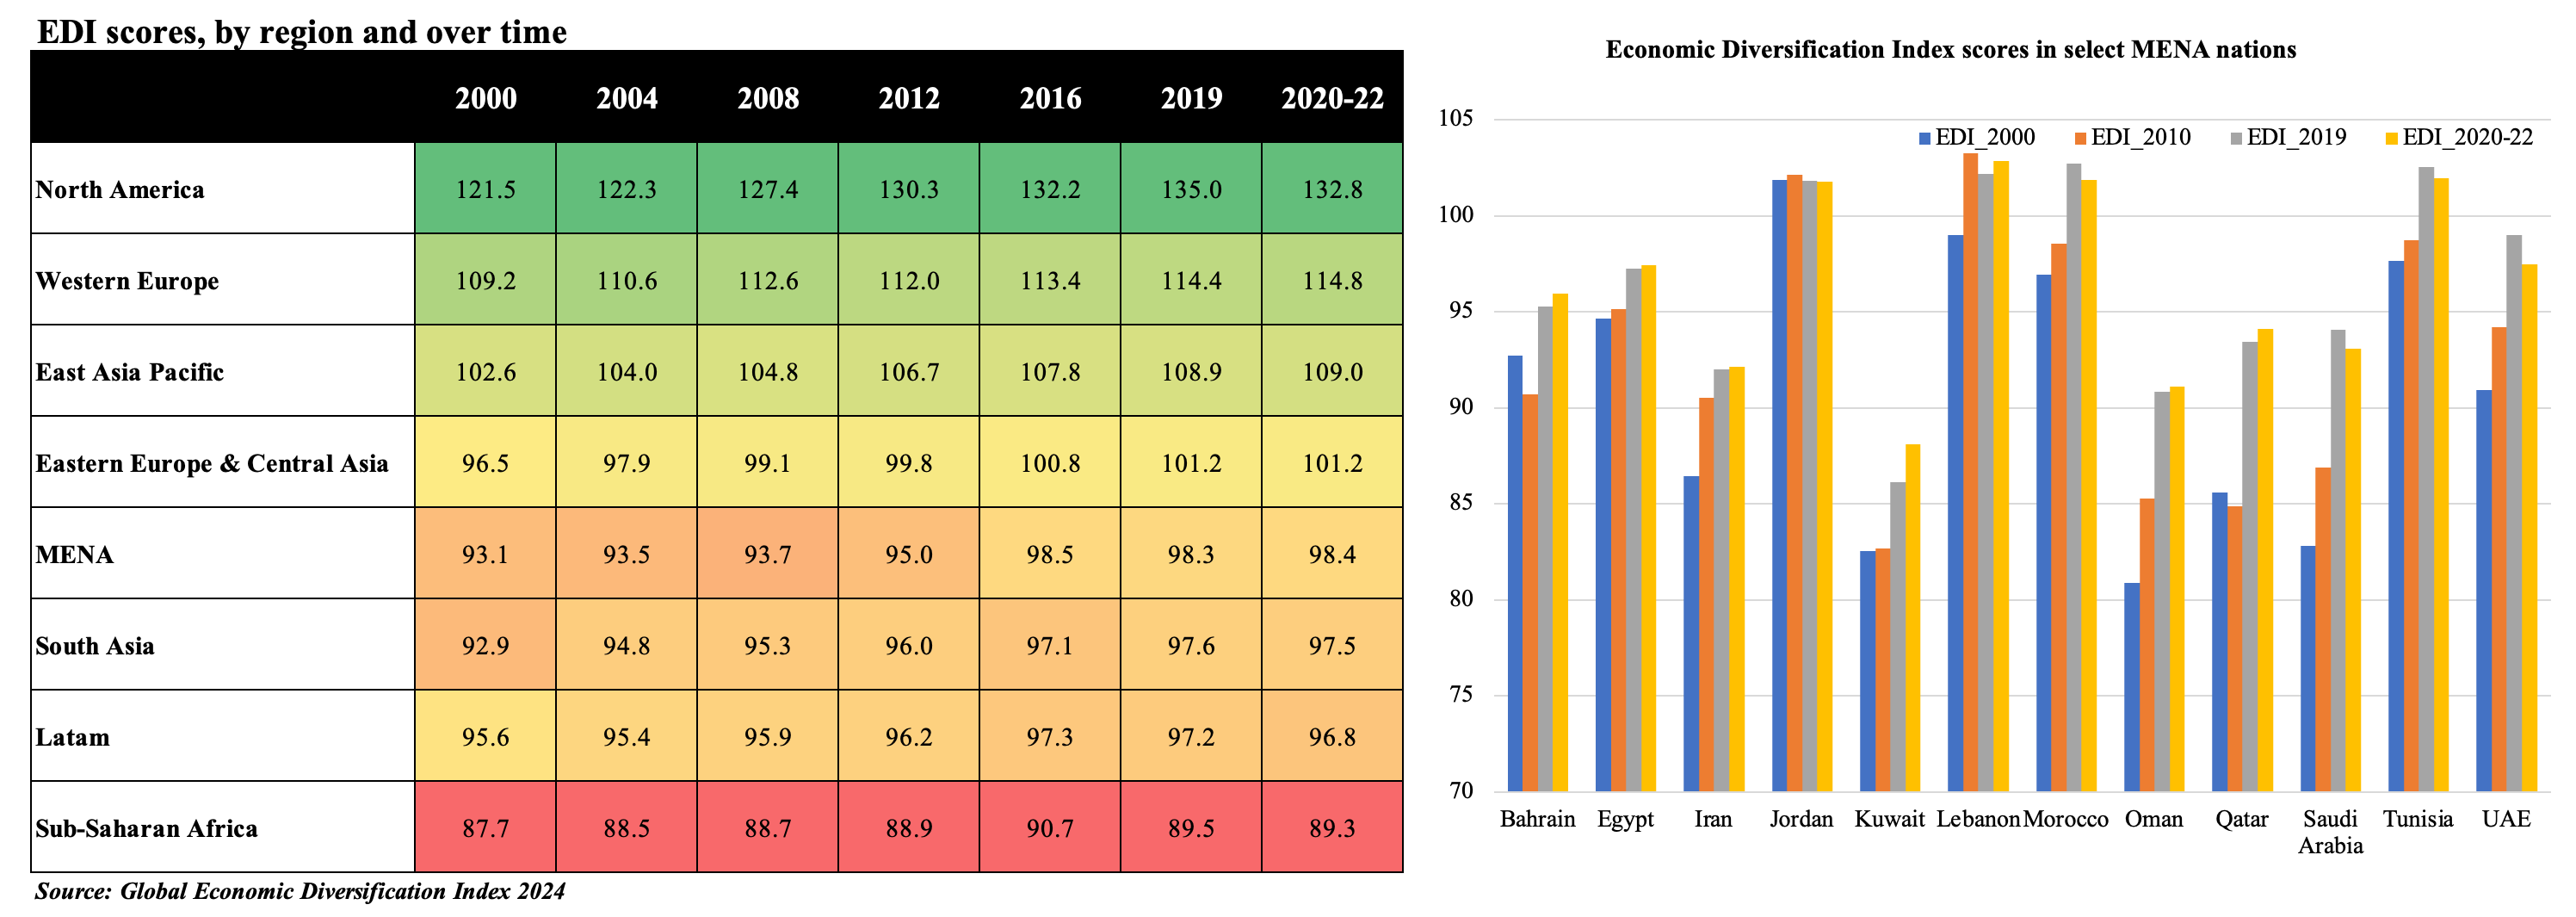
- North America, Western Europe and East Asia Pacific countries top EDI scores over the years. MENA improved scores to rank higher than both South Asia and Latin America in the post-Covid period (thanks to the accelerated pace of structural reforms & diversification efforts.
- US, China and Germany retain the top 3 ranks in the EDI for 2022, with the top 10 nations having small margins between scores (implying the strength of diversification). Twenty-six of the top 30 nations are high income, there are representatives from upper-middle income (China, Mexico, and Thailand) and one lower middle-income nation (India). Lowest EDI ranked countries are all highly commodity or natural resource-dependent. But most countries (other than GCC, Azerbaijan and Kazakhstan) are also lower-middle or low-income nations.
- MENA saw an improvement towards the latter part of the 2010s decade as many oil exporters began to accelerate diversification plans. Its performance in the output diversification sub-index remained very volatile, given oil price fluctuations. Trade diversification sub-index is where a steady improvement was evident: a combination of a drop in fuel exports (as % of total exports), increase in manufactured exports (as % of total exports) and a jump in medium & hi-tech manufactured exports (as % of manufactured exports). Revenue diversification sub-index saw only a marginal increase given lack of tax structures in many oil exporters.
- There is a large variation in performance within the MENA region group, with oil exporters having the lowest scores (though individual country-specific performance has varied over time) while nations like Morocco and Tunisia have performed better (e.g., outperform in the trade diversification sub-index given a more diversified export basket and a diverse set of trade partners).
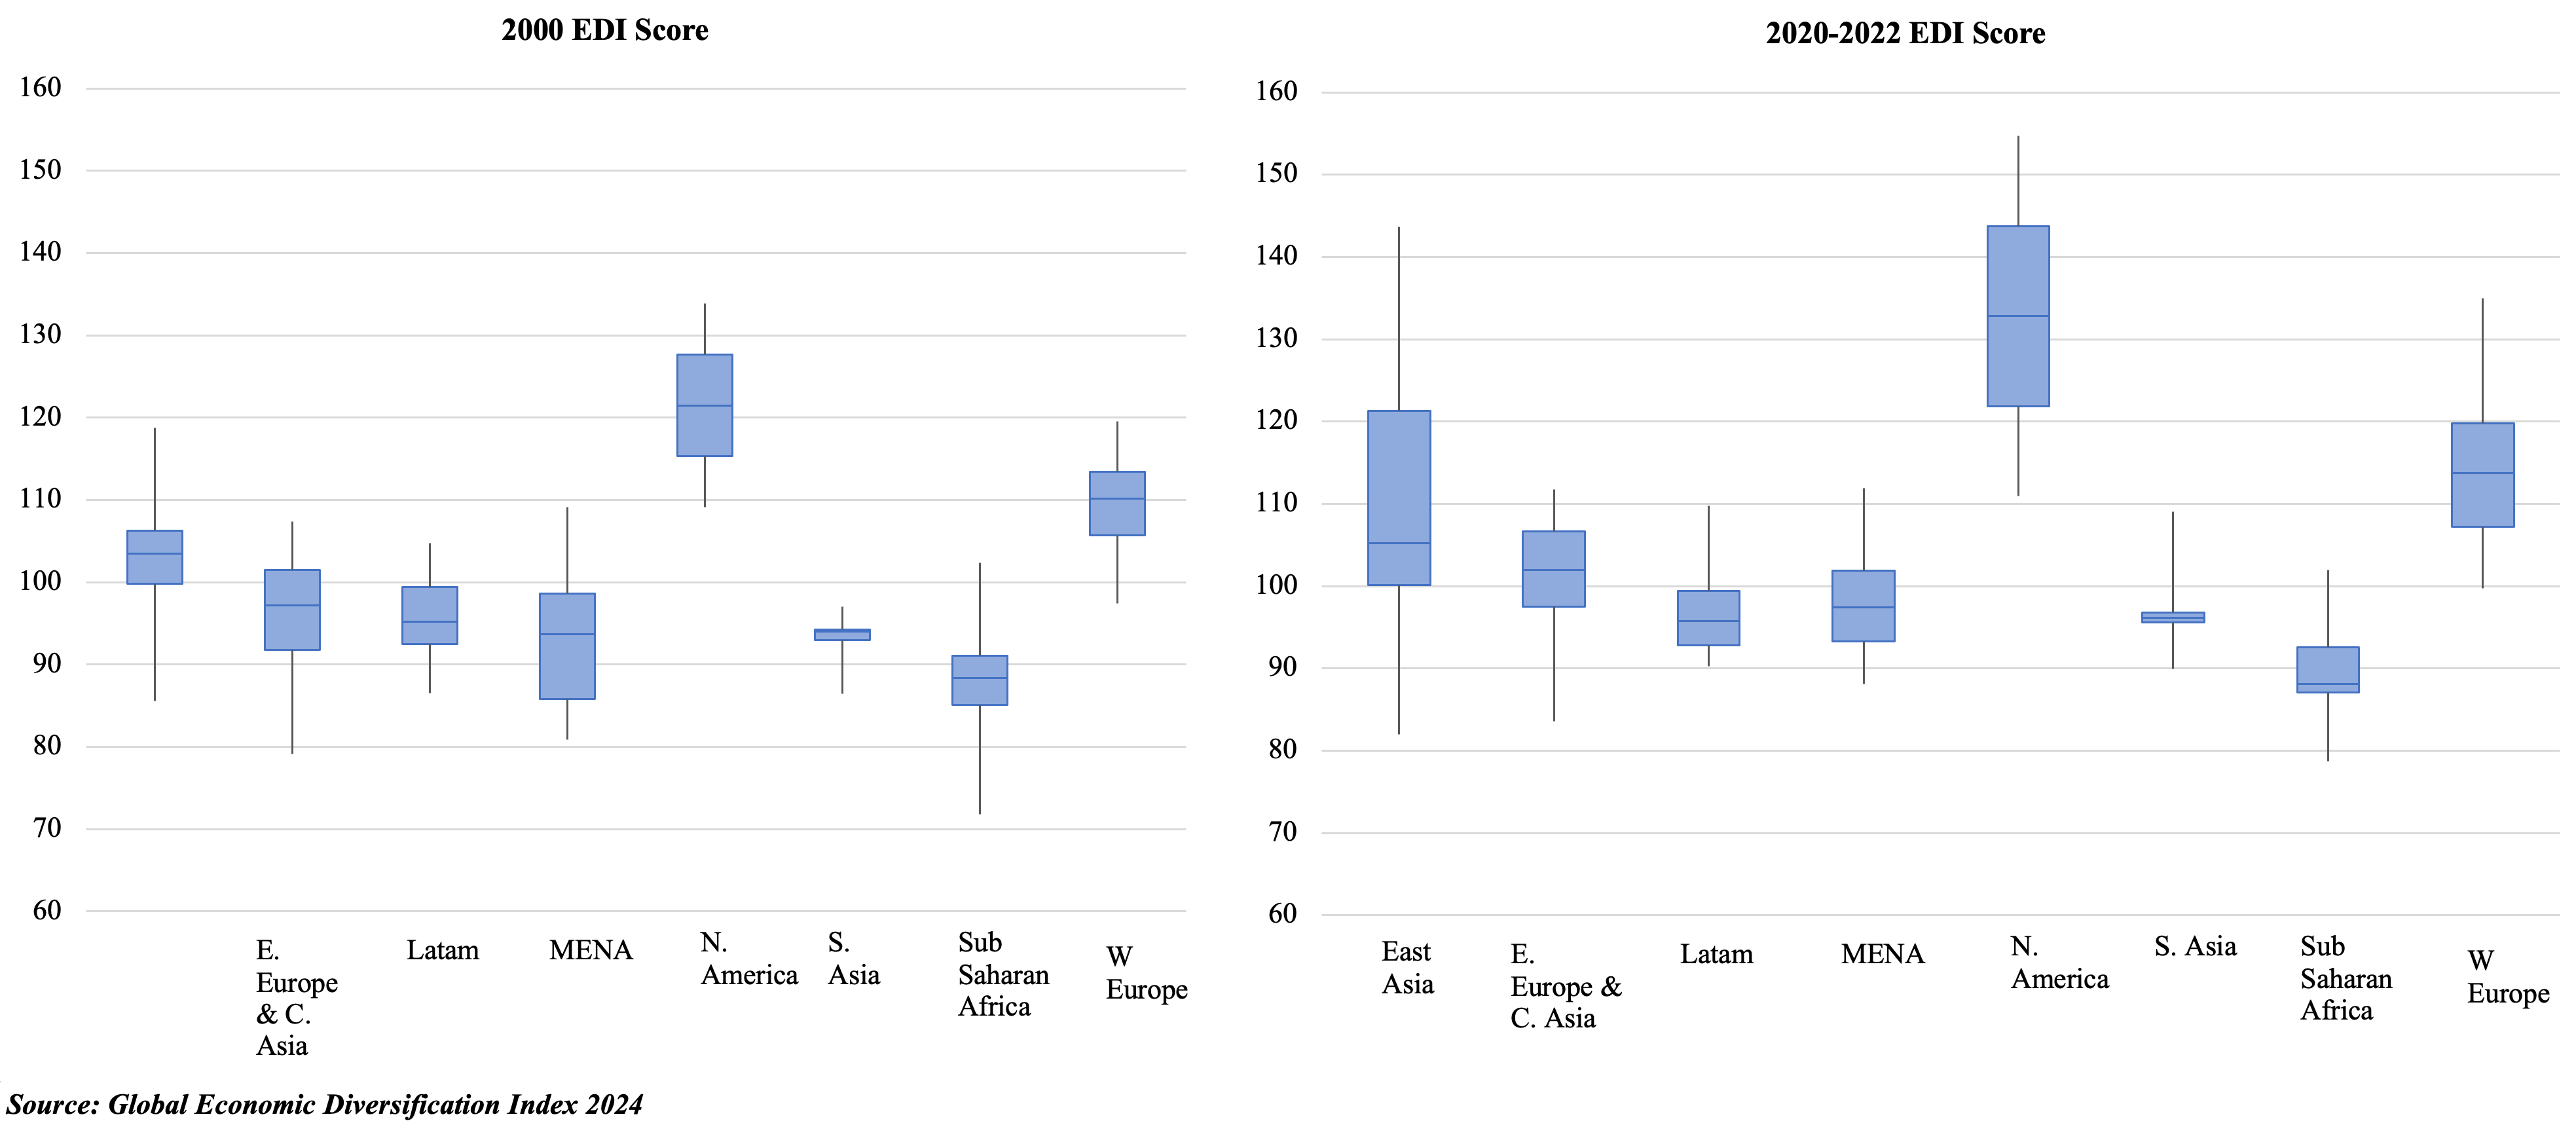
3. Wide Disparities within Regional Economic Diversification scores
- Across all regions, the median score is the lowest in Sub-Saharan Africa for both 2000 and 2020-22, and the highest in North America. When comparing these years, all regions except Sub-Saharan Africa posted an increase in their median scores.
- In 2000, the gap between the maximum and minimum score was the highest in East Asia (Japan had the highest score in this region, and it was 33.2 points more than the lowest scorer in the region Mongolia). In 2020-22, East Asia’s gap has widened further (China is the highest ranked and its gap with low ranked Mongolia widened to 61.7 points). The gap has narrowed in Sub-Saharan Africa & MENA.
- By comparing the inter-quartile range (height of the blue box), least variability is seen in South Asia in 2000, and the most in the MENA region. The variation in scores reduced in 5 of the 8 regions: MENA the most, by four points, and the other four by less than one point.
- It is interesting to note that the distribution for East Asia is skewed to the right in 2020-22 (i.e. higher EDI scores are more spread out).
- Furthermore, the lower-income and commodity producing nations in the regional group score lower than the median value (e.g., Mongolia in East Asia, or Norway and Iceland in Western Europe).
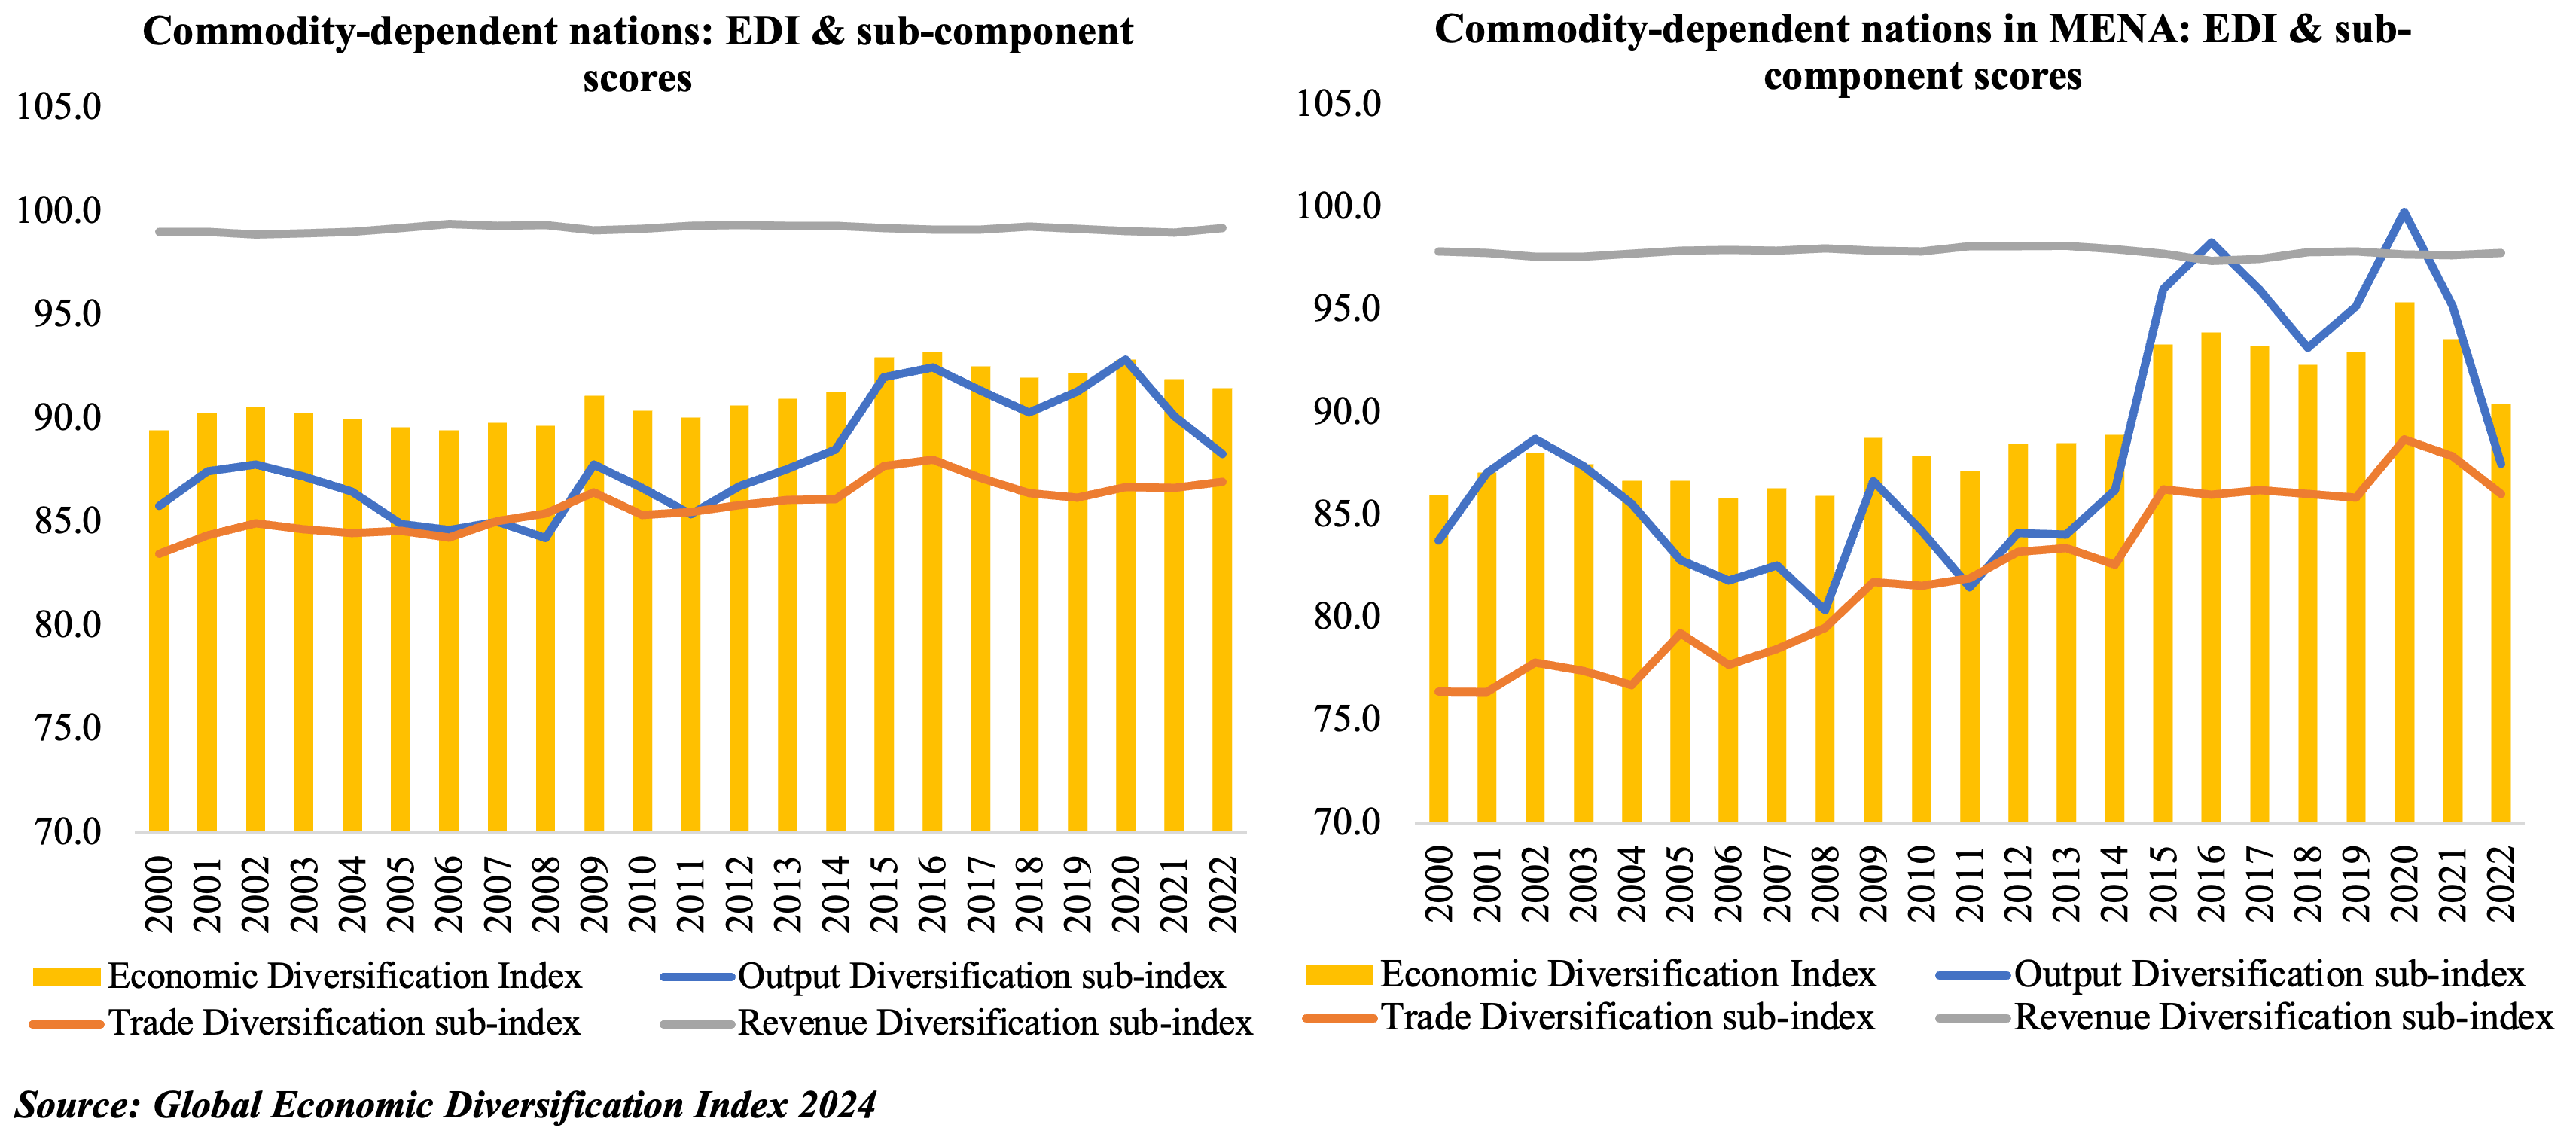
4. Commodity dependent nations improved their performance over time
- Economic diversification has been a recurring policy theme for commodity producing nations for macroeconomic stability and reducing volatility of income, investment, consumption and for job creation.
- One-third of the 112 countries covered in the EDI report are commodity exporters and interestingly, most of these are dependent on fuel exports. Commodity dependent nations have made gains in both output and trade diversification sub-indices over time.
- Many commodity-dependent nations are among the richest in the world,be it Norway or GCC nations with high levels of national income per capita. The list of commodity exporters includes high and low-middle income nations in equal numbers, and among the high-income nations MENA dominate (and understandably, all fuel-exporters).
- Commodity producers have improved their overall score (from 90.1 in 2000-03 to ~92.0 in the 2016-19 and 2020-22 periods). While gains were recorded in both output and trade diversification sub-indices (volatile in the former), revenue diversification has been holding back overall diversification gains (especially so in the MENA region where a few still lack tax structures).
- If the analysis is restricted to MENA region’s commodity exporters, there is a jump in average EDI scores (from 87.1 in 2000-03 to 93.1 in the 2020-22 period), once again supported by (highly volatile) output and (steady) trade gains.
5. GCC’s Economic Diversification performance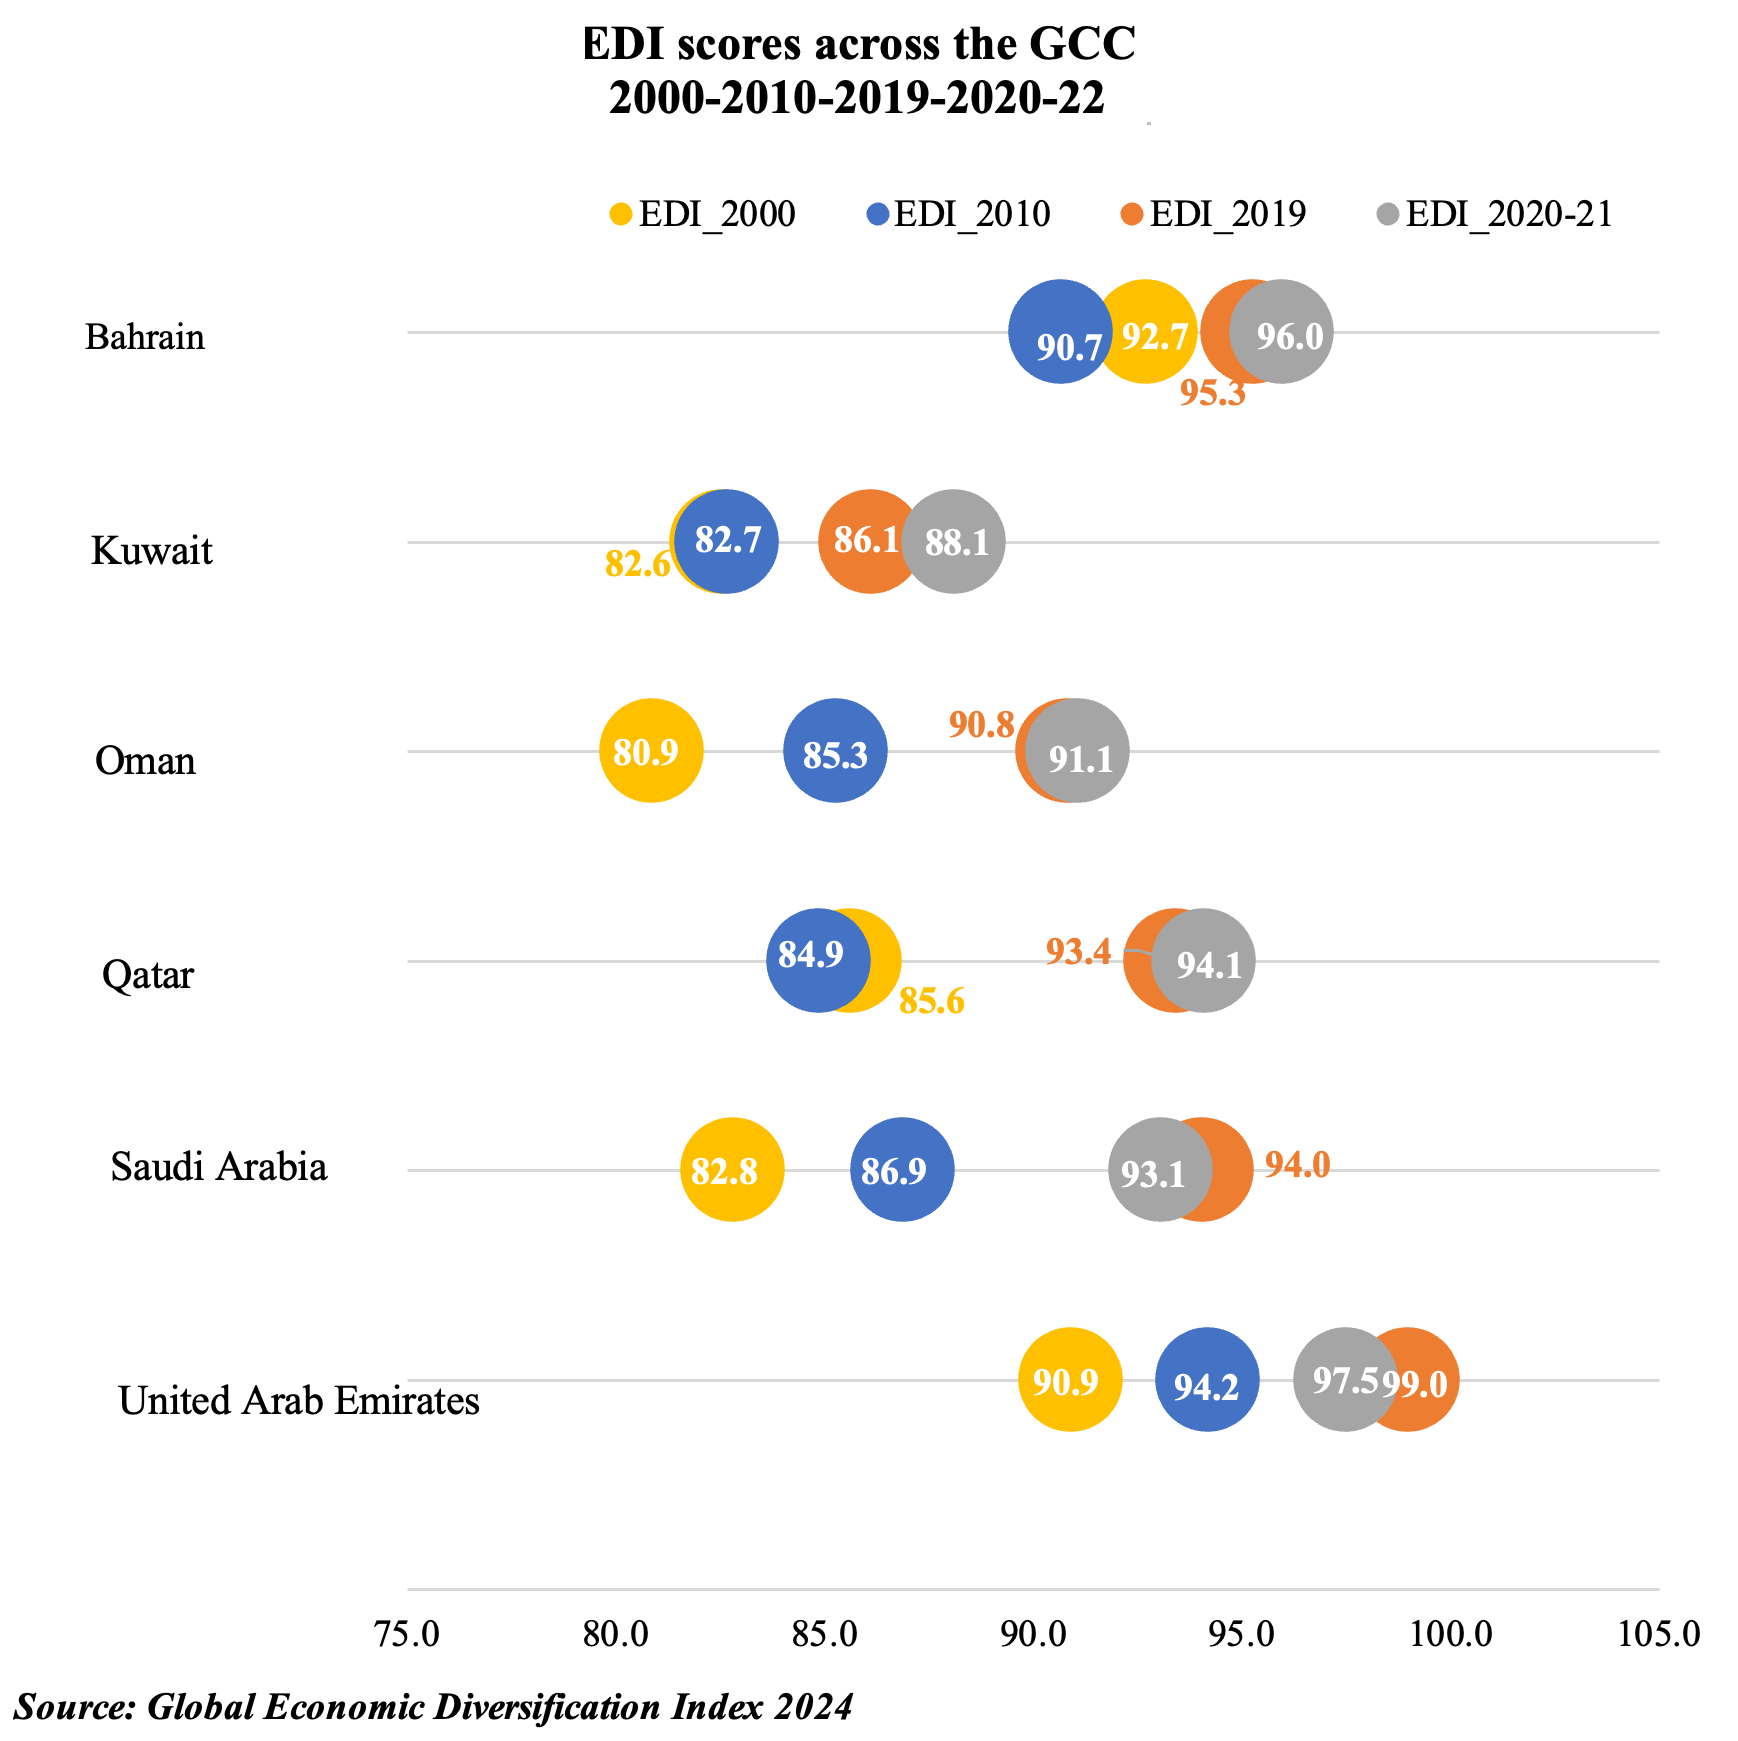
- EDI scores indicate that Bahrain had been the frontrunner in terms of diversification (in 2000) before being surpassed by UAE, as it undertook multiple reforms including opening free zones and easing the costs of doing business among others.
- Kuwait remains the laggard among the GCC nations, with overall score still below 90, while Saudi Arabia and Oman have improved the most over time.
- Oman and Kuwait still feature among the lowest ranked, the latter still among the bottom 10 ranks.
- Both the UAE and Saudi Arabia’s overall average EDI scores in 2020-2022 remained below pre-pandemic levels, with declines in both output and trade sub-indices, given the impact of the pandemic on trade and services.
- The GCC has been undertaking reforms at a much aggressive pace after the pandemic including UAE’s push to raise non-oil trade, Saudi’s opening of new sectors (e.g., industry, tourism), Oman’s fiscal consolidation plans and labour market reforms (including long-term residency) among others. Governments have also been diversifying their “national asset” portfolios, by investing in economic institutions.
- These reforms will support diversification efforts on all three fronts and will provide long-term economic resilience.
6. Post-pandemic global economy is contending with a lasting structural change: accelerated adoption of digital technologies. EDI explores this.
- EDI 2024 introduces 3 new trade indicators that capture the growth of digitalization in trade activities: digitally deliverable services exports as a % of total trade in services; ICT goods exports as % of the economy’s total merchandise exports; and international trade in ICT services as a % of total trade in services (exports flow). The new trade sub-index is called “Trade+” & the augmented EDI is “EDI+”
- Other than the Sub-Saharan Africa region, all regional groups improved their trade+ sub-index in 2020-22. While the top four ranked countries are the same in both the trade and trade+ sub-indices, of the bottom 20-ranked nations in the original trade sub-index, thirteen are worse-off when including digital indicators. This finding indicates that if adoption is delayed, existing digital divides can widen leading to deteriorating outcomes and prospects in the absence of an acceleration of reforms.
- A clear outcome across countries is that digital economy investments improve trade diversification, notably through the ability to export services. For commodity producers and exporters, the report finds that they can strongly improve their overall EDI and trade rankings by investment in and adoption of new digital technology and its services.
Powered by:
![]()