

Weekly Insights 16 Sep 2022: Economic Activity Indicators in Saudi Arabia & UAE
1. Saudi Arabia’s manufacturing sector posts double-digit yoy growth for the 6th consecutive month in July
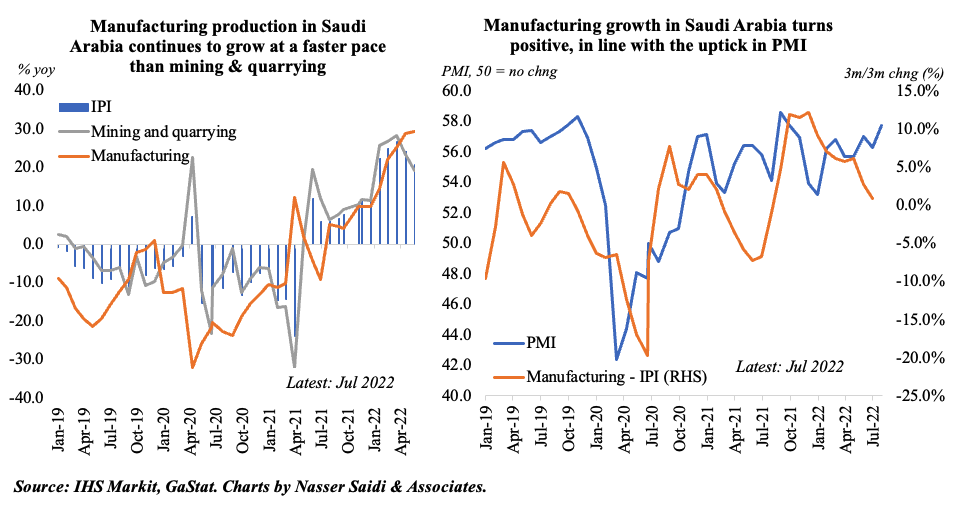
- Overall industrial production (IP) grew by 17.7% yoy in Aug, supported by mining & quarrying (+141.% yoy) and manufacturing (+32.6%). The former is supported by the increase in oil production to more than 10mn barrels per day (bpd) in Jul; manufacturing has stayed positive for 12 consecutive months, posting double-digit growth for six months
- While IP has rebounded from pandemic-lows, growth has been easing after a high 26.7% yoy in Apr 2022. The 3m-rolling average displays this easing, but the uptick in Aug PMI (to the highest since Oct 2021) & news of an increase in oil production to 11.05mn bpd in Aug bodes well for the overall index. Also positive is the news that industrial licenses issued this year touched 531 in Jul + number of existing & under-establishment factories reached 10,685 & investment volume of SAR 1.367trn
2. Consumer price inflation in Aug climbs further in Saudi Arabia, while wholesale prices ease
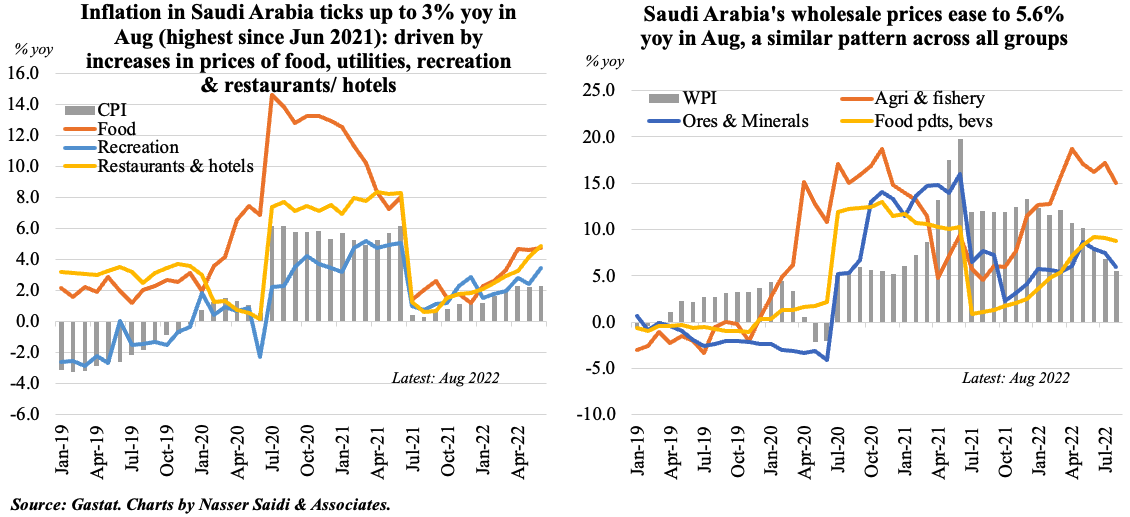
- Saudi Arabia reported a 14-month high inflation rate of 3% yoy in Aug, largely driven by food prices (4.31%) and multiple services-related activities like recreation (5.05%) and restaurants & hotels (7.35%). Transport prices inched up to 4% in Aug, after 2.5% and 3.6% rises in Jun and Jul
- The impact of inflation has been cushioned for low-income families via the distribution of SAR 10.4bn as direct cash transfers as well setting a cap on local fuel prices; this is not a sustainable measure (especially considering fiscal consolidation efforts & the net-zero commitment by 2060)
- Wholesale price inflation slowed to 5.6% yoy in Aug, with most categories easing – metal products which have a high weightage in the overall index eased to 3.16% (Jul: 5%); food products remained close to the 9% mark. Year-to-date, wholesale prices have increased by an average 11.4%
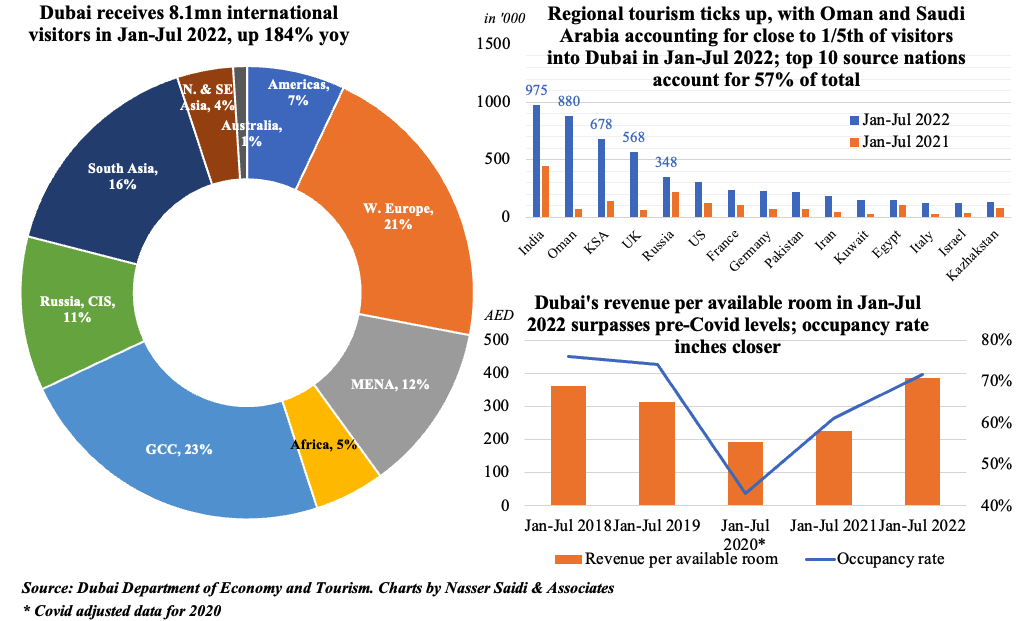
3. Dubai tourism emerges strong even during the summer months: total visits touch 8.1mn in Jan-Jul, surpassing 2021’s total (7.28mn) & almost 3X vs 2.85mn in Jan-Jul 2021. A stronger recovery is expected come winter, with lower temperatures & more events including Qatar’s World Cup
4. Will inflation play spoilsport? Dubai’s inflation rate climbed to 7.1% in Jul, averaging 4.3% in Jan-Jul
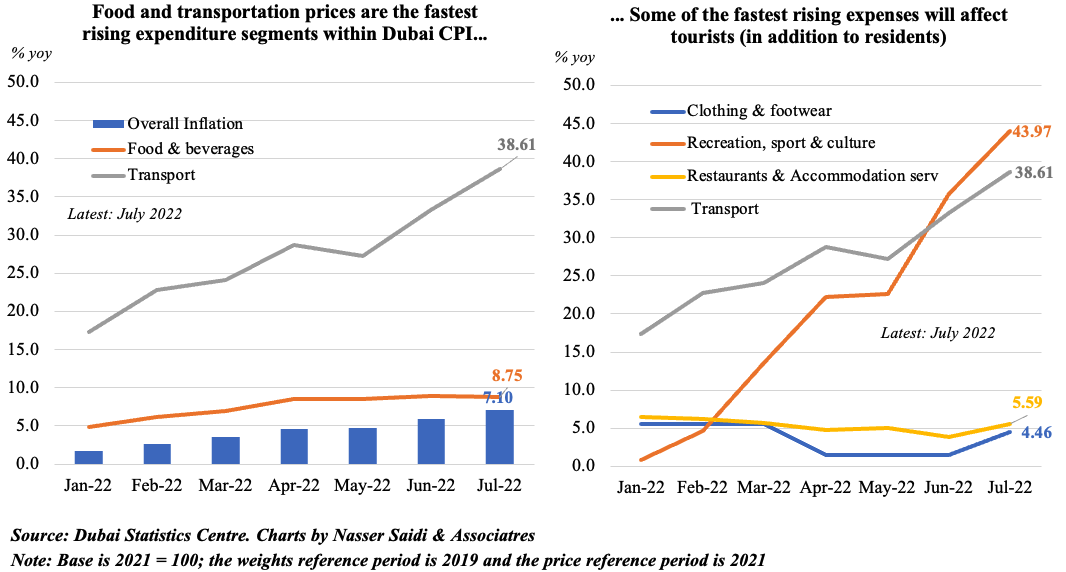
- Inflation in Dubai increased to 7.1% yoy in Jul, largely due to the rise in food and beverage prices (+8.75%) and transport costs (38.61%). These sectors have a high weight in the overall index (11.66% and 9.32% respectively) other than housing (40.68%)
- However, the price rise is evident across most categories, especially in services, many of which could affect tourist spending in the coming months: the most eye-popping is the 43.97% surge in recreation costs while smaller upticks can be seen in restaurant and hotels (5.6%) and clothing & footwear (4.5%). Another word of caution: the strong dollar and weakening euro could make visits relatively more expensive
5. Is there any evidence of wage inflation in the UAE?
- The UAE Central bank, in its Q1 Quarterly report, disclosed that based on the Wage Protection System, the number of employees and wages increased by 8.1% and 4.9% at end-Mar, the highest level since the series started in 2012
- Separately, the UAE Ministry of Human Resources & Emiratisation, disclosed in a report in Aug that the number of private sector employees grew by 9% yoy to 5.4mn in Q2 2022; fastest growth in employees was reported in the agriculture sector in Q2; ~26% of employees were working in the construction sector while another 21% and 19% were in trade and repair services and business services respectively (Caveat: both these capture mostly mainland-based firms)
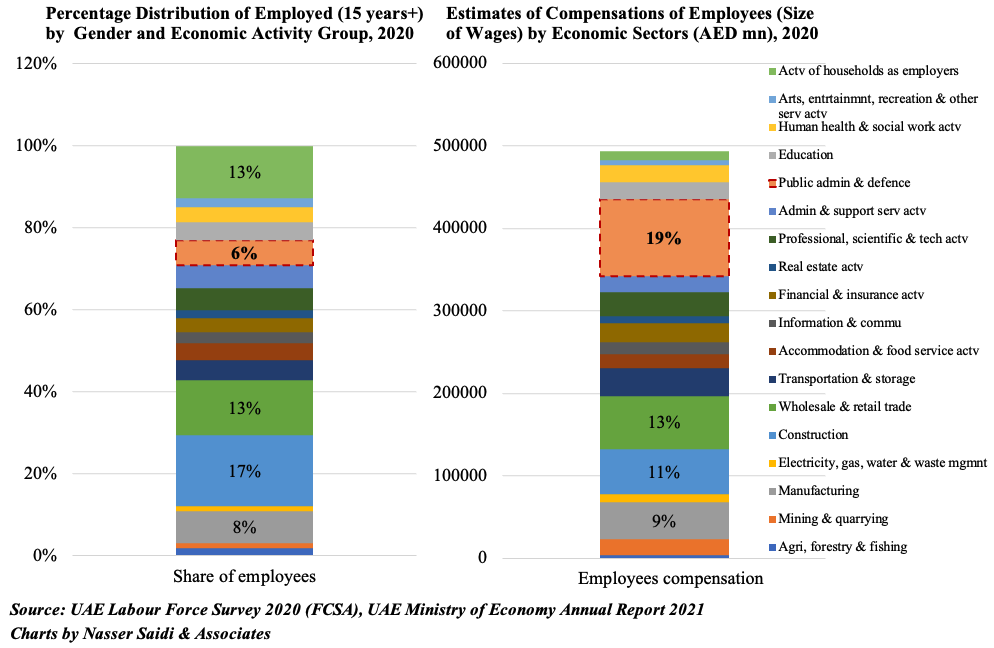
- Publicly available data for 2020 compiled from the UAE labour force survey 2020 and the Ministry of Economy (MoE) Annual Report 2021offer additional insights:
- By economic activity group, the share of employed workforce (aged 15+) in public administration & defense sector accounted for 6% of the total in 2020 (Source: FCSA Labour Survey), but account for about 1/5th of total compensation (Source: UAE MoE)
- Excluding domestic workers, female employees in the UAE worked mostly in education (12%), health & social work (8.4%) and wholesale & retail trade (7.5%) in 2020
- About 30% of total employed population in the UAE and one-third of all women work as either managers or professionals
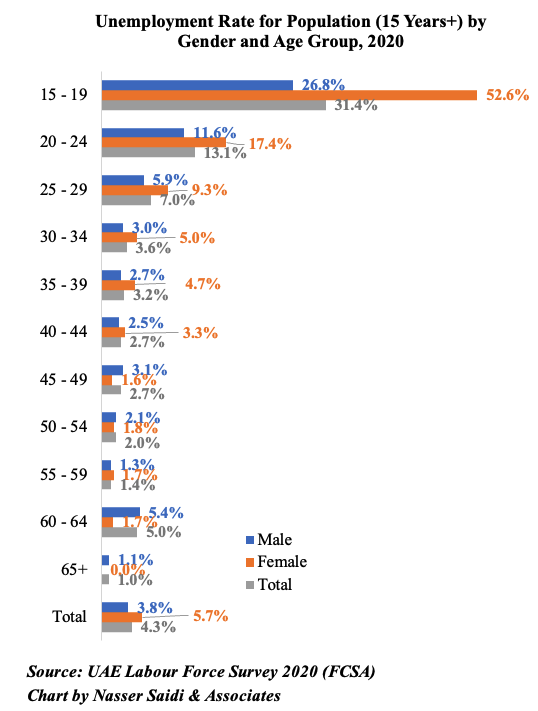
6. UAE Labour Force Survey 2020: 80% of the workforce fall within 25-49 years of age; unemployment rate is low at 4.3%, but female unemployment rate is at 5.7%
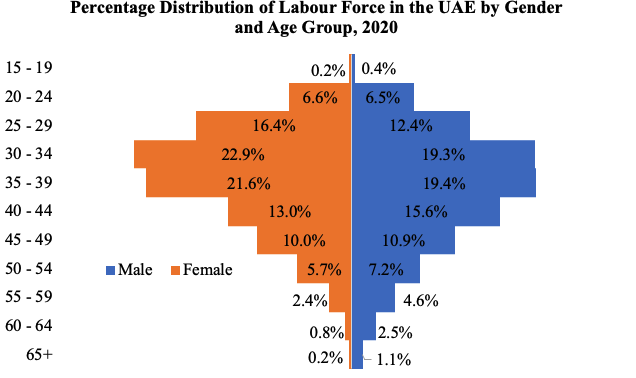
- Close to 80% of the labour force fell within the 25-49 age group in 2020; only 1% of the working women are aged over-60 (vs. 3.6% of men). Labour force participation rate was 86.4% among males and 65.7% among females
- Overall unemployment rate in the UAE was only 4.3% in 2020, the rate was much higher at 13.1% among 20-24 year olds and 7% among those in the age group 25-29
- High educational attainment, but jobless: among those unemployed, almost 40% had a Bachelor’s degree or equivalent; close to 45% of the unemployed women had completed a Bachelor’s degree
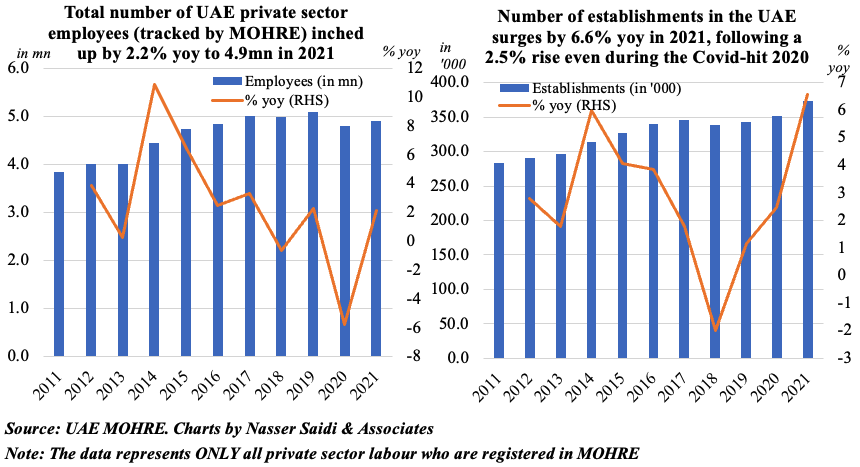
7. An overview of UAE’s private sector establishments & labour data 2011-2021
- The UAE Ministry of Human Resources & Emiratisation (MOHRE) have made available data on the number of firms and employees in the private sector (who are registered with the Ministry; likely excludes all free zone firms/ employees)
- As can be seen from the below charts, there was a downward trend in the number of employees registered with the MOHRE after 2014, with the sharpest dip registered during 2020 (-5.8% yoy due to Covid impact). However, in 2021, employees grew by 2.2% to 4.9mn. Interestingly, new firms continued to grow by 2.6% and 6.6% in 2020 and 2021, with number of establishments at a record high 373k in 2021
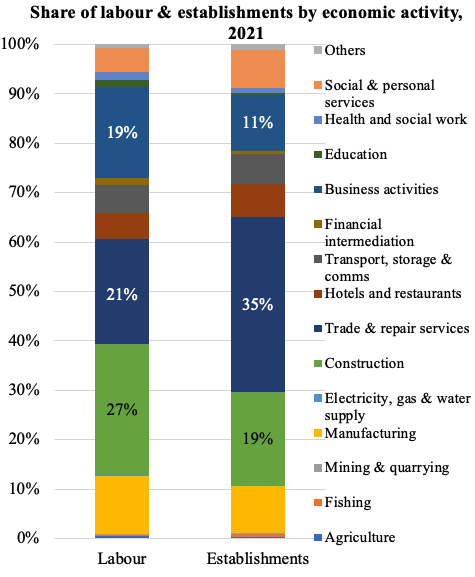
- Employees were concentrated mostly in construction and trade & repair services (together ~50% of total in 2021) while the highest share of firms were in trade & repair (35%), followed by construction (19%). The highest number of employees per firm were in education (62 per firm) and mining & quarrying (42.4)
Powered by: