


Weekly Insights 30 Sep 2021: Headwinds to Recovery in Global Trade
1. Global services trade has been lagging goods trade, still below pre-pandemic levels | Evidence from Services PMIs 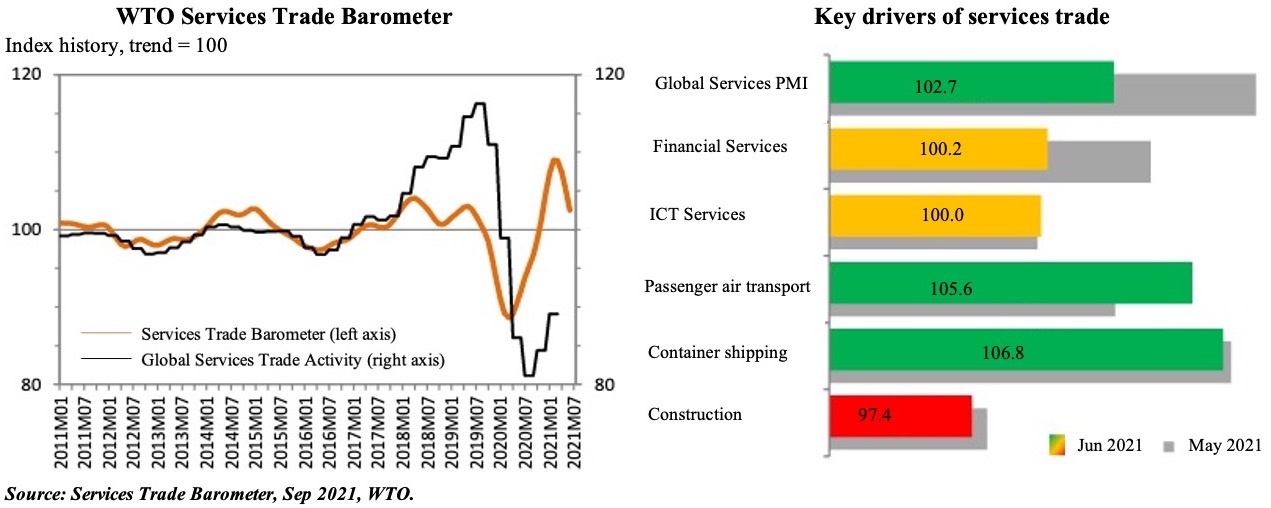
- Trade in goods seem to be on a strong recovery path, but services trade has not been keeping pace. The WTO’s Global Services Trade Activity index showed that the volume of services trade was down by 13.9% in Q1 2021 (but coming off higher declines of 26.3%, 25.5% and 20.5% in Q2, Q3 and Q4 2020 respectively).
- Services PMI readings (from Markit) seem to suggest that though recovery was underway in Q2, growth has eased sharply since. Flash PMIs for Sep showed that: (a) growth eased sharply to the lowest since May in the eurozone; (b) US expansion slide to a 14-month low; (c) UK posted the worst performance since Jan’s lockdown; and (d) Japan reported lower service sector output for the 20th consecutive month.
- Many factors were attributed to the slowdown in the services sector: weaker demand (given Delta variant’s spread and related restrictions) + supply shortages + labour supply issues (esp. in the US and the UK). This has also resulted in driving up input costs & overall prices
2. Global services trade | Evidence from Passenger & Cargo volumes 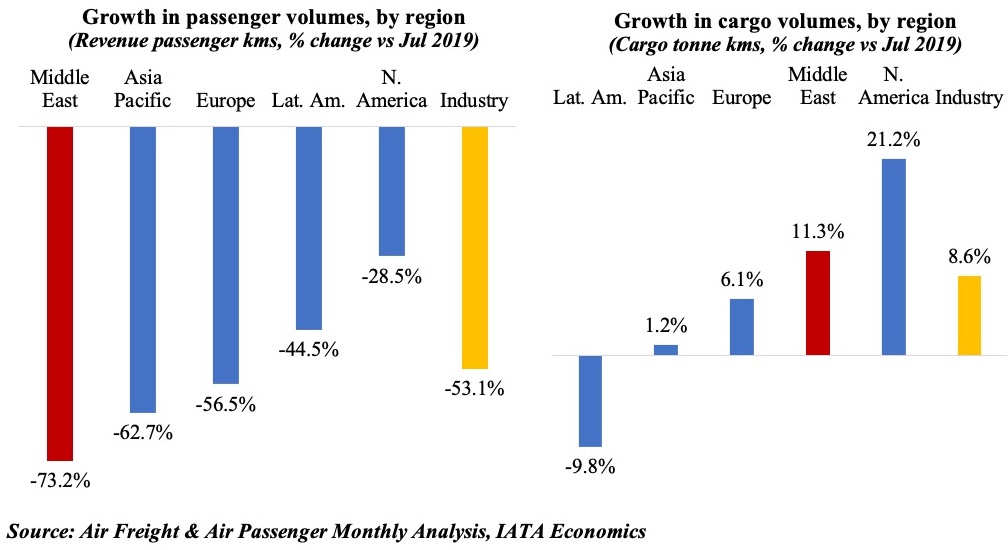
- Passenger traffic has been recovering globally, as the rollout of vaccines led to reopening of international travel while also aided by domestic passenger growth (especially in the US & China).
- The surge in Delta-variant cases in China since end-Jun has impacted domestic travel significantly; but, improving intra-European traffic has benefitted European airlines, and India has seen a resurgence in domestic traffic.
- IATA, using the DDS ticketing database, find that though travel demand for Q4 is looking stronger than last year, bookings are still only at 42% of 2019 levels.
- Revenue Passenger Kilometers (RPKs) of Middle Eastern airlines fell by 73.2% in Jul 2021 vs. Jul 2019: this was the weakest outcome amongst all regions (a result of the slow recovery of international flights) versus an industry reading of -53.1%. Passenger capacity of the region’s airlines fell by 57.5% (vs Jul 2019), also the weakest across regions.
- Air cargo recovery has been underway since May: while global supply chain issues have been a key challenge, expansions in new export orders and manufacturing production will support growth.
- Middle Eastern airlines reported the biggest improvement in Aug amongst all regions: 15.4% vs Aug 2019 & 2.4 ppts up from Jul’s expansion (ME-Asia segment gained the most)
3. Costs are on the rise: global shipping vs air cargo 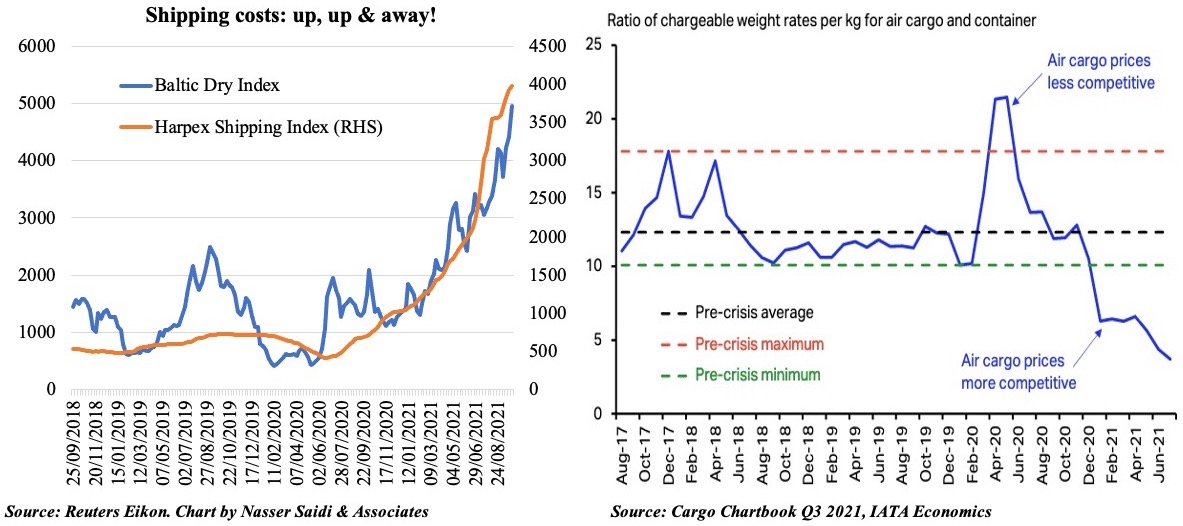
- Supply chain congestion has been pushing up prices amid an increase in demand for goods. These constraints are likely to persist for the rest of the year
- Shipping costs have been increasing – given extended idling times, container shortages, shortage of workers at ports and congested seaports. Spillover effects to the supply chain are also visible with truck and rail transport hit by further delays.
- However, air cargo has been less impacted than container shipping, thereby leading to a comparatively favourable relative price for chargeable weight.
4. Adding to price pressures: multi-year highs in oil, gas & coal prices 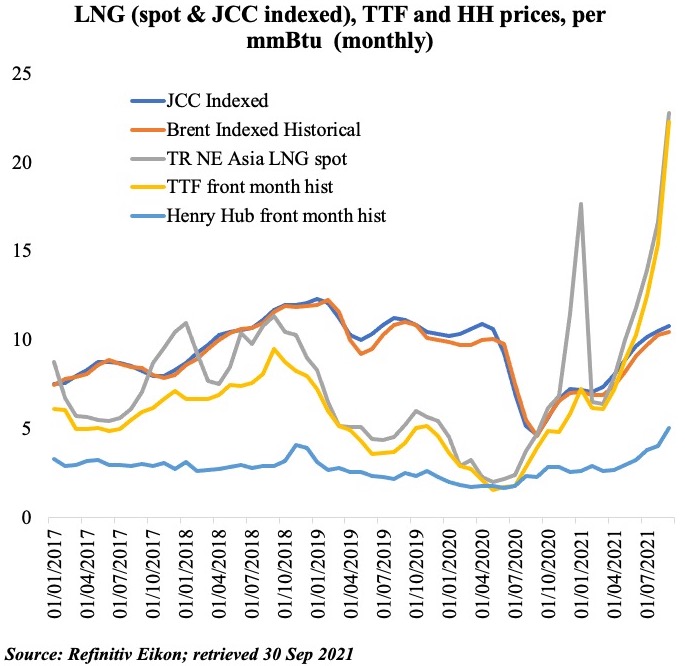
- US natural gas prices rose to a 7-year high earlier this week; gas prices in Europe and Asia traded about four times over US gas (close to USD 29 per mmBtu vs USD 6)
- Brent oil price crossed USD 80 – a 3 year high – before falling lower + coal prices have been rising (thermal coal prices are 96% higher in China this year)
- Why the surge? More than just a supply shortage amid fast-rising demand:
- US: less drilling by shale producers + recent supply disruptions from hurricanes
- Europe: low natural gas stockpiles + delayed shipments from abroad + shutdowns for maintenance works
- UK: labour shortage esp truckers to distribute fuel from refinery to retailers
- China: shutting down coal plants & power outages => rising demand for LNG as an alternative option to coal
- OPEC’s supply restrictions notwithstanding (next week, it is likely to add 400k bpd to output for Nov, as previously agreed), rise in gas prices & limited supply could see a switch towards using oil => higher oil prices
- Outlook: rising input costs + higher gas prices + weaker growth
5. Dubai’s non-oil exports surge, as it accelerates to meet the 10 X 10 goal 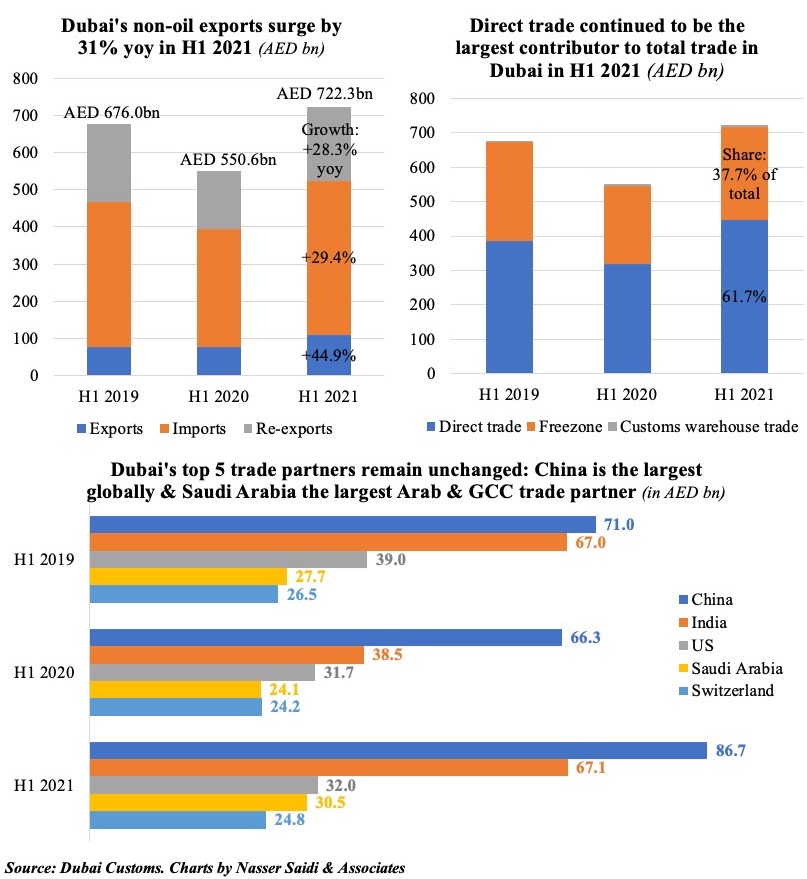
- Dubai disclosed a 31% yoy surge in non-oil exports in H1 2021. This follows the pandemic-hit drop in H1 2020, but when compared to H1 2019, trade is up by a significant 6.8%.
- This is in line with the ambition of UAE’s 10X10 program, announced as part of the “Project of the 50”. This involves an annual increase in the country’s exports by 10% in 10 key markets: China, the UK, the Netherlands, Italy, Russia, Poland, Luxembourg, Australia, New Zealand and Indonesia.
- Top trade partners for Dubai remained the same over the last 3 years: China, India and US the top 3 followed by Saudi Arabia (which is the largest partner in the Arab region) and Switzerland.
6. Saudi Arabia’s trade diversification efforts need a significant push
Oil accounted for an average ~3/4th of total exports this year 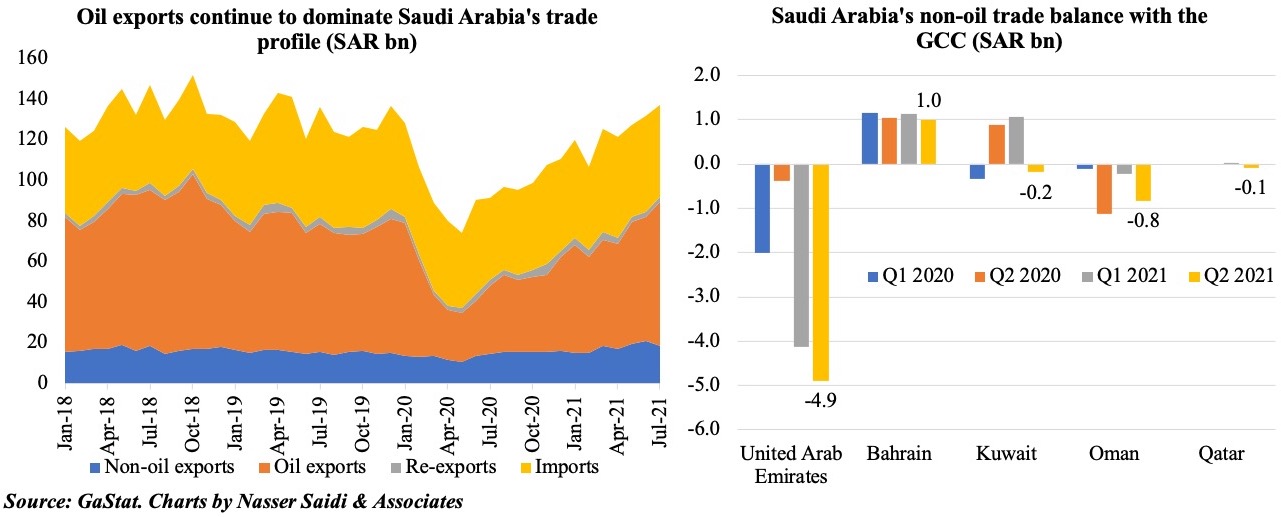
- Saudi crude oil exports rose to 6.327mn barrels per day in Jul, according to data from JODI – this was the highest reported level since Jan.
- Not surprising then that oil exports grew by 112.1% yoy in Jul, thereby supporting overall export growth (+79.6% yoy in Jul & 40.5% ytd).
- Non-oil trade deficit with the UAE widened in Jul, after new amendments were introduced from Jul related to imports. Value of imports from the UAE fell by 32.8% mom and 6.2% yoy to SAR 3.1bn in Jul: the monthly drop was the sharpest this year. As a result, UAE slipped to the 3rd largest import partner (after China and the US) from 2nd in June.
Powered by: