

Download a PDF copy of the weekly economic commentary here.
Markets
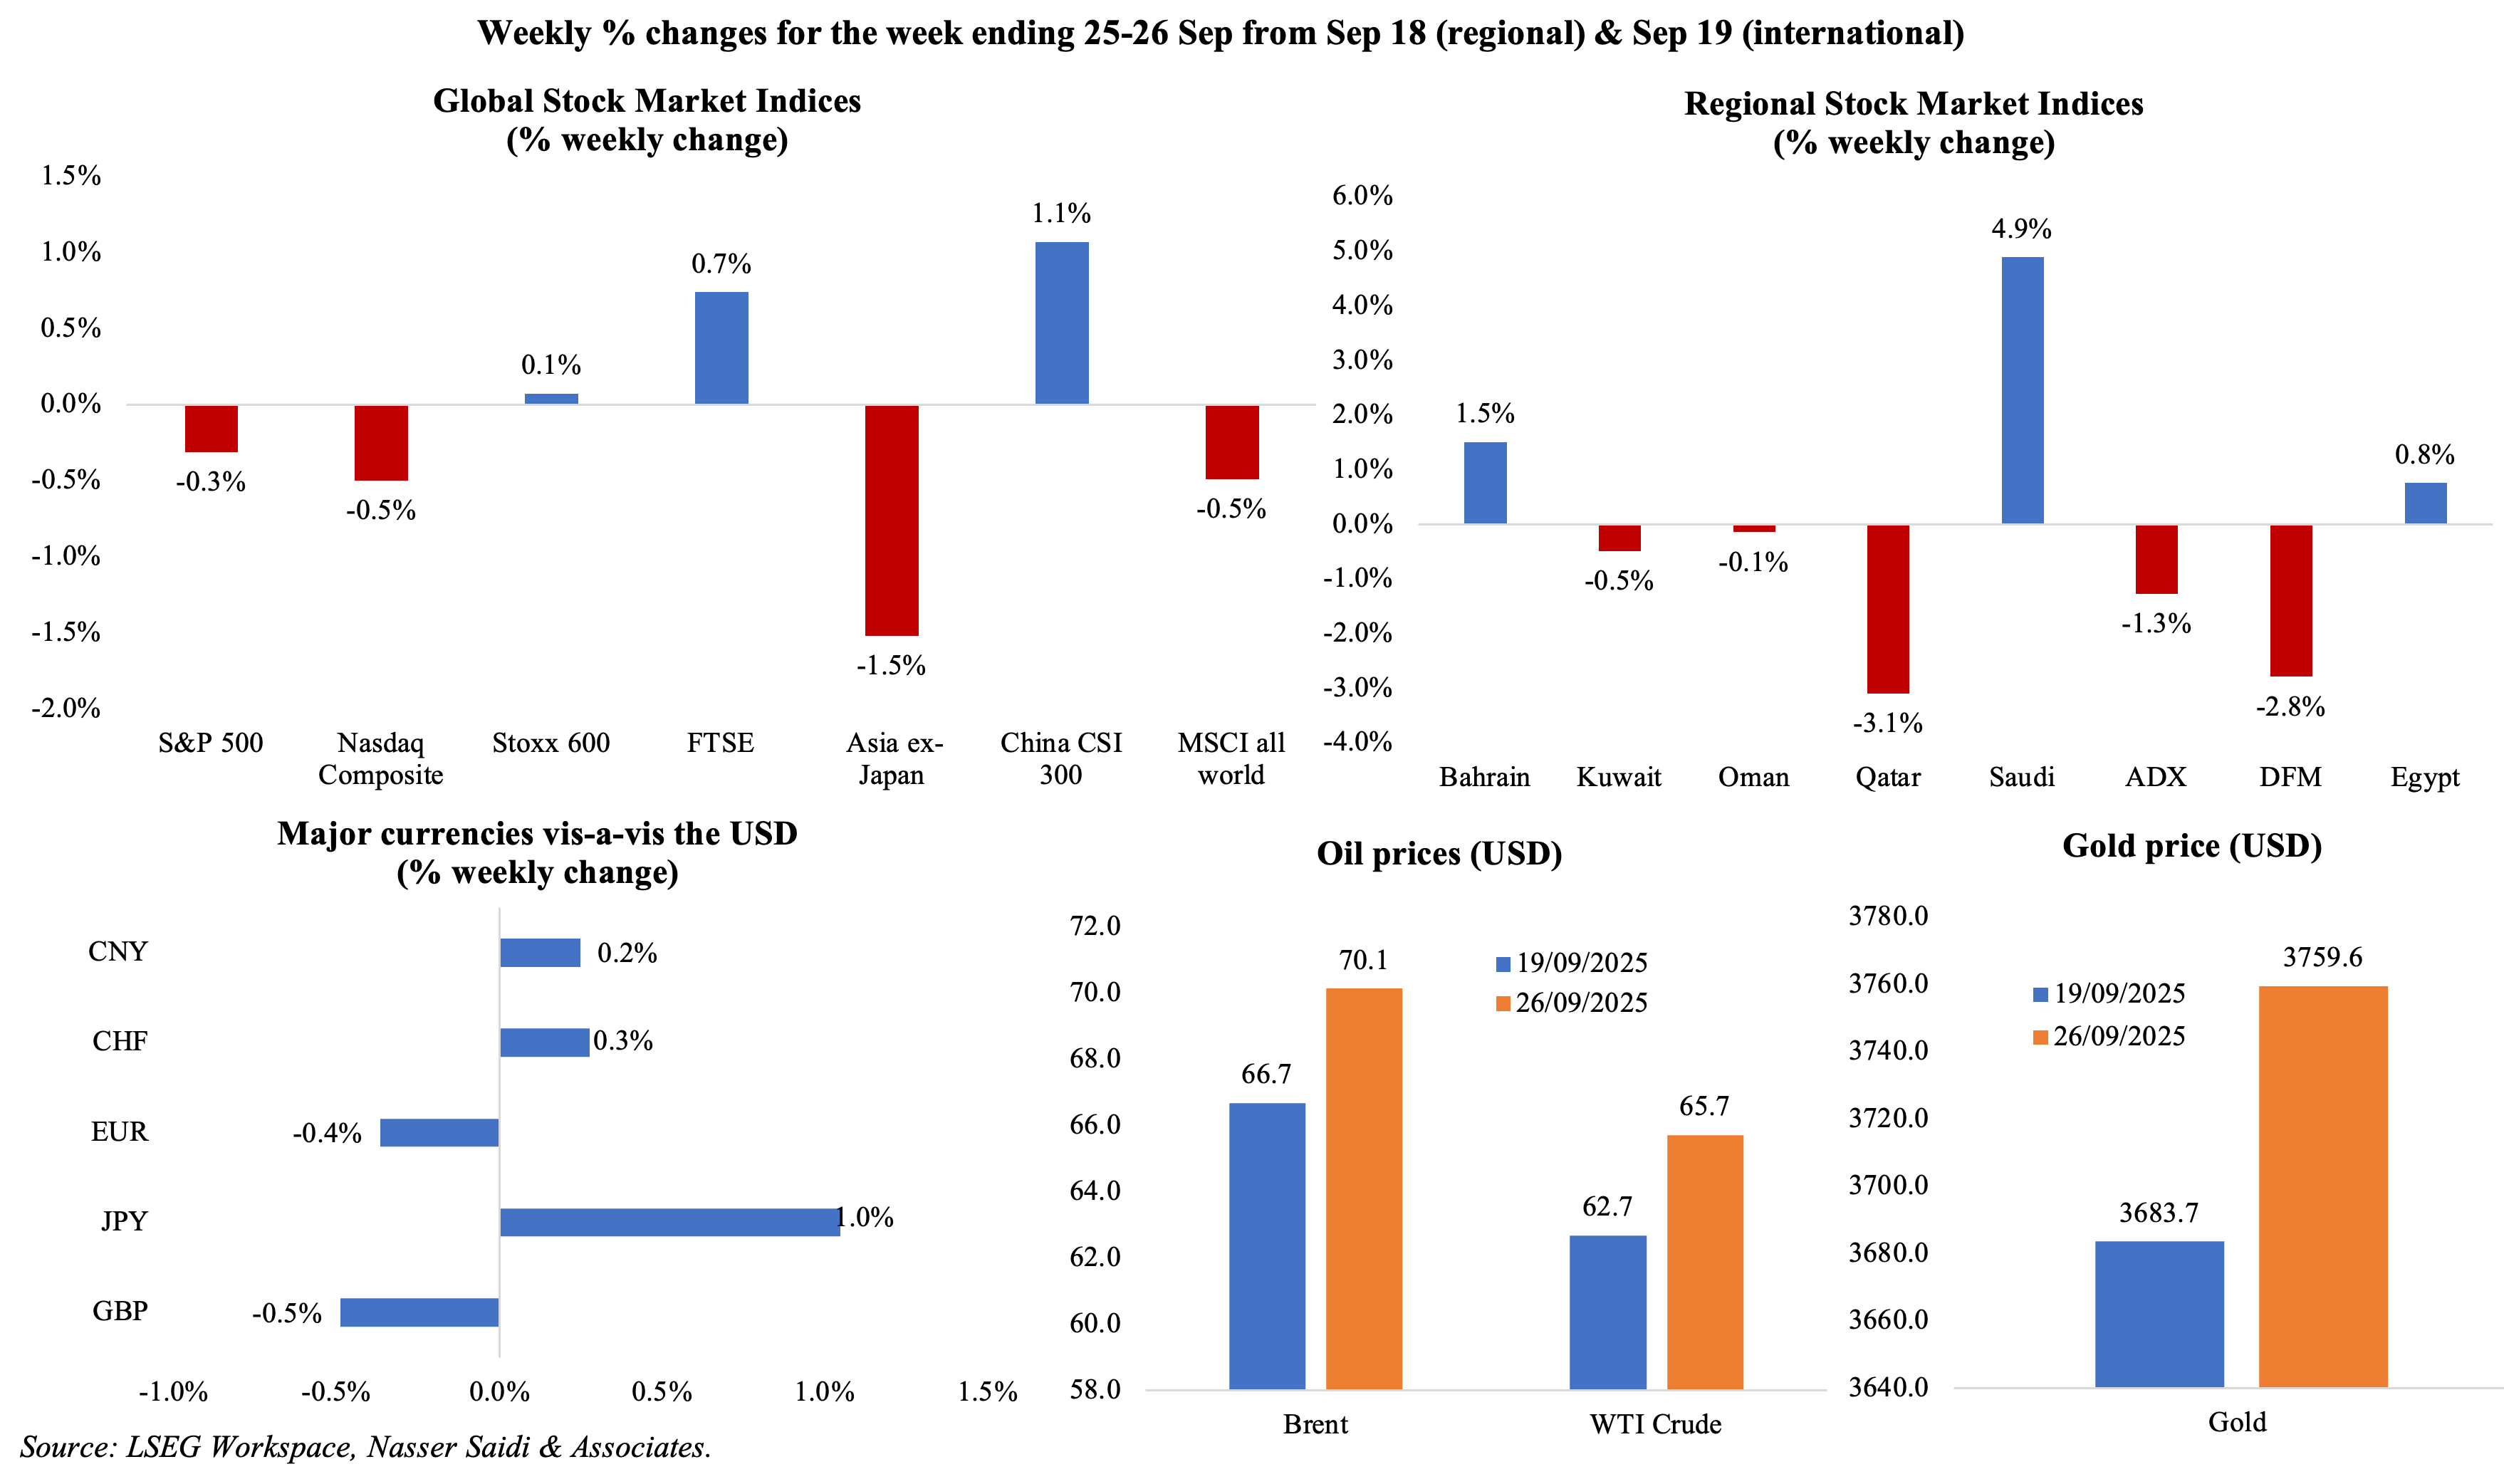
Major equity markets were mixed, with US markets ending in the red with the additional tariff hike announcement and potential government shutdown (which will begin this Wednesday if no funding agreement is reached) adding more uncertainty. Among regional markets the biggest mover was Saudi Arabia after the exchange posted its largest single-day gain in over 5 years on Wednesday on reports that the 49% ownership cap by foreigners may be relaxed; Qatar’s exchange fell to a more than 2-month low. Oil prices touched a 7-week high after attacks on Russian oil infrastructure affected exports, and on news of a drop in US crude inventories while gold held onto gains.
Global Developments
US/Americas:
- US GDP grew at an annualised 3.8% rate in Q2, up from the previous estimate of 3.3%, though Q1 growth was revised lower to a 0.6% drop. Consumer spending was revised up to a 2.5% gain (previous estimate: 1.6%). US growth remains strong along with consumer spending driven by higher wealth levels, though mainly for the invested public. This stronger-than-expected expansion raises questions about the economy’s sensitivity to interest rates and may complicate the Fed’s path forward.
- PCE price index inched up to 2.7% in Aug (Jul: 2.6%), the biggest yoy gain since Feb, while core PCE increased 2.9%, following a similar gain in Jul. Goods prices were up 0.1% mom while services were up by 0.3%; housing, food and energy costs ticked up by 0.4%, 0.5% and 0.8% respectively.
- US President Trump announced a new set of tariffs including a 100% duty on branded pharmaceutical products and 25% duty on heavy-duty trucks. These tariffs are likely to feed into higher PPI and PCE.
- Personal income grew by 0.4% mom in Aug (Jul: 0.4%) while personal spending ticked up by 0.6% (from 0.5%) – the latter on increased outlays on airline travel, stay at hotels and recreation services. Personal income increased thanks to a 0.6% jump in government transfers while wages were up only 0.3% – in line with softening labour market conditions. The saving rate hit 4.6%.
- Durable goods orders in the US rebounded in Aug, up by 2.9% (Jul: -2.7%), reflecting renewed strength in transportation equipment (+7.9%), particularly aircraft (+50.1%), and solid underlying business investment. Non-defense capital goods orders excluding aircraft rose by 0.6% (Jul: 0.8%).
- US goods trade deficit narrowed to USD 85.5bn in Aug (Jul: USD 103.9bn), with declines in both exports (down by USD 2.3bn to USD 176.1bn) and imports (down USD 19.6bn to USD 261.6bn). The decline in the trade gap is a positive development for Q3 GDP but the underlying volatility in imports given Trump’s tariffs warrants caution (more sector-specific tariff announcements cannot be ruled out).
- Current account deficit in the US narrowed to USD 251.3bn or 3.3% of GDP in Q2 (Q1: an all-time high of USD 439.8bn or 5.9% of GDP). This marks a notable shift, driven by the decline in imports (by a record USD 184.5bn to USD 820.2bn), and improved income flows from abroad.
- New home sales surged by 20.5% mom to an annualised rate of 800k in Aug – the fastest pace since early-2022 – thanks to builders offering incentives and adjusting prices to attract buyers, and lower borrowing costs (average rate on the 30-year mortgage dropped to 6.26% last week). This points to a shift in demand away from the tight existing home market – sales fell by 0.2% mom to 4mn in Aug – where inventory remains constrained and mortgage lock-in effects persist. As long as mortgage rates stay elevated, the housing market will remain bifurcated, with new construction likely capturing a growing share of buyer activity.
- Regional and national activity indicators continue to present a mixed picture. Richmond Fed manufacturing PMI plunged to -17 in Sep (Aug: -7) while the Kansas Fed manufacturing activity rose to 4.0 in Sep (Aug: 0). Chicago Fed national activity index eased slightly in Aug, to -0.12 from -0.28 the month before.
- Michigan consumer sentiment index slipped to 55.1 in Sep (prev: 55.4), the lowest since May, as expectations were revised lower (to 51.7 from 51.8) as was the current conditions sub-index (to 60.4 from 61.2). The 1-and 5-year consumer inflation expectations eased to 4.7% and 3.7% respectively (prev: 4.8% and 3.9%).
- US S&P flash manufacturing PMI fell to by one point to 52.0 in Sep, as output and new orders grew for the fourth and ninth month in a row respectively. Though input prices climbed to among the highest since the pandemic, selling prices remained steady as firms failed to pass along rising costs given weak demand and rising competition. Services PMI eased to 53.9 (from 54.5), as weak demand offset the rebound in exports and firms reported the second-highest inflation over the past 27 months.
- Initial jobless claims in the US declined by 14k to 218k in the week ended Sep 20, the lowest since mid-July, and the 4-week average eased to 237.5k (from 240.25k). Continuing jobless claims edged down by 2k to 1.926mn in the week ended Sep 13. Labour market data continue to point to a healthy, albeit gradually cooling, employment environment.
Europe:
- Eurozone’s preliminary manufacturing PMI declined to 49.5 in Sep (Aug: 50.7), as new orders dropped sharply and output growth slowed amid subdued external demand alongside a continued decline in employment. Services PMI improved, rising to 51.4 (from 50.5), driven by an improvement in new orders and employment while inflationary pressure eased.
- Euro area consumer confidence stood at -14.9 in Sep (Aug: -15.5): though it remains deeply negative, reflecting persistent concerns over fiscal policies, real wage stagnation, and uncertainty from trade tariffs, the stronger reading stems from the easing inflation and lower borrowing costs.
- Preliminary manufacturing PMI in Germany slipped to 48.5 in Sep (Aug: 49.8) as new orders fell for the first time in 4 months and export sales dropped while production expanded (though at a slower pace). Services PMI increased to growth territory (52.5 from 49.3), though there were signs of frailty (decline in new orders and employment). Looking ahead, unless industrial demand stabilizes (particularly from China and the broader Eurozone) Germany risks prolonged economic stagnation despite pockets of resilience in services.
- Ifo business climate in Germany decreased to 87.7 in Sep (Aug: 88.9), the lowest since May, as current assessment fell (85.7 from 86.4) as did expectations (to 89.7 from 91.4). Firms remained cautious, with services sector expectations plummeting to its lowest level since Feb. The downward trend in expectations highlights growing concerns about the sustainability of domestic demand and the risk of persistent industrial weakness.
- German GfK consumer confidence survey improved in Oct, to -22.3 from -23.5, though it remains historically depressed. While the income outlook improved (15.1 from Sep’s 4.1), households remained cautious, particularly regarding major purchases. Economic expectations fell for the third month (-1.4 vs 2.7) and willingness to buy also weakened (-11.6 from -10.1).
- UK preliminary manufacturing PMI slowed to 46.2 in Sep (Aug: 47), lowest since Apr, with weak domestic and export orders and lower employment. Services PMI eased to 51.9 from 54.2, with firms reporting elevated cost pressures (wage pressures, rising energy bills, food prices and technology costs) and business confidence weakened.
Asia Pacific:
- The latest minutes from the Bank of Japan reveal a debate on inflation outlook and two board members dissenting from the decision to hold rates steady. The minutes underscore concerns about yen volatility and the impact of imported inflation, which continue to complicate the domestic outlook.
- Inflation in Tokyo was unchanged at 2.5% in Sep, largely due to the government’s cuts to childcare fees and water charges and as food inflation slowed (6.9% from 7.4%). Excluding food and energy, prices slipped to 2.5% (from 3.0%). Excluding fresh food, prices held steady at 2.5%, keeping expectations alive for a near-term rate hike.
- Japan’s preliminary manufacturing PMI fell for the 14th month in a row in Sep, to 48.4 (Aug: 49.7) as new orders, foreign sales and output fell at a sharp pace.
- HSBC preliminary manufacturing PMI in India eased to 58.5 in Sep (from Aug’s 17.5-year high of 59.3): this remains higher than the long-run average, with new orders and employment increasing though at a slower pace. Output charges surged at the quickest pace in over 12.5 years. Services PMI also slowed to 61.6 (from 62.9 in Aug, the strongest since Jun 2010) as foreign sales slowed amid moderate expansions in output and job creation.
- Inflation in Singapore inched lower to 0.5% yoy in Aug (Jul: 0.6%), thanks to lower accommodation costs and unchanged food inflation as well as restrained domestic demand. Core inflation dropped to 0.3% (Jul: 0.5%), the softest increase since Feb 2021, as services inflation eased (0.4% from 0.7%) and remained well below the Monetary Authority of Singapore’s comfort zone. The MAS also kept its full-year inflation forecast for 2025 at between 0.5% and 1.5% for 2025, while warning that “geopolitical shocks could lift imported energy and shipping costs abruptly”.
- Singapore’s industrial production fell by 9.7% mom and 7.8% yoy in Aug (Jul: 8.8% mom and 7.7% yoy), reflecting ongoing weakness in the electronics sector (-4.8% yoy from 14.7%) and volatile biomedical output (-37.3% from 0.2%). The steep monthly contraction was the most in 17 months, underscoring fragility of manufacturing recovery amid uneven global demand.
Bottom line: Flash PMI readings from across the globe highlighted slowing manufacturing activity; but the more important takeaways were (a) the fading of tariff-led frontloading of inputs and finished goods; and (b) the steep increase in input costs in the US (still not passed on to the customers, but important to watch in the months to come). Final PMI readings are due this week, along with data on US non-farm payrolls (a weakening stance would support the case for rate cuts; a government shutdown could potentially delay its publication before the end-Oct Fed meeting), eurozone inflation (expected to be close to the ECB’s 2% target) and monetary policy decision from the Reserve Bank of India (this will be the first meeting after the US tariffs hike, amid the Indian rupee at a record-low and the consensus is for the RBI to hold rates steady).
Regional Developments
- Exports from Egypt grew by 6.5% yoy to USD 45.3bn in 2024, according to CAPMAS, thanks to an increase in non-oil exports (+14.4% to USD 39.9bn). Saudi Arabia was Egypt’s top export destination, accounting for 7.7% of total exports, followed by Turkey (7.6%). Overall imports climbed by 13.2% to USD 95.3bn, with China the top origin of imports (16.5% of Egypt’s imports) followed by Saudi Arabia (8.3% of imports).
- Bilateral trade between Egypt and Singapore amounted to USD 137mn in H1 2025, falling from USD 316.9mn in H1 2024. This comes from the sharp decline in imports which plunged to USD 124.8mn, less than half the USD 305.9bn recorded in H1 2024.
- Remittances into Egypt increased by 49.7% yoy to USD 23.2bn in Jan-Jul, with remittances up by 26.3% yoy to USD 3.8bn in July alone.
- Global oil companies planning to invest USD 1.6bn in Egypt during 2026-27 as the country plans to boost domestic gas production from five existing concessions, aiming to reduce energy import dependence and support industrial growth. Egypt has offered additional incentives to these firms, including permission to export part of the new production in lieu of overdue debts.
- Egypt and UAE inked five agreements focused on aviation cooperation, including fleet procurement, route expansion, training and maintenance, to deepen bilateral connectivity with aim to leverage transport links as conduits for trade, tourism and industrial integration.
- Iraq restarted oil exports from the Kurdistan region to Turkey after suspending it for about 2.5 years, following a deal signaling political and operational reconciliation. This restores a flow pipeline that had been offline, is estimated to bring up to 230k bpd of crude back into the market and improve regional supply dynamics.
- The IMF upgraded Kuwait’s real GDP growth forecast to 2.6% this year (emerging from a dip of 2.6% last year), driven by higher oil output following easing of OPEC+ cuts and robust private non‑oil demand (non‑oil growth of 2.7 %). Fiscal deficit is projected to widen to 7.8% of GDP in 2025-26, up from 2.2% of GDP in 2024-25, on lower revenues from oil. More: https://www.imf.org/en/News/Articles/2025/09/24/pr-25311-kuwait-imf-staff-concludes-staff-visit
- Kuwait oil production capacity currently stands at 3.2 million barrels per day (bpd), disclosed the oil minister: it is the highest level in more than a decade, with plans underway to increase output to 2.559mn bpd from Oct 2025.
- Kuwait announced ambitions to deploy approximately 14 gigawatts of new power capacity by 2031 covering generation, transmission, and distribution expansions. This signals recognition that energy infrastructure must keep pace with industrialization, population growth, and electrification demands.
- Kuwait is pivoting toward private sector engagement to deal with the housing crisis to clear a backlog of over 105,000 citizen requests. With housing requests rising at 3% annually, and expected demand seen at 197k by 2035, the country plans to tender multiple large-scale housing projects under long‑term concession models. The move signals a shift from direct state provision toward a regulated, market‑oriented delivery framework.
- The IMF mission in Lebanon called on the government to further enhance its newly passed Bank Resolution Law to align with international norms (i.e. strengthen protections for small depositors and tighten conflict‑of‑interest safeguards) while also pushing for more ambitious approach to the 2026 budget and tax reform (to support reconstruction and social spending). The IMF’s recommendations underscore that legal framework adjustments, not just headline legislation, are critical to restoring credibility.
- Real GDP in Oman grew by 2.1% yoy to OMR 9.36bn in Q2 2025, thanks to the non-oil sector growing at 3.8%. Among non-oil sector, services activities grew by 4.9% while industry activities inched up by just 0.2%. While petroleum sector activity rose by 0.5% in Q2, the share of oil and gas sector in Oman’s real GDP stood at 31.8%. The contribution of government, manufacturing and wholesale & retail trade sectors stood at 9.8%, 9.3% and 8.4% respectively followed by construction (8.0%).
- The Muscat Stock Exchange is planning at least three IPOs next year, as talks with the Oman Investment Authority progress. The focus will be on sectors such as tourism, ICT and logistics – all this is as part of its wider strategy to attain emerging‑market status under MSCI/FTSE benchmarks by 2026 which in turn will deepen Oman’s capital markets and broaden investor participation.
- Credit disbursed by banks in Oman grew by 8.9% yoy to OMR 34.1bn in Jul, with private sector lending up 6.4%; non‑financial corporates accounted for 46.6% and households 44.8% of the private sector loans. Simultaneously, deposits grew 6.1% to OMR 32.9bn and Islamic banking also saw strong expansion (financing +12.5%, assets +16.8%). The data reflect moderate deposit growth, healthy credit demand and improved confidence – all signalling banking system expansion.
- About 120k SMEs are currently active in Oman and registered in the Entrepreneurship Register in H1 2025, according to a recent SMEDA (Small and Medium Enterprises Development Authority) report, and total financing for the SMEs amounted to OMR 41.2mn.
- Qatar’s real GDP grew by 1.9% yoy in Q2 2025, thanks to gains in the non-mining and quarrying sector (+3.4% yoy) while the hydrocarbon sector edged down by 0.9%. Thenon-mining and quarrying sector accounted for two-thirds of overall GDP in Q2 (65.6%). Contribution of the top five non-government, non-mining & quarrying sectors (construction, financial & insurance, wholesale & retail trade, manufacturing and real estate) amounted to 43.4% of overall GDP in Q2 (and 42.8% in H1 2025). Separately, inflation inched up to 0.66% in Jul and 0.74% in Aug (Jun: 0.07%).
- While global green FDI flows stood at just over USD 1trn between 2020–24, only USD 24bn made its way into Saudi Arabia, UAE and Oman together (despite having cost‑advantaged solar potential) and even as the three nations invested USD 132bn in green projects abroad. According to Strategy& Middle East, though the GCC countries have structural advantages (such as low solar cost), it needs more enabling frameworks to attract climate finance.
- Saudi Arabia and Qatar jointly committed USD 89mn in financial support measures to Syria, including the payments for public sector employees over a 3-month period. The assistance aligns with ongoing efforts to rebuild Syria’s infrastructure and re-integrate it into regional trade and investment networks.
- Syria inked tourism‑sector investment agreements totalling USD 1.5bn to build hotels, resorts, entertainment assets and restore heritage sites, as part of a broader push for post‑conflict reconstruction. This is modest relative to prior larger investment pledges but represents potential incremental re-entry by private capital.
Saudi Arabia Focus
- Saudi Arabia’s overall exports increased to a 14-month high in Jul, up 10.9% mom and 7.8% yoy to SAR 102bn. Oil exports clocked in the highest reading this year: at SAR 68.7bn however it was 0.7% yoy lower.Re-exports surged to a record-high SAR 14.7bn in Jul, while domestic non-oil exports (i.e. excluding re-exports) grew by 5.1% mom and 0.6% yoy to SAR 19.0bn. Imports fell by 2.5% yoy to SAR 75.5bn, resulting in a wider trade surplus – SAR 26.9bn vs Jun’s SAR 19.5bn and Jul 2024’s SAR 17.5bn. China was the largest trade partner in Jul: it received 14.0% of Saudi exports and was origin for 1/4-th of Saudi imports.
- New FDI inflows into Saudi Arabia grew by 14.5% yoy to SAR 22.8bn in Q2, but were down by 3.5% qoq, according to GASTAT. FDI inflows declined by 3.5% qoq and 11.5% yoy to SAR 24.9bn while outflows dropped by 10.5% qoq and 74.5% yoy to SAR 2.1bn.
- Bloomberg reported that Saudi Arabia’s capital markets regulator is considering lifting or relaxing the current 49% cap on foreign ownership of domestic listed firms “before end of the year”, potentially allowing majority or strategic foreign stakes. Saudi equities rallied following this news, reflecting expectations of renewed foreign inflows (some estimates suggest USD 9.5–10bn in passive flows via index trackers). Such a move will increase market depth, liquidity and global integration, but more critical will be the timing of implementation, scale and the balance between passive versus active inflows.
- Saleh Abdulaziz Al Rashed & Sons, a Riyadh‑based construction materials company, received approval to float 30% of its shares on the main Saudi Exchange. The firm – which operates seven quarry sites while its main revenue streams are the sale of construction materials (aggregate and asphalt) and sale of spare parts and heavy‑equipment – plans to use proceeds to expand production and diversify into industrial minerals. Going forward, industrial value chains (mining, materials, aggregates) may see more public listings as Saudi Arabia’s construction and infrastructure pipeline remains large.
- Saudi Arabia imposed a five‑year freeze on rent increases within Riyadh’s urban area, covering both residential and commercial leases, in response to sharp recent escalation in housing costs (villa rental rates were up 13.9% yoy in Q2 and apartments up 6.9%, according to JLL). This real estate market intervention – which also mandates that vacant properties be capped at their last registered rent and imposes fines for non-compliance – is intended to curb speculative pressure and stabilize affordability.
- The Saudi Central Bank approved the use of the “Visitor ID” as a valid document for opening bank accounts within the country. The “Visitor ID” is an official identification document issued by the Ministry of Interior for visitors: this change will allow visitors to use local mobile wallets and make digital payments.
- Saudi Arabia’s assets under management touched a record USD 295bn in Q1 2025, according to S&P. The asset management industry grew 12% annually from 2015 to 2024, supported by growth in local capital markets.
- Total active commercial registrations in Saudi Arabia touched 1.7 million in Q2, with over 80k new filings, according to the SME Monitor report by Monsha’at. The report highlights strong youth (38 %) and female (47 %) participation in new enterprises, with vigorous growth in e‑commerce and digital sectors. Venture capital funding jumped 116% yoy to SAR 3.225bn across 114 deals (+31%) in H1 2025.
- Saudi Arabia and China signed 42 international agreements worth more than USD 1.74bn at the Saudi-Chinese Business Forum in Beijing. The deals covered sectors such as advanced industries, smart vehicles and energy. It was also revealed that Chinese investment in Saudi Arabia grew about 30% in 2024, with total investments standing at more than SAR 31bn. Saudi investments in China exceed SAR 8bn, alongside MoUs with Chinese financial institutions valued at USD 50bn.
UAE Focus
- The UAE government launched the “Emirates: The Startup Capital of the World” campaign with an ambition to scale the number of startup firms to over 2 million by 2031 and produce 10 unicorns (five already established), signalling a structural pivot toward innovation and private‑sector dynamism. Looking ahead, success will hinge on the quality of the enterprises and ensuring increased depth of the ecosystem (i.e. capital, talent, regulation and market access).
- Dubai retained its spot as the world’s top destination for attracting Greenfield FDI projects in H1 2025, underscoring investor confidence in the Dubai story and business climate. Dubai attracted a record 643 greenfield FDI projects in H1 2025; total announced projects stood at 1090 (28.7% yoy), FDI capital inflows were up 62% to USD 11.0bn and estimated jobs stood at 38,433 (third highest globally, and up 47%). Business services was top sector in terms of both announced FDI projects and by capital inflow while UK, US and India invested in close to 50% of total number of projects in H1 2025.
- Bloomberg reported that the UAE’s largest aluminium producer, Emirates Global Aluminium (EGA), is in potential discussions for an IPO – no firm timeline or details such as listing location were disclosed. This will deepen the market and could become a template for other industrial firms. For investors this would represent potential access to a large non-oil industrial issuer in the Gulf, with exposure to base metals and upstream value chains.
- Non‑oil bilateral trade between the UAE and US grew by 44.5% yoy to USD 38bn in 2024 and touched USD 19.3bn in H1 2025 reflecting diversification beyond hydrocarbons. US is the UAE’s sixth largest trade partner.
- Presight (backed by AI company G42) and Sharjah government-backed Shorooq announced a USD 100mn global AI fund to invest in areas such as smart cities, energy, fintech, gaming and deep tech. Based in ADGM, the fund signals the UAE’s push to support high-impact projects and become an outbound capital hub in the global AI race.
- XRG, the international investment arm of ADNOC, acquired an 11.7 % stake in the Rio Grande LNG project in Texas: this is its first direct gas infrastructure investment in the US. ADNOC also secured a 20‑year LNG purchase commitment for part of the offtake (for 1.9 million tons per annum of LNG from Rio Grande’s fourth train). This signals UAE’s strategic pivot into global gas value chains and such deals could anchor a new class of upstream and midstream investments led by GCC capital in Western energy markets.
- Trade conducted by economic zones under the Dubai Integrated Economic Zones Authority (Dubai Airport Free Zone, Dubai Silicon Oasis, and Dubai CommerCity) grew by 19% yoy to AED 336bn (USD 91.4bn) in 2024. This was the fourth consecutive year of growth and its share of Dubai’s non-oil trade jumped to a record 13.7%. The machinery, electrical and electronics sectors together accounted for about 72% of DIEZ’s total trade.
- Abu Dhabi announced an ambitious housing programme comprising development of 13 new communities for citizens with over 40,000 units and plots at a total cost of AED 106bn (USD 29bn) and targeting completion by 2029. The new projects will increase the total number of new homes and residential plots under development in the city to 45k.
- Real estate transaction volumes in Dubai surged 44.5% yoy to AED 153.7bn (USD 41.85bn) in Q2; wider UAE property sector performance has been led by strong demand in the off‑plan market and fresh launches in Dubai and Abu Dhabi. Residential and secondary markets in Dubai also expanded, with sales transactions rising 22.8% and 17.1% respectively, while rentals also registered solid gains. Over the coming quarters, growth in deals may moderate and policymakers should monitor carefully the absorption of the incoming supply.
Media Review:
Lebanon prepares plan to address losses from financial crash
Will Dubai’s super-hot property market avoid a crash?
The influence of ‘geoeconomics’ is growing
https://www.ft.com/content/4cb08d34-9d76-4966-b2b6-810f0c9d0e0c
Fiscal Rules Foster Stability as Spending Pressures Grow
Powered by:
![]()