Trump’s Visit to the GCC: the Art of the Deal? How does this affect existing GCC-China links? Weekly Insights 16 May 2025
1. Trump’s visit to the Middle East: This time is different!
President Trump is visiting a very different & transformed Gulf region compared to his first term.
- It is relatively less oil-dependent now; become more diversified in terms of output activities, trade & investment and fiscal revenues
- The GCC has also been prioritising greater regional economic integration and opening up to rest of the world
- Vs 2017, GCC have benefitted from the introduction of a spate of transformative structural reforms
- GCC countries have become more attuned to climate change, investing and adjusting to the energy transition + becoming leading investors in clean and renewable energy, as well illustrated by Mubadala & Masdar
- Its aspirations into becoming key new technology users/ investors has been a critical shift in recent years (and a basis for the many agreements signed in the region)
Bottomline: Trump’s trip highlights the build up of GCC’s “soft power” – be it the involvement of the UAE, Saudi, Qatar and Oman in leading the negotiations for a ceasefire in Gaza & Ukraine (including release of prisoners), support for the new Syrian government or the ongoing negotiations with Iran.
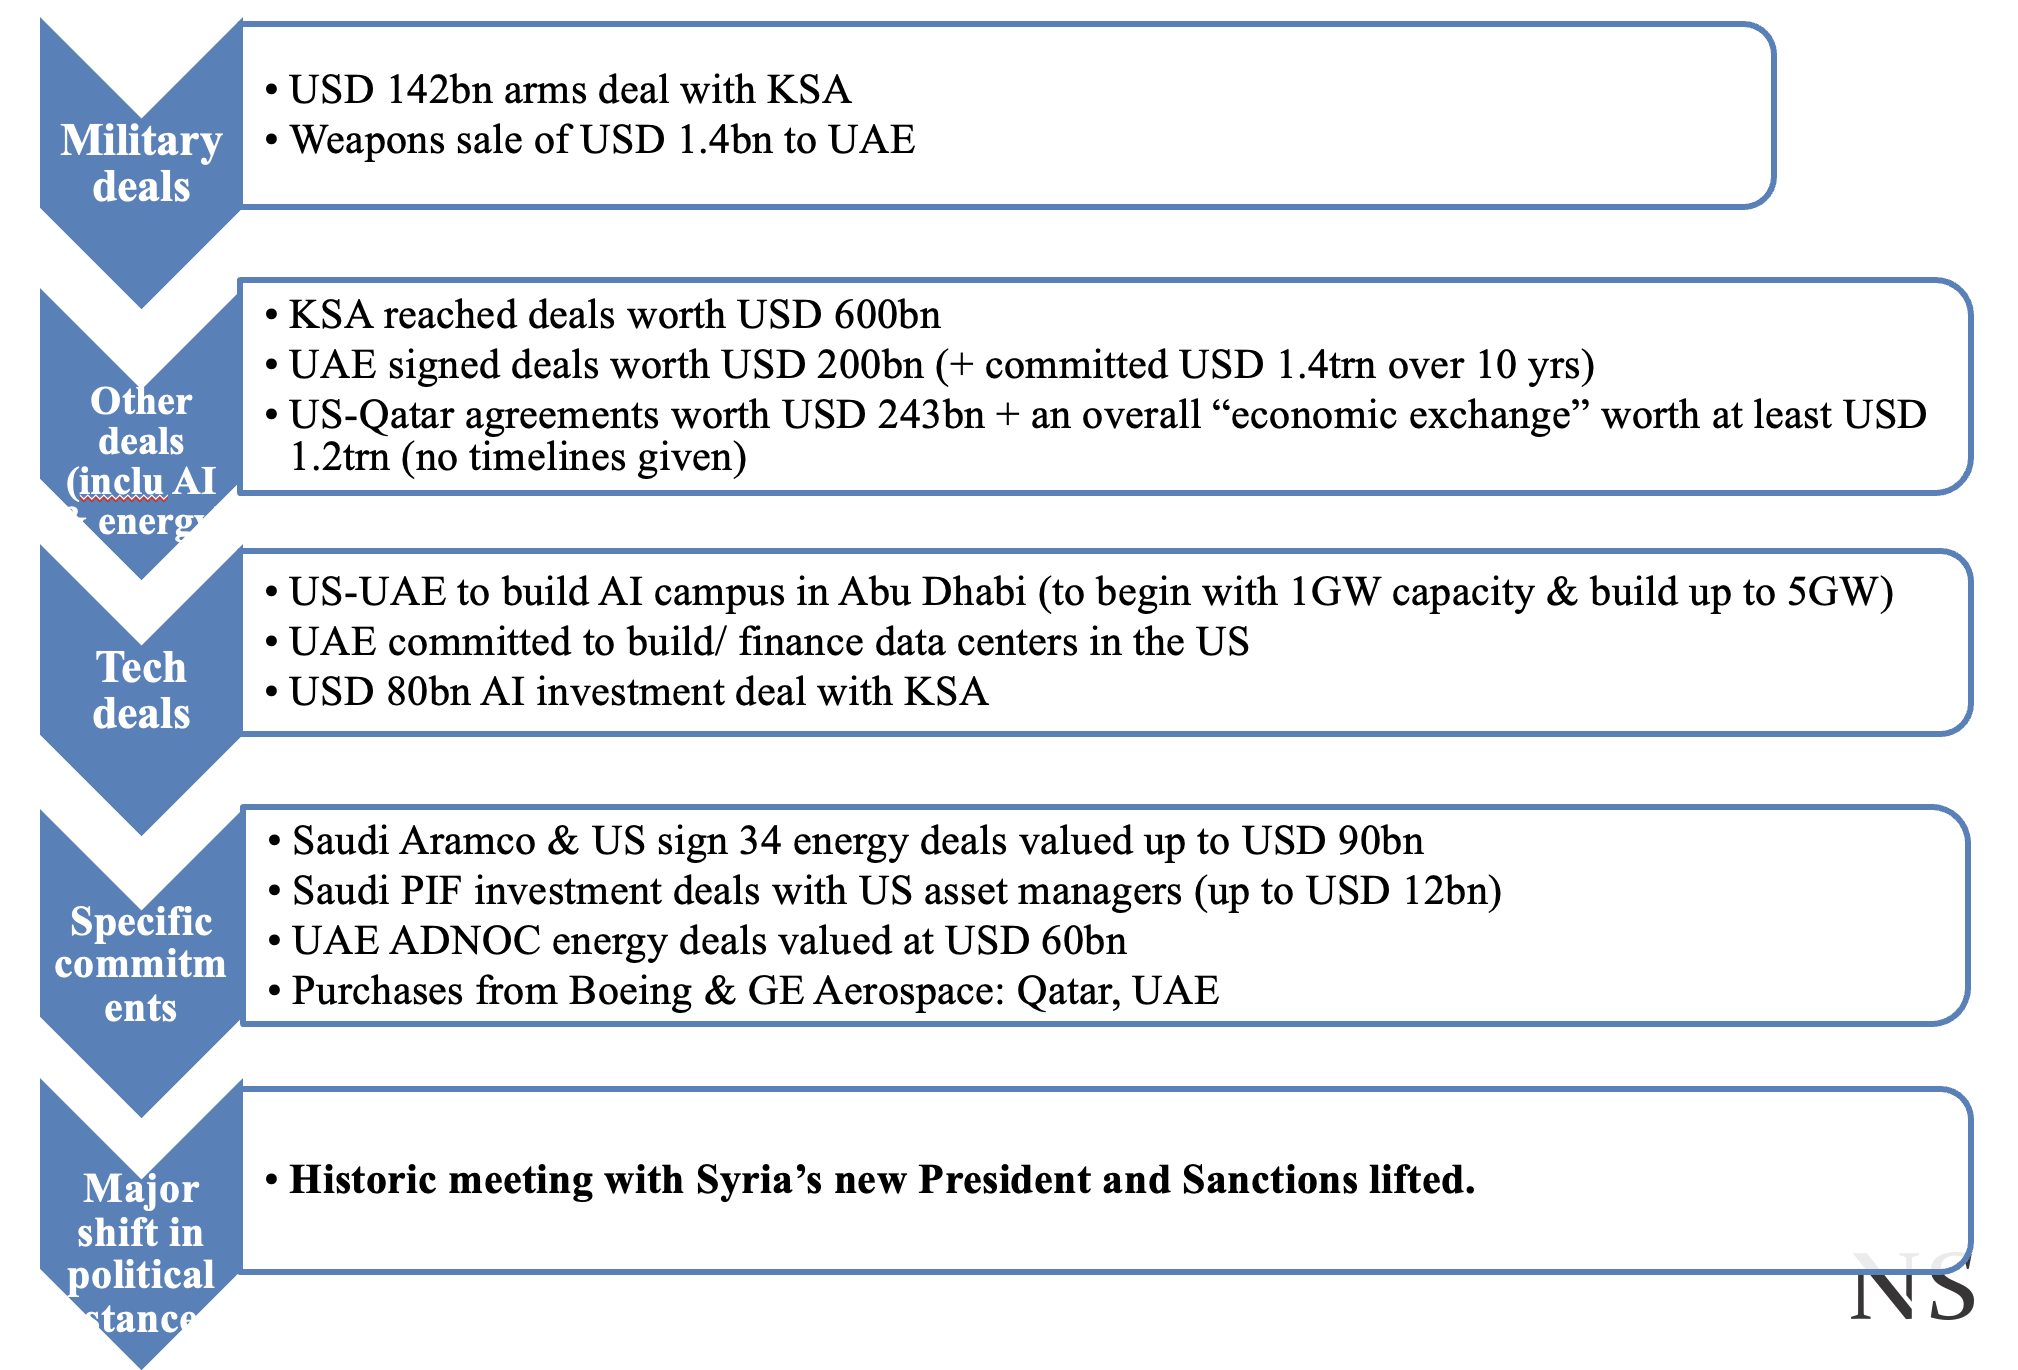
More than USD 1.4trn in investment pledged by Saudi, Qatar & UAE. For the US, these deals are a way of countering China’s influence in the region.
What about China-GCC links in this backdrop? GCC-China linkages are strong, built on sound strategic, economic, technological and financial interests, and here to stay, deepening further. As the US-China decoupling continues, the GCC region offers China a unique access – of being well-placed and well-connected with its linkages into the rest of the Middle East and Africa (that can become bigger markets for Chinese products).
2. Trump’s visit to the Middle East. What has been agreed? A shift in political stance + USD 1.4trn pledged + more direct deals with US companies!
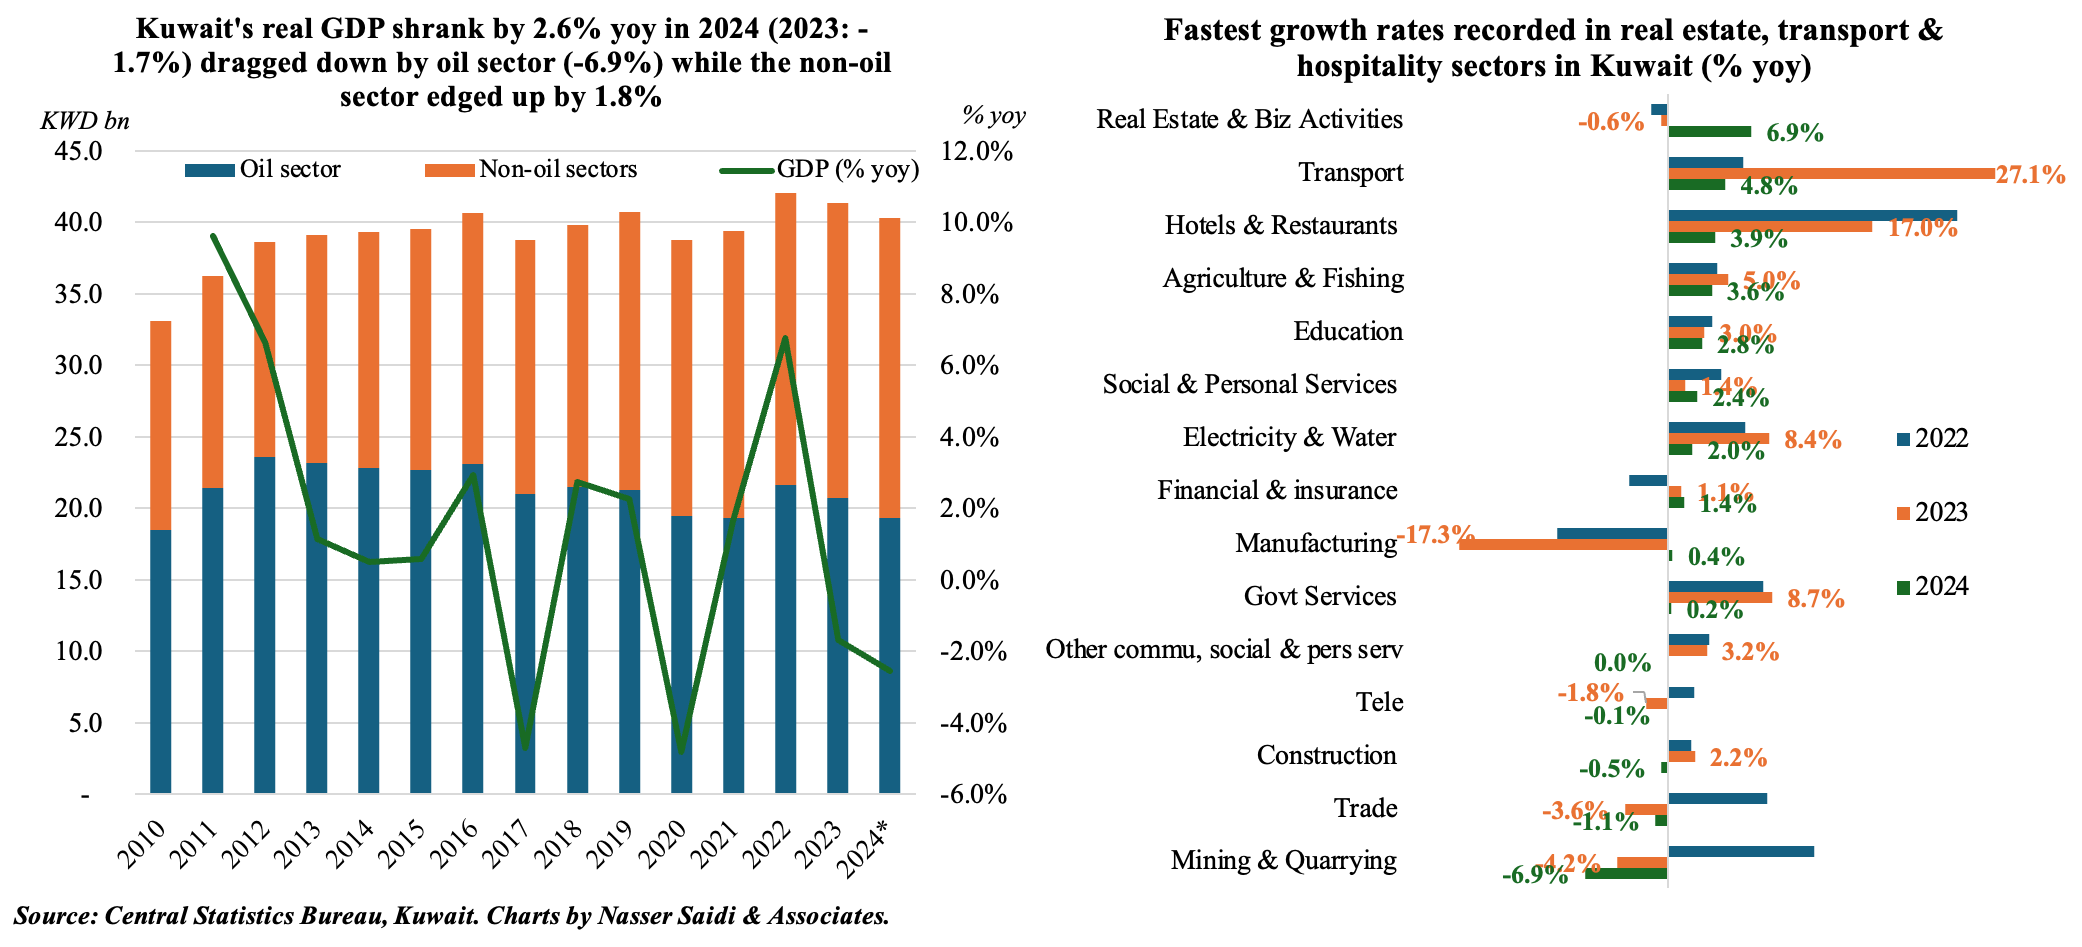
3. Kuwait’s GDP shrank by 2.6% yoy in 2024, dragged down by a plunge in oil sector activity and prices, with GDP falling by 0.7% in Q4
- Real GDP in Kuwait declined by 2.6% yoy in 2024, as oil sector activity plummeted (-6.9% from -4.2%) alongside a slight uptick in non-oil sector growth (1.8% from 1.0%). Oil output fell by 6.6% yoy to 2.42mn barrels per day in 2024, and average price slipped by 4.7% to USD 75.8, according to the finance ministry.
- Nominal GDP stood at KWD 49.1bn in 2024, with the hydrocarbon sector still accounting for 43.4% of GDP. In terms of percentage distribution, non-oil non-government sector accounted for 44.4% of GDP; financial & insurance sector dominated (9.2% of overall GDP) followed by real estate, renting & business activities (8.0%) and manufacturing (8.0%). Government sector share was 12.2%.
- Real GDP growth fell by 0.7% yoy in Q4 (Q3: -3.9%), with a rebound in non-oil activity as oil sector plunged by 5.7% (Q3: -5.3%). Non-oil sector grew by 4.0% yoy, following a 2.5% drop in Q3.
- Among the non-oil non-government sector, manufacturing recorded the highest growth in Q4 (12.2% yoy vs Q3’s 10.8% drop) followed by real estate sector growth (8.6% vs 0.3%) while growth was fastest in real estate & business activities in 2024 (6.9% yoy).
- Kuwait should prioritize expanding its non-oil sectors by investing in infrastructure and supporting high-potential sectors (manufacturing, financial services & tech) in a bid to become more diversified.
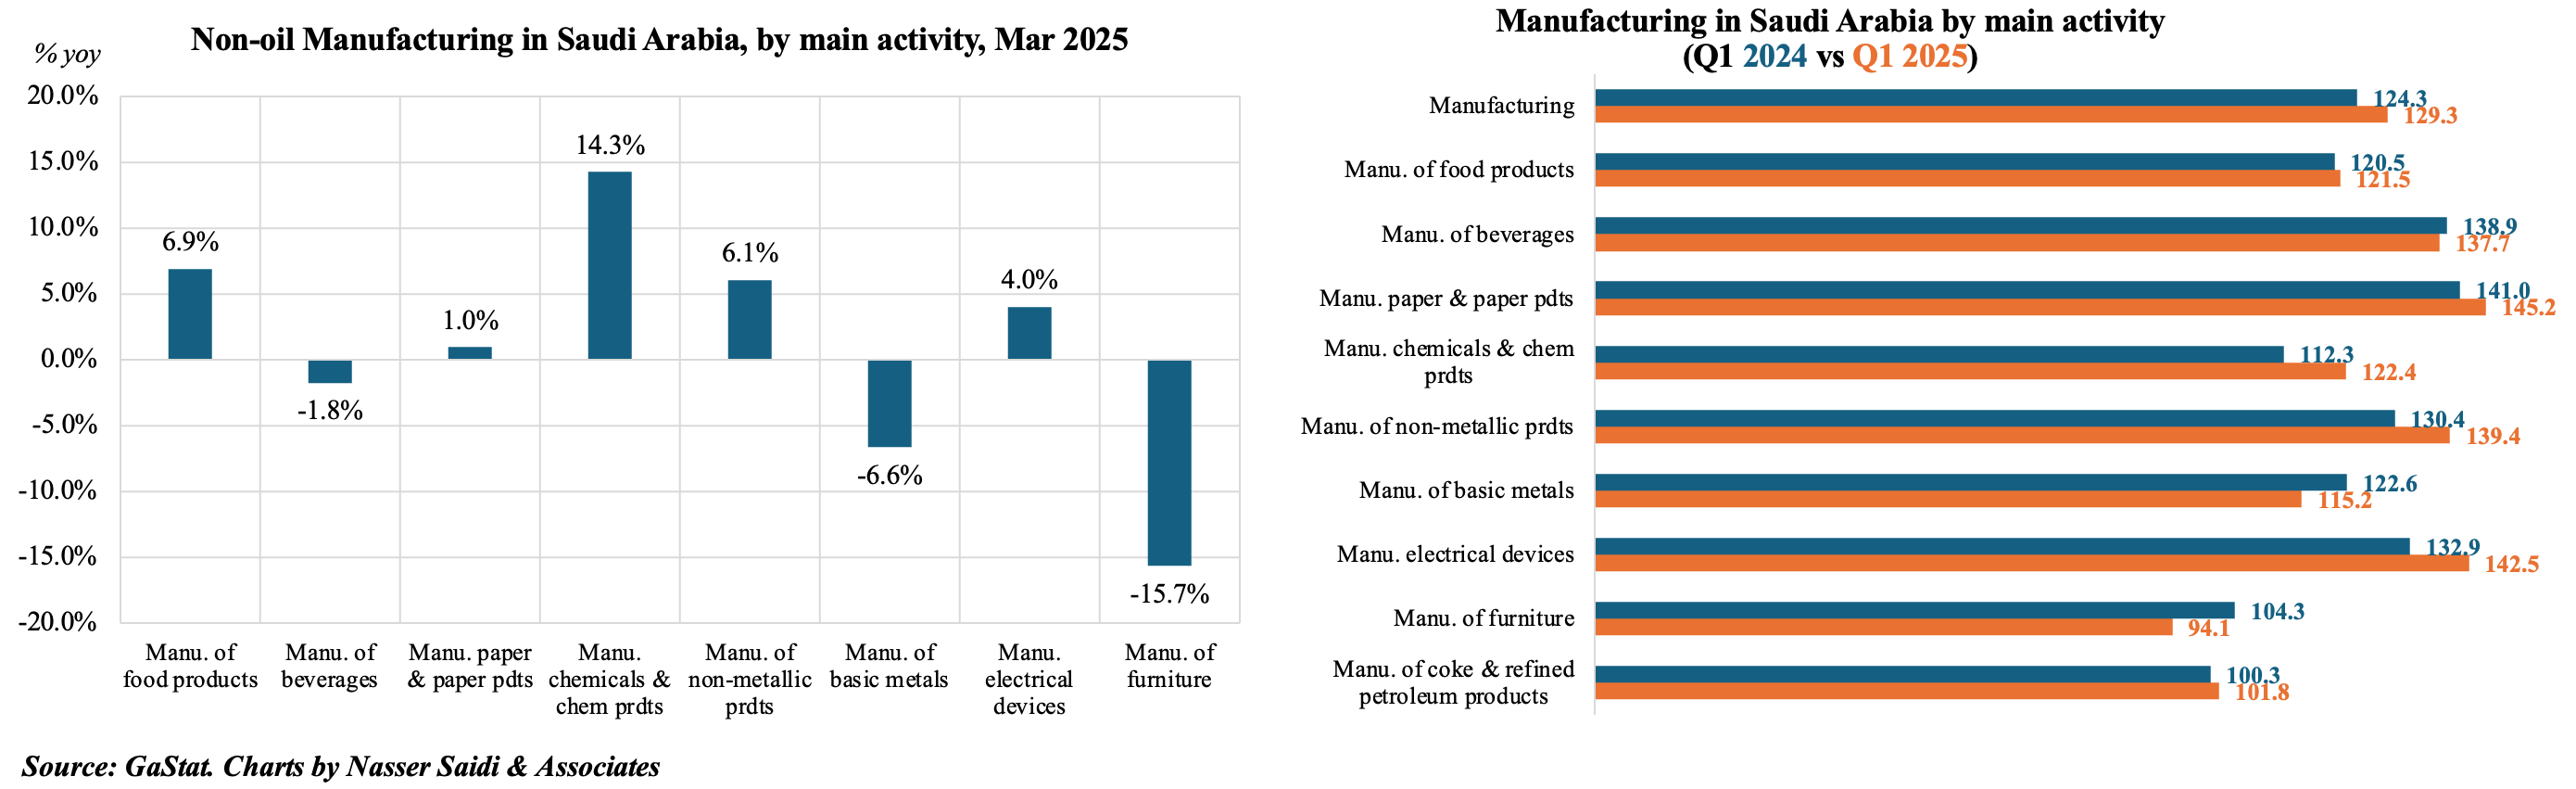
4. Industrial production in Saudi Arabia inched up in Mar, the ninth consecutive month of gains, driven by a surge in manufacturing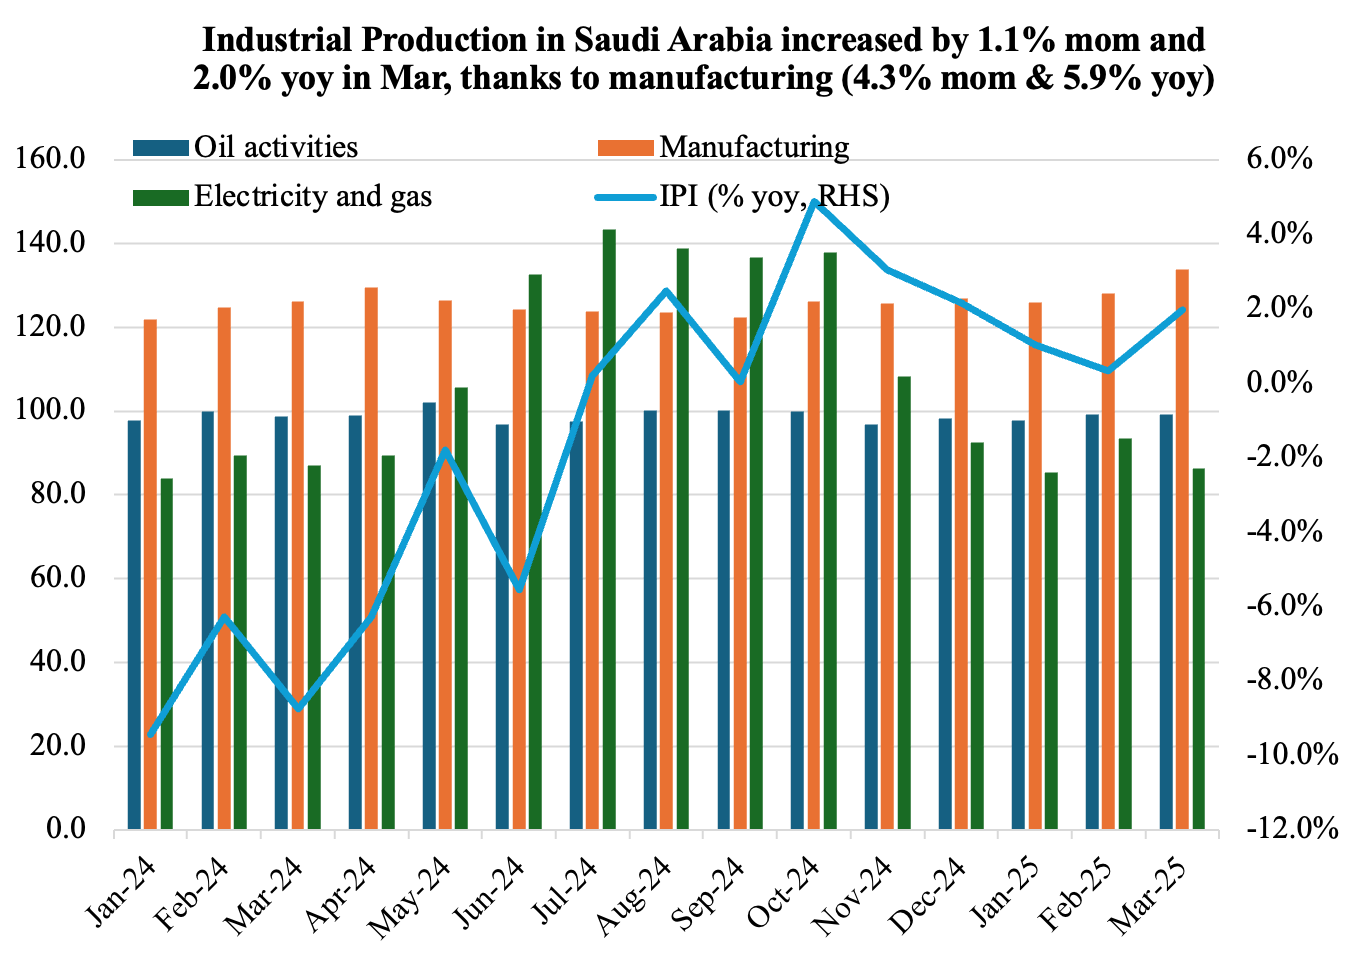
- Industrial production in Saudi Arabia increased by 1.1% mom and 2.0% yoy in Mar (Feb: 1.7% mom & 0.3% yoy). This was supported by a surge in manufacturing (4.3% mom and 5.9% yoy) whileoil activities ticked up moderately (0.1% mom and 0.5% yoy).
- In Q1 2025, overall IP gained by 1.1% yoy and manufacturing was up 4.0% – with the latter driven by gains in chemicals & chemical products (9.0% yoy) and electrical devices (7.2%).
- Non-oil activities grew by 3.3% mom and 5.9% yoy in Mar 2025. Within manufacturing, the manufacture of chemicals & chemical products was the fastest growing (14.3%) followed by food products (6.9%).
- Consistent increase in industrial licenses & relatively high PMI are proxy for future increase in industrial/ mining activity. even though Saudi PMI has moderated slightly (given global uncertainty), business activity is still relatively high (average 58.2 in Jan-Apr). The Saudi Ministry of Industry & Mineral Resources disclosed that 105 new industrial licenses were opened in Feb (attracting an investment of SAR 1bn+ and creating over 1504 jobs).
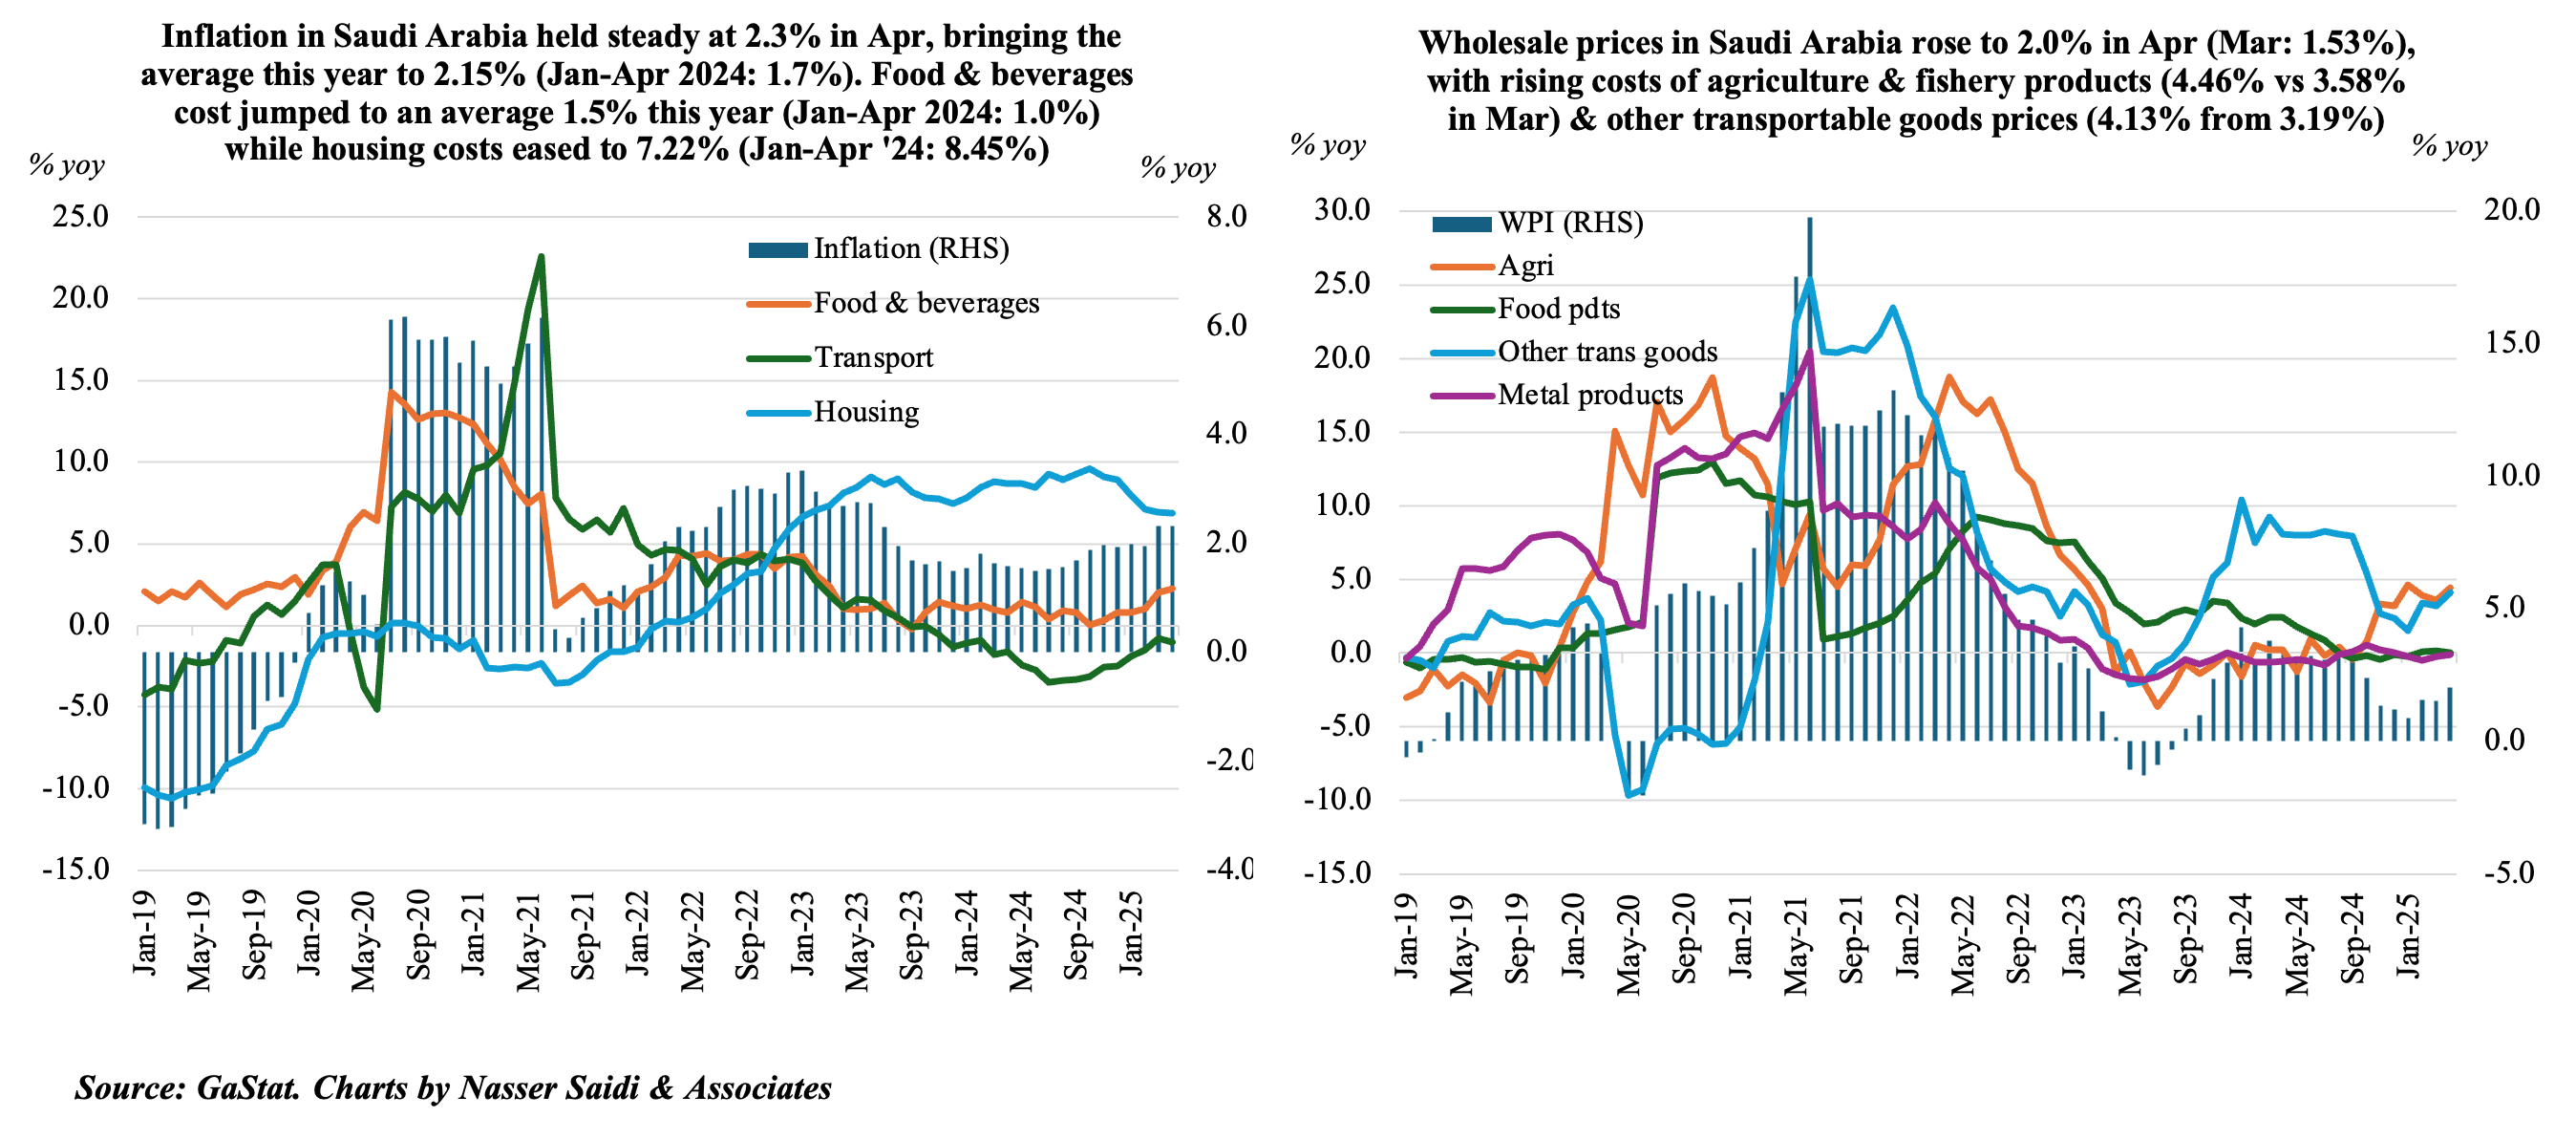
5. Consumer inflation remains muted in Saudi Arabia holding steady at 2.3% in Apr while producer price inflation inches up
- Consumer price inflation in Saudi Arabia held almost steady at 2.32% in Apr, from Mar’s 2.33%. Moderate increases were observed in food & beverages prices (2.2% vs Mar’s 2.0%), restaurant & hotels costs (2.0% vs 1.3%) and education (1.3% from 1.1%). Housing costs eased slightly in Mar (6.8% from 6.9%) as rental costs slowed (8.1% from 8.2%).
- Six major categories (of out 12) clocked in deflationary readings, of which prices dropped further in clothing & footwear (-1.2% from -0.8%) and transport (-1% from -0.8%) while recreation & culture costs fell (-0.7% from Mar’s 0.3% uptick).
- CPI averaged 2.15% in Jan-Apr 2025 vs 1.65% in Jan-Apr 2024, with a mixed picture: housing costs remained high, but eased to an average 7.2% from 8.5%; transport costs fell further (-1.39% vs -1.26%) while miscellaneous goods and services prices accelerated: up by 3.64% in Jan-Apr 2025 from a dip of -0.9% in the same period last year.
- Wholesale prices in Saudi Arabia moved up in Apr to 2.02% (Mar: 1.53%), due to jumps in agriculture & fishery (4.46% vs 3.58%) and other transportable goods (4.13% from 3.19%); meanwhile deflation continued in ores & minerals (-1.71% from -1.94%).
- Average wholesale prices more than halved in Jan-Apr 2025 vs the same period a year ago: clocking in 1.49% (vs 3.64%), as “other transportable goods” prices plunged (3.06% vs 8.8%).
Powered by:
![]()