

Download a PDF copy of the weekly economic commentary here.
Markets
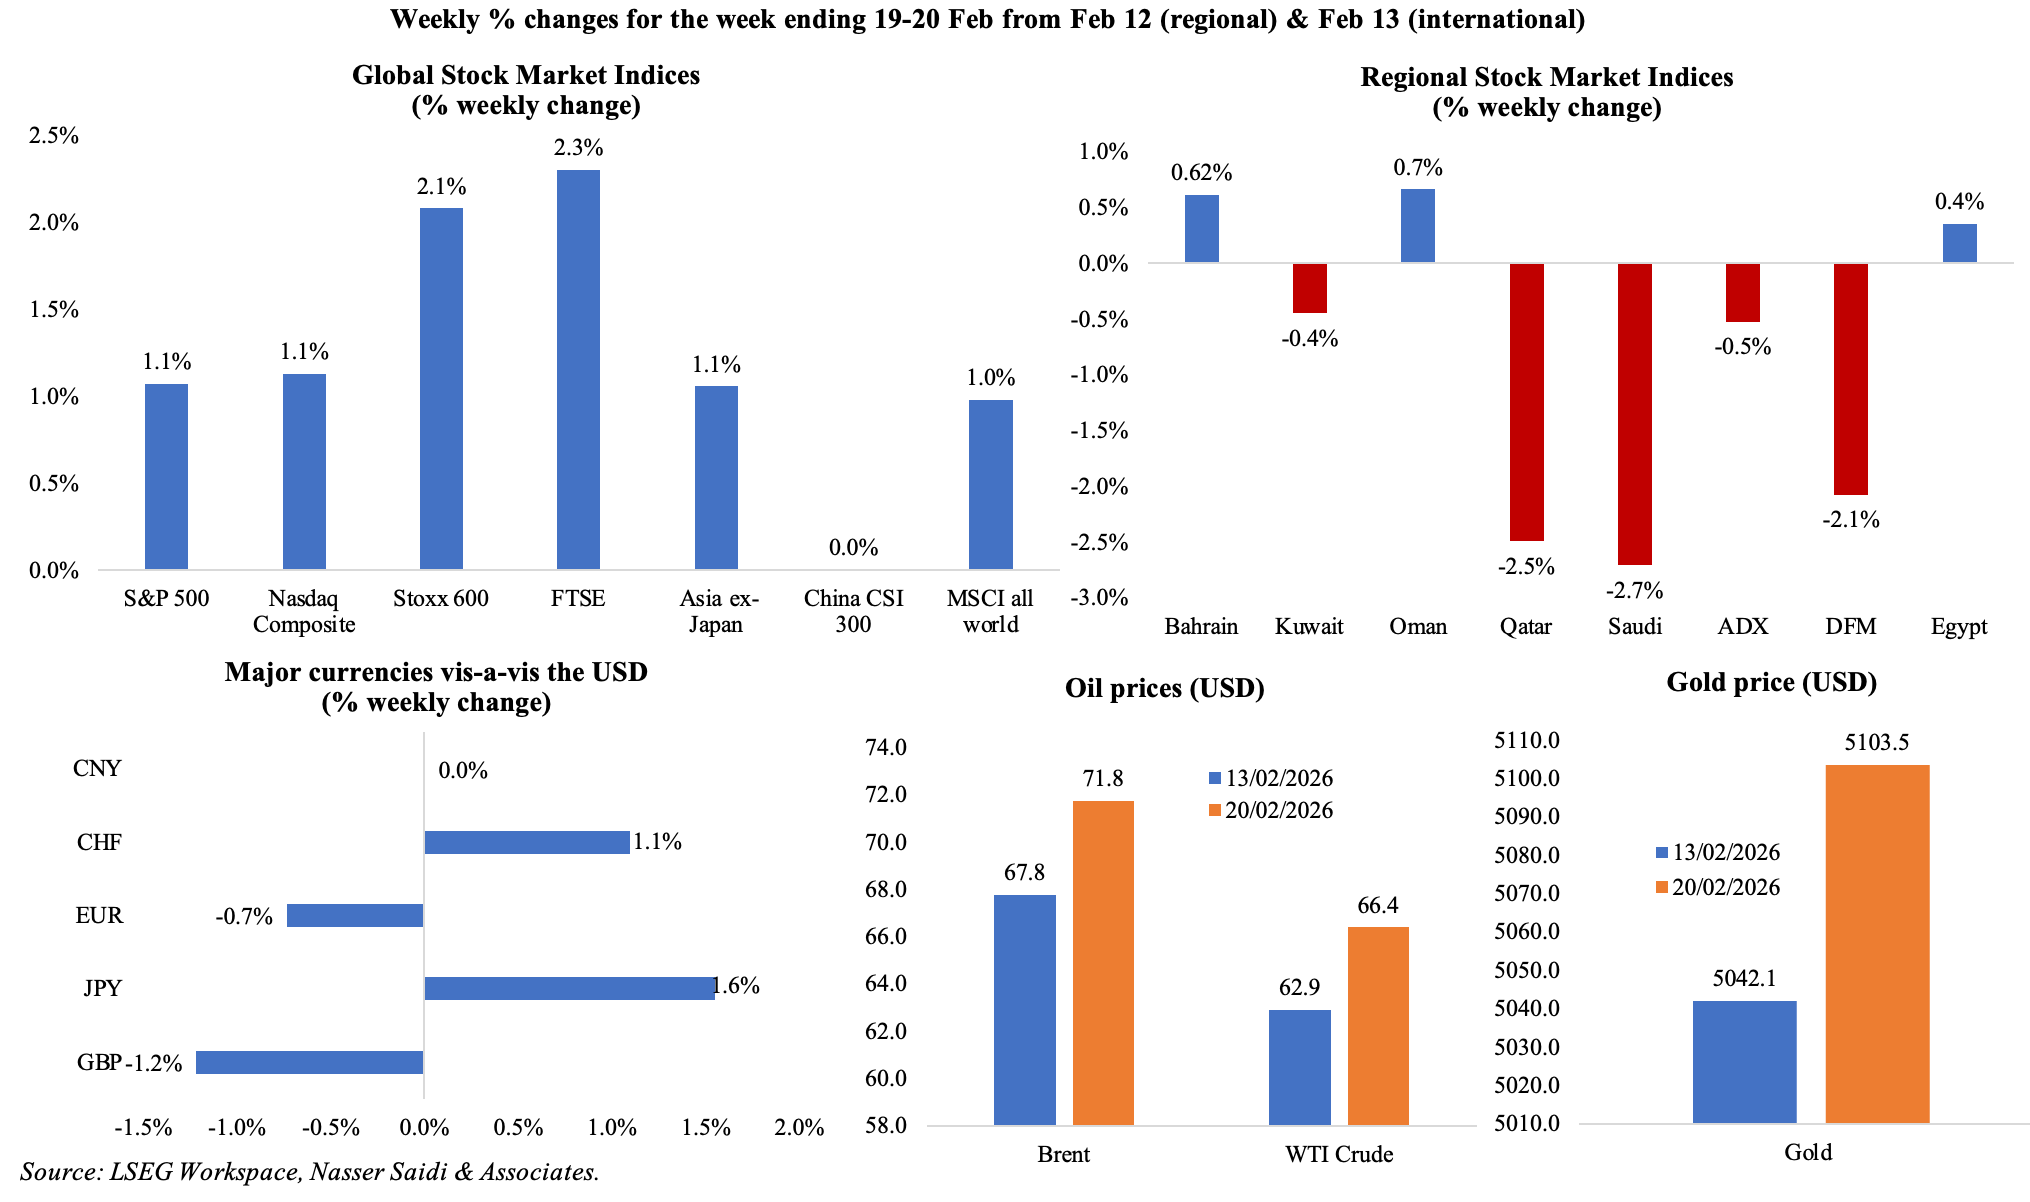
US markets moved higher following the Supreme Court ruling on Trump’s tariffs and Stoxx600 hit an all-time high; China’s markets were closed for the Lunar New Year holidays. Major regional stock markets fell sharply (by more than 2% last week in Qatar, Saudi and Dubai) as investors grew cautious amid renewed geopolitical tensions between US and Iran (and despite ongoing diplomatic talks). The USD posted its largest weekly rise since late-2025, though it slipped after the Supreme Court ruling on Friday, supported by better-than-expected economic data, a hawkish Fed and heightened geopolitical tensions (US-Iran). Global oil prices climbed more than 5% weekly (with the Brent crossing USD 70) on concerns of military escalation and potential for supply disruptions via the strategic Strait of Hormuz (given President Trump’s ultimatum for Tehran to reach a nuclear deal within days). Safe-haven assets like gold regained upward momentum as Middle East tensions heightened risk aversion.
Global Developments
US/Americas:
- The US Supreme Court ruled that President Trump’s emergency tariffs were illegal, though it did not mention what would happen to the tariffs collected so far (more than USD 175bn). Within hours of the ruling, the administration invokedSection 122 of the Trade Act of 1974, imposing a “temporary” 10% (later threatened to be 15%) global tariff for 150 days, following which an extension would require Congressional approval. (More in the bottomline section).
- GDP in the US grew at a 1.4% annualized rate in Q4, a sharp deceleration from Q3’s 4.4% gain, reflecting a drop from government spending and investment (-5.1%, with a 16.6% plunge at the federal level) due to the record 43-day government shutdown. Exports fell 0.9% in Q4 following Q3’s 9.6% surge while private domestic final purchases grew at a healthier 2.4% pace, driven by consumption and non-residential investment. For the full year 2025, US GDP grew at by 2.2%, slower than the 2.8% increase in 2024.
- The personal consumption expenditures (PCE) price index rose to 2.9% in Dec (Nov: 2.8%), its highest level since Mar 2024. Core PCE rose 0.4% mom and 3.0% yoy in Dec (Nov: 0.2% mom and 2.8% yoy), the highest since Apr 2024, suggesting sticky services inflation.
- Personal income grew by 0.3% mom in Dec and spending outpaced it (0.4% mom in Dec), taking the personal saving rate (personal saving as a percentage of disposable personal income) to 3.6%.
- FOMC minutes revealed a “hawkish pause” with majority of the members wary of the “risk of inflation remaining persistently higher than desired”. Policymakers also prefer a more “two-sided description” of the Fed’s policy outlook signalling that rate hikes remain possible if inflation stays above target. But the committee’s projection for economic activity was stronger (compared to the Dec meeting), suggesting further rate cuts in 2026 is higher than the market initially anticipated.
- Durable goods orders declined by 1.4% mom in Dec (Nov: 5.4%), largely due to a 5.3% fall in transportation equipment (with non-defense aircraft and parts orders plunging 25.9%) alongside a 3.9% drop in capital goods orders. Excluding non-defense capital goods orders, orders were up 0.6% (Nov: 0.8%).
- Industrial production in the US grew by 0.7% mom in Jan (Dec: 0.2%), the largest gain since Feb 2025. Durable and nondurable goods manufacturing output rose 0.8% and 0.4% respectively while mining output fell 0.2% (Dec: -0.9%). Capacity utilization rose to 76.2% (from 75.7% in Dec). In yoy terms, IP grew by 2.3% (Dec: 1.3%), the most since Apr 2022.
- Goods trade deficit widened to USD 99.3bn in Dec (Nov: USD 86.9bn), taking the full year deficit to a record high USD 1.24trn (+2.1% yoy). The goods trade deficit with China shrank to USD 202.1bn (2024: USD 295.5bn) while record deficits were reported with Mexico, Vietnam, Taiwan, Ireland, Thailand and India. Goods imports increased 4.3% to a record USD 3.44trn in 2025. Additionally, goods and services trade deficit widened to a five-month high of USD 70.3bn in Dec (Nov: USD 53bn).
- Building permits in the US rebounded in Dec, up 4.3% to 1.448mn (Nov: -1.6%) though single-family building permits fell (-1.7% mom and -10.9% yoy). Housing starts grew by 6.2% mom to 1.404mn in Dec (Nov: 3.9%), supported by single-family housing (4.1% to 981k). New home sales fell 1.7% mom to 745k in Dec, following a 15.5% surge the month before. Pending home sales unexpectedly declined 0.8% mom and 0.4% yoy in Jan. High mortgage rates (near 6.0%) and increased construction costs due to tariffs on imported goods (e.g. lumber) and labour shortage (given immigration policy) are affecting the housing market.
- NY Empire State manufacturing index dropped to 7.1 in Feb (Jan: 7.7) on new orders edging down to 5.8 (from 6.6) and shipments slipping to -1 (from 16.3) while both input and output prices ticked up.
- Philadelphia Fed manufacturing survey moved up to 16.3 in Feb (Jan: 12.6), the highest since Sep. Current activity was modest, but the diffusion index for future general activity surged to 42.8, after two months of declines, a signal that firms expect a significant growth upswing in the next 6 months.
- Flash manufacturing PMI in the US declined to a 7-month low of 51.2 in Feb (Jan: 52.4), with new orders down for the second time in 3 months and employment growth posting the smallest increase since Jul. The composite PMI Output Index, which tracks both manufacturing and services PMI, fell to 52.3, the lowest since Apr (Jan: 53.0).
- Michigan consumer sentiment index stood at 56.6 in Feb, lower than the preliminary reading of 57.3 but recording the highest reading since Aug 2025. The 1-year and five-year inflation expectations eased to 3.4% (the lowest since Jan 2025) and 3.4% respectively.
- Initial jobless claims declined by 23k to 206k in the week ended Feb 14, with the 4-week average slipped by 1k to 219k. Continuing jobless claims increased by 17k to 1.869mn in the week ended Feb 7.
Europe:
- The flash manufacturing PMI in the eurozone moved into expansionary territory in Feb, up to 50.8, a 44-month high, from 49.5 in Jan. Output increased at the fastest since Aug 2025 while new orders remained muted and input prices rose at the fastest pace since Dec 2022. This uptick was led by Germany’s jump to 50.7 (Jan: 49.1), expanding for the first time since Jun 2022, as new orders grew the fastest in almost four years; employment continued to fall.
- Consumer confidence in the eurozone improved in Feb, to -12.2 (Jan: -12.4), the highest since Nov 2024. While still negative, it suggests that as inflation stabilises, households are slowly becoming willing to spend, though remaining sensitive to geopolitical uncertainty.
- Industrial production in eurozone fell 1.4% mom in Dec (Nov: 0.3%), the first decline since Aug. The decline was exacerbated by the plunge in capital goods production (-1.9%) while output of energy and non-durable consumer goods declined by 0.3% each. In yearly terms, IP eased to 1.2% yoy (Nov: 2.2%). In 2025, the annual average industrial output grew 1.5% each in both the euro area and the EU.
- German ZEW economic sentiment index slipped to 58.3 in Feb (Jan: 59.6) while in contrast the current situation improved slightly (-65.9 from -72.7).
- Producer price index in Germany fell by 0.6% mom and 3.0% yoy in Jan – a leading indicator suggesting that goods inflation will remain subdued, providing a necessary buffer against stickier service costs.
- UK inflation declined to 3.0% yoy in Jan (Dec: 3.4%) alongside a dip in core consumer prices (to 3.1% from 3.2%). This was partly due to the drop in prices of food & non-alcoholic beverages (3.6% from Dec’s 4.5%) as well as costs of education (5.1% from 7.6%) and transport (2.7% from 4.0%); services inflation fell to 4.4% (from 4.5%). Factory gate inflation is cooling rapidly: output producer price declined in Jan, to 2.5% (Dec: 3.1%). Retail prices slowed to 3.8% (from 4.2%).
- Flash manufacturing PMI in the UK ticked up to 52.0 in Feb (Jan: 51.8), the highest reading since Aug 2024. This was supported by output (which increased the most in 17 months), resilient domestic demand and a recovery in export orders (most in 4.5 years). Business optimism rose to a 1.5-year high despite a sharp increase in input and output prices.
- Retail sales in the UK ticked up 1.8% mom (most since May 2024) and 4.5% yoy (a near 4-year high) in Jan. A robust rebound in retail sales is supported by real wage growth, aided by falling inflation, amid interest rate cuts.
- Unemployment in the UK inched up to 5.2% yoy in the three months to Dec. UK’s youth unemployment rate rose to a 10-year high of 16.1% (mid-2025: 13.8%). Average earnings in the UK eased in the three months to Dec: it grew by 4.2% including and excluding bonus, compared to 4.6% and 4.4% including and excluding bonus respectively.
Asia Pacific:
- Japan’s GDP grew at a 0.2% annualised rate in Q4 (Q3: -2.6%), successfully exiting a technical recession; GDP was up by 0.1% qoq and 3.4% yoy (Q3: -0.7% qoq and 3.5% yoy). For the full-year, growth was 1.1%, the fastest expansion since 2022. Private consumption grew only 0.1% qoq as households struggle with negative real wage growth while the recovery was supported by business investment (+1.0%), capital investment (0.2%) and a marginal contribution from net trade.
- Despite a slight monthly contraction in Japan industrial production in Dec (-0.1% mom), the annual expansion of 2.6% marked the strongest increase in three months. The divergence between sectors is stark: general-purpose machinery surged 7.3% mom (Nov: -0.3%) while production machinery fell 1.5% (Nov: 5.1%).
- Exports from Japan surged 16.8% yoy in Jan (Dec: 5.1%), the most in more than 3 years thanks to a pre-Lunar New Year boost, while imports fell by 2.5% (Dec: 5.2%) leading trade balance into a deficit of JPY 1.15trn. The export spike was driven by Asia (26%, with exports to China up 32%) and Western Europe (25%+), but notably, shipments to the US fell 5.0% (Dec: 11.1%) due to the impact of higher tariffs.
- Inflation in Japan eased to 1.5% in Jan (Dec: 2.1%), the lowest since Mar 2022 and below the BoJ target, as food inflation fell to a 15-month low (3.9% from 5.1%). Excluding food and energy, prices were up 2.6%, slower than the 2.9% uptick in Dec. Excluding fresh food, prices rose 2.0%, the lowest since Jan 2024 (Dec: 2.4%).
- Flash manufacturing PMI in Japan increased to 52.8 in Feb (Jan: 51.5), the most since May 2022, supported by domestic and external demand. New orders expanded at the fastest rate since May 2023 and factories saw the quickest upturn in new export work for eight years.
- India’s preliminary manufacturing PMI jumped to a 4-month high of 57.5 in Feb (Jan: 55.4), fuelled by robust domestic orders and the quickest pace of hiring in three months. Services firms international sales rose at their fastest rate since Aug 2025 but in contrast, manufacturers observed the slowest increase in external sales for 16 months.
- Wholesale price inflation in India ticked up by 1.81% yoy in Jan (Dec: 0.83%), a 10-month high, with increases across food (1.41% from Dec’s flat reading) manufactured products (2.86% vs Dec’s 1.82%) and primary articles (2.21%), even as fuel prices remained in deflation (-4.01% from -2.31%).
- India’s trade deficit widened to USD 34.68bn in Jan (Dec: USD 25.04bn). Strong domestic demand and infrastructure projects are raising imports, which currently outpace export gains. In monthly terms, gold and silver imports surged 12% mom to USD 71.24bn, while exports fell 5% to USD 36.56bn. Merchandise exports to the US fell 4.5% mom to USD 6.58bn amid tariff negotiations.
- Infrastructure output in India grew by 4% yoy in Jan (Dec: 3.7%), with the construction-related engines performing well: production of cement and steel surged 10.7% and 9.9% respectively, reflecting the government’s capex push and a steady housing market. Infrastructure output rose 2.8% in Apr-Jan against a revised growth of 4.5% a year ago.
Bottom line: The US Supreme Court issued a landmark 6-3 decision striking down Trump’s tariffs, which begs the question of the tariffs collected so far. Despite the jump in effective tariff rates last year to the highest since 1934, the US posted a record-high trade deficit for the full year 2025 thanks to imports at an all-time high (USD 3.4trn). Meanwhile, the Court of International Trade is bracing for a deluge of reliquidation claims from importers. President Trump has since threatened to impose a 15% global tariff. What could be the next steps? (a) the most likely solution seems to be sector-specific tariffs on products such as semiconductors or actions on specific countries for unfair trade practices (e.g. China); (b) negotiations with Congress to continue imposing tariffs in exchange for concessions (though less probable given midterms later this year and general consensus of the negative impact of tariffs – especially on prices and affordability); (c) countries with much higher tariff rates might try to negotiate “bilateral agreements” to side step such duties by offering investments and/ or increased market access.
The next big question is related to the US-Iran standoff: US has shown its hand with significant naval power in the Middle East region including two aircraft carriers. This, paired with the ultimatum from President Trump for a nuclear deal, underscores the immense pressure on Iran – which is already reeling from severe domestic unrest, high levels of inflation (60%+) and a collapsing rial. Diplomatic negotiations leading to Iran accepting enrichment limits and IAEA access seems to be the “best” route possible. However, with the obvious US military presence in the region (and its associated costs), another strong possibility is that of a limited strike (perhaps on nuclear enrichment sites). Such a scenario could however lead to counterattacks (e.g. Houthi strikes on the Red Sea that could raise risk premiums). The market is not pricing in a full-scale war yet, but in the event of such a scenario, the countries of the region are likely to engage security protocols.
Geopolitical worries seem to be happening back-to-back, what with the anniversary of Russia-Ukraine war (and unending negotiations), Gaza (Board of Peace, reconstruction pledges and stabilisation forces), talks about occupying Greenland and the capture of Venezuela’s Maduro among others (e.g. Taiwan). Markets may remain volatile in the near term as investors balance tech earnings outcomes (and AI spending concerns) against geopolitical risk and rate expectations. Trade and fiscal uncertainty as well as overall economic policy uncertainty are likely to rapidly rise in the months ahead.
Regional Developments
- Bahrain’s parliament unanimously approved a proposal to establish a financial support fund for low-income citizens, financed by a portion of oil revenues. It proposes that one dollar be deducted from oil export revenues when prices exceed USD 40 – signalling social safety-net expansion alongside fiscal diversification, reflecting increased focus on inclusive growth.
- Egypt GDP expanded 5.3% yoy in Q2 of FY 2025-26: the fastest quarterly growth since 2021-22, driven by reforms that sustained output and labour market resilience. The stronger growth is expected to translate into a full-year growth of 5.2%, exceeding the government’s initial 4.5% target. The acceleration reflects strong performances in tourism and Suez Canal revenues alongside effective structural reforms.
- Egypt’s cabinet reviewed a comprehensive tax reform package for FY 2026-27 with measures including real estate tax simplification, digital filing systems, customs tariff adjustments and VAT reforms to reduce barriers to business activity. Simplifying tax procedures, broadening the base and encouraging compliance will bolster investor confidence.
- Unemployment rate in Egypt dropped to 6.2% in Q4 2025 (Q3: 6.4%), supported by stronger economic activity and labour market reforms, though gender disparities persisted. Of the 35mn workforce, 8mn were women. Female unemployment stood at 14.3% (down from 15% in Q3 and 16.6% a year ago) but stayed much higher than male unemployment rate (3.8% from 4.0% in Q3).
- Egypt rolled out its first domestic individual bonds, aimed at broadening investor participation and strengthening local capital markets. The 18-month savings and investment instrument, available exclusively via Egypt Post branches, offers a fixed annual return of 17.75% with monthly payouts. This could deepen financial market liquidity and create new secure savings and investment vehicles for households.
- The Central Bank of Egypt posted a rise in net foreign assets to USD 15.0bn by end-Jan, reflecting improved balance-of-payments dynamics and banking sector developments.
- Egypt announced a USD 861mn social protection package ahead of Ramadan, underscoring efforts to support vulnerable groups amid ongoing economic adjustment.
- Financial inclusion in Egypt climbed to 77.6% by end-2025: 54.7mn citizens aged 15+ now own active financial accounts – a growth rate of 219% between 2016 and 2025, reflecting successful outreach and banking sector reforms. Women’s financial inclusion rate ticked up to 71.4% by 2025 (2016: 19.1%) while among youth aged 15 to 35, the rate rose to 56.8% in 2025 (2020: 36.3%). Higher inclusion enhances economic participation and reduces reliance on informal credit.
- Egypt plans a USD 4bn investment to develop six refineries, according to petroleum and mineral resources minister, signalling a move to expand energy processing capacity and boost industrial output. These investments could boost domestic production, enhance energy security and strengthen downstream sectors.
- Iraq plans black oil exports of over 1 million barrels per day (bpd), a low-grade, heavy residual by-product of oil refining, signalling an effort to monetise heavier crude streams. The move reflects both fiscal pressures and a strategy to capitalise on global demand for discounted heavy grades, particularly in Asian markets.
- Kuwait has been placed on the Financial Action Task Force (FATF) grey list, citing deficiencies in anti-money laundering and counter-terrorism financing frameworks. Grey-listing raises compliance costs for banks, potentially dampening cross-border capital flows and increasing scrutiny of financial institutions. As part of an action plan, Kuwait committed to tighter oversight of high-risk sectors, including real estate agents and dealers in gold and other precious metals.
- Inflation in Kuwait was up 0.15% mom and 2.07% yoy in Dec.
- Kuwait’s trade surplus with Japan narrowed by 36.9% yoy to JPY 48.5bn in Jan, largely reflecting weaker energy export values (-35.4% to JPY 65.3bn). Middle East’s trade surplus with Japan slipped 22.6% to JPY 645.0bn, as exports shrank 14.5%. The contraction underscores the sensitivity of Kuwait’s external balance to oil price movements.
- Kuwait dissolved a state oil services unit (Oil Sector Services Company) as part of a broader restructuring aimed at cutting costs, improving efficiency and streamline operations in its hydrocarbons sector. The overhaul signals intent to modernise governance within state-owned energy entities and enhance capital allocation discipline. Kuwait has eight main state-owned oil companies and controls nearly 101bn barrels of recoverable crude deposits.
- Oman’s telecom sector reported 25% revenue growth in 2025, with mobile subscriptions up 7% to 6.42mn, IoT subscriptions surging 358% to 1.632mn and fixed broadband subscriptions up 14% – all highlighting accelerating digital adoption. The Telecom Regulatory Authority disclosed that fifty government schools have been connected to the Starlink satellite internet service.
- Oman’s special economic zones (SEZs) and industrial cities attracted OMR 1.4bn (USD 3.6bn) in new investments last year, bring the total committed investments in SEZ facilities up 6.8% yoy to OMR 22.4bn, reinforcing their role in non-oil diversification. About 325 deals were reached in 2025 and the associated capital inflows spanned manufacturing, logistics and energy-intensive industries among others.
- Airports in Oman processed nearly 15mn passengers last year, up 2.8% yoy, indicating a continued recovery in travel demand and tourism flows. International passengers grew 1.2% to 11.8mn while domestic passengers surged 12% (to 1.32mn) – this growth reflects Oman’s strategy to strengthen connectivity as a regional transit and tourism hub.
- Government contracts issued in Oman more than doubled to USD 4.4bn in 2025; of these, 58% were awarded to SMEs in Oman (mostly in minerals, oil and gas projects), supporting local enterprise development. Greater SME participation enhances domestic value creation and employment generation.
- Lower mortgage rates have increased demand in Oman’s property market, boosting transaction values (16% yoy to OMR 1.27bn) and volumes (1% yoy to 230k properties). The number of homes bought using a bank mortgage rose 10% to just under 23,000 in 2025. Lower borrowing costs are reviving household demand and improving affordability metrics.
- A newUSD 200mn Franklin Templeton Qatar Equity Fund was launched to enhance liquidity on the Qatar Stock Exchange, with the Qatar Investment Authority acting as the anchor investor. This initiative seeks to address liquidity challenges and by improving tradability, the fund could narrow bid-ask spreads and attract fresh portfolio flows into Qatar.
- Inflation in Qatar ticked up to 2.28% yoy in Jan 2026 (Dec: 1.95%), with the largest increase seen in miscellaneous goods & services (+12.4%) while food inflation ticked up (to 2.87% vs Dec’s 0.63%) as did recreation & culture (4.9% from 1.44%) among others.
- Qatar issued 28k commercial registrations in 2025, up 57% yoy, underscoring robust entrepreneurial activity and business formation. Business licenses surged 53% yoy to 34,500 in 2025, supported by digital service platforms (e.g. Single-Window business service portal) and reform-oriented initiatives that simplified company setup processes. Non-Qatari businesses surged 600% to 12,449 last year.
- S&P Global forecasts sustainable bond issuance in the Middle East to reach USD 20–25bn in 2026; in 2025, issuance ticked up by 3% in the region, in contrast to a global decline of 21%. The growth is driven mainly by GCC economies, particularly UAE and Saudi Arabia, where green, social, and transition financing frameworks are gaining traction.
- US President Trump announced that international allies have pledged more than USD 7bn in humanitarian aid for Gaza relief efforts (including UAE, Bahrain, Qatar, Saudi and Kuwait); he also stated that US will contribute USD 10bn to the Board of Peace without specifying where the funds would come from. This level of support reflects broad geopolitical alignment around humanitarian objectives, even as political settlement negotiations continue.
- Commercial bank assets across the GCC rose 11.9% yoy to more than USD 3.9trn at end-2025, according to the GCC Secretary-General. Total deposits grew by 10.6% yoy to USD 2.3trn while net foreign assets jumped 10.5% to USD 842bn.
Saudi Arabia Focus
- Foreign investors significantly increased their net purchases on the Tadawul to SAR 1.7bn in the second week after Tadawul was opened to all categories of foreign investors. Net foreign buying of Saudi stocks rose to SAR 3.1bn in the first two weeks since it was opened and almost SAR 8bn since the announcement was made on Jan 6th. Flows are supported by improved market liquidity, favourable valuations and strong corporate earnings expectations.
- Humain, an AI company owned by the PIF, invested USD 3bn and acquired a minority stake in xAI, before the latter was acquired by SpaceX, underscoring Saudi’s commitment to AI and deep technology sectors. Humain and xAI had in Nov 2025 committed to developing over 500 megawatts of next-generation AI data centres and computing infrastructure.
- Saudi’s Public Investment Fund (PIF) trimmed its exposure to US equities, reallocating capital toward strategic domestic and regional assets. PIF reduced the value of its US-listed equity holdings to USD 12.9bn at end-Q4 (the lowest since early 2021) and from USD 19.4bn at end-Q3.
- Saudi Arabia unveiled a pipeline of large industrial projects valued at SAR 3bn (USD 810mn) to bolster non-oil manufacturing output. Investments span energy, petrochemicals, and downstream industries, reflecting a strategic pivot toward value-added production.
- Data from the Saudi Contractors Authority showed that the value of construction contracts in Saudi Arabia fell by almost 60% yoy to less than USD 30bn in 2025 (in 2023, the value was USD 113bn). Contracts issued by PIF fell even further: in 2025, it accounted for just 14% of total contacts issued versus 38%+ of all construction contracts by value in 2024. Interestingly, in 2026, the Saudi Data & AI Authority has been the largest issuer of contracts – especially given the building of the Hexagon data centre in Riyadh.
UAE Focus
- UAE economy expanded 5.1% yoy to AED 1.4trn in Jan-Sep 2025, supported by a robust 6.1% expansion in non-oil sectors such as financial services (9%), construction (8.7%), real estate (7.9%), and manufacturing (6.9%), pushing non-oil GDP above AED 1 trillion. This performance underscores the growing resilience and diversification of the UAE’s economic structure under the “We the UAE 2031” Vision.
- UAE and Zambia held high-level discussions to bolster commercial ties, spanning trade facilitation, supply-chain cooperation and private sector participation. Discussions highlighted renewable energy, infrastructure, agriculture, logistics, and digital cooperation as priority areas, building on recent strong bilateral non-oil trade (grew 64.5% to USD 3.4bn in 2025).
- An Iraqi-UAE consortium announced plans for a USD 700mn subsea and terrestrial data cable linking the UAE to Turkey via Iraq, branded WorldLink, to support high-capacity connectivity driven by AI and digital demand. The privately funded project, expected to be built over 4–5 years, is designed to reduce reliance on traditional internet routes (e.g. via the Suez Canal) and help position regional hubs as digital infrastructure nodes.
- Nasdaq Dubai had a record year in 2025, with outstanding Sukuk listings surpassing USD 100bn (2013: USD 13bn) and new debt issuances totalling USD 30.6bn across 60 deals. Value of outstanding debt across DFM and Nasdaq Dubai touched USD 150.9bn in 2025.
Media Review:
Weaponisation of the dollar marks the end of an era: Dr. Nasser Saidi’s op-ed for AGBI
https://www.agbi.com/opinion/finance/2026/02/nasser-saidi-the-dollars-weaponisation-marks-the-end-of-an-era/
Interview with Dr. Nasser Saidi on Al Arabiya Business – the weaponisation of the dollar
https://nassersaidi.com/2026/02/21/interview-with-al-arabiya-on-the-weaponisation-of-the-dollar-19-feb-2026/ or Direct link to Al Arabiya Business
Stock-Bond Diversification Offers Less Protection from Market Selloffs: IMF
https://www.imf.org/en/blogs/articles/2026/02/18/stock-bond-diversification-offers-less-protection-from-market-selloffs
India is in the midst of a data-centre investment boom
https://www.economist.com/business/2026/02/19/india-is-in-the-midst-of-a-data-centre-investment-boom
Behind Trump’s truce with China: FT
https://www.ft.com/content/12a6a1d0-383f-4b24-8d16-7af763ba56f2
Powered by:
![]()