UAE monetary stats. Oman trade, fiscal stance. GCC holdings of US Treasuries.
Download a PDF copy of this week’s insight piece here.
UAE Banking Assets Soar, Oman Diversifies & GCC Investors Boost US Treasury Holdings: Weekly Insights 20 Feb 2026
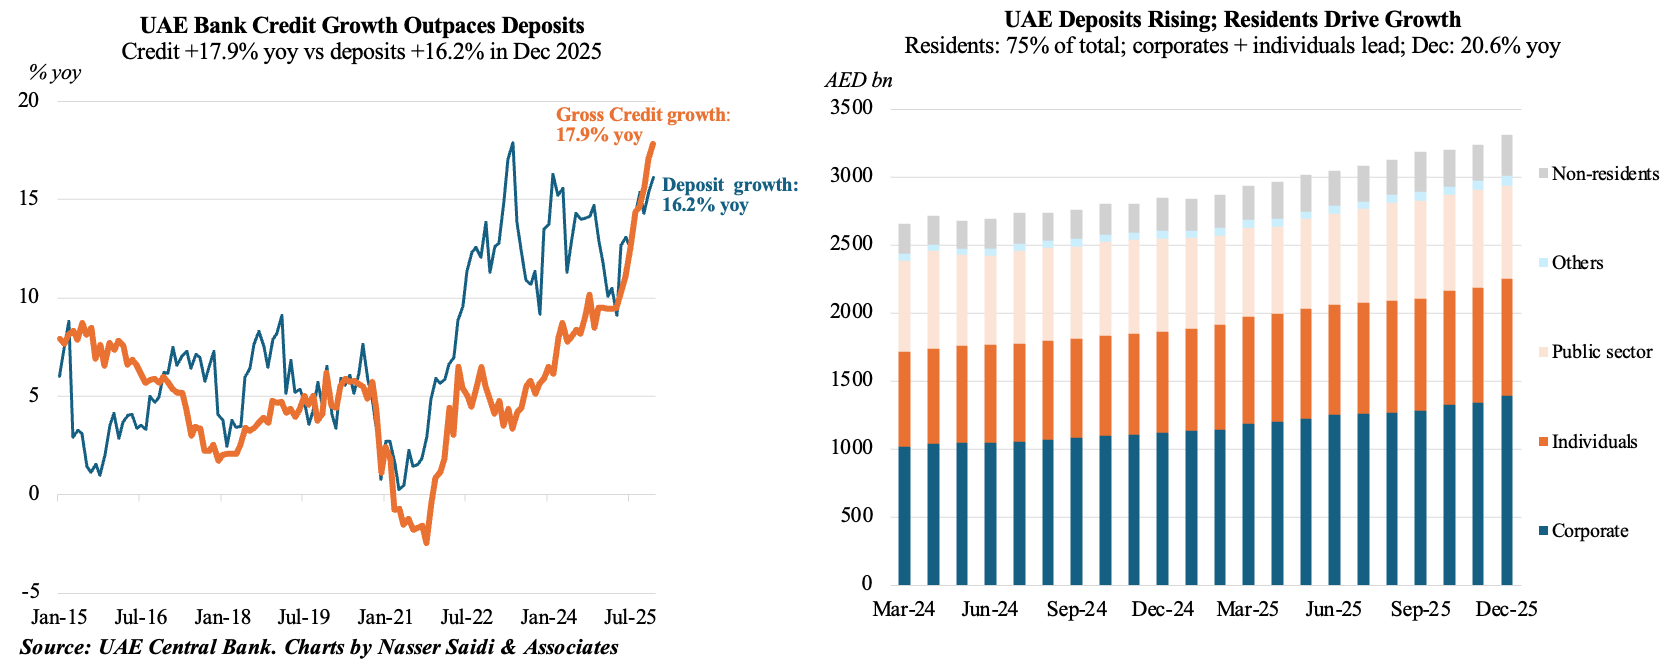
1. UAE gross assets gain 17.1% yoy in 2025; deposits growth accelerates (16.2%)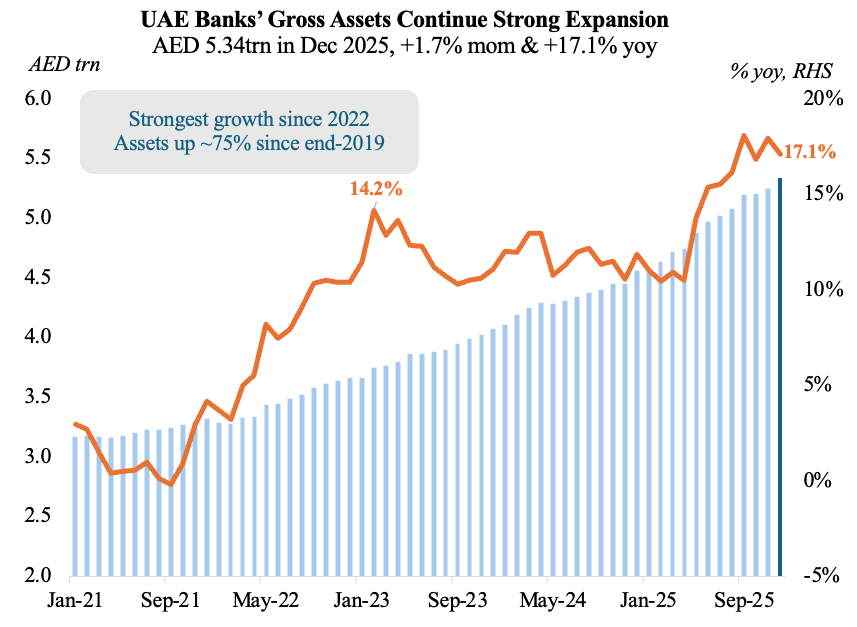
- UAE gross banking assets grew 17.1% yoy to AED 5.34trn at end-2025, thanks to increase in credit demand from the non-oil sectors & UAE’s expanding role as a hub for regional and global trade flows.
- Total deposits grew by 16.2% to AED 3.3trn at end-2025, partially from non-resident inflows (+21.2% in Dec) – underscoring the UAE’s global safe haven status amid geopolitical worries.
- Private sector deposits account for three-fourths of total resident deposits & more than two-thirds of total deposits in Dec. Government and GREs together accounted for 20% of total deposits.
- Together with deposits, growth in money supply measures (M1, M2, M3) indicate ample liquidity. UAE has one of the lowest loan-to-deposit ratios in the GCC and asset quality remains high; Non-Performing Loan (NPL) ratio stood at 3.2% (as of Sep ‘25 vs 6.8% in Q3 ‘22).
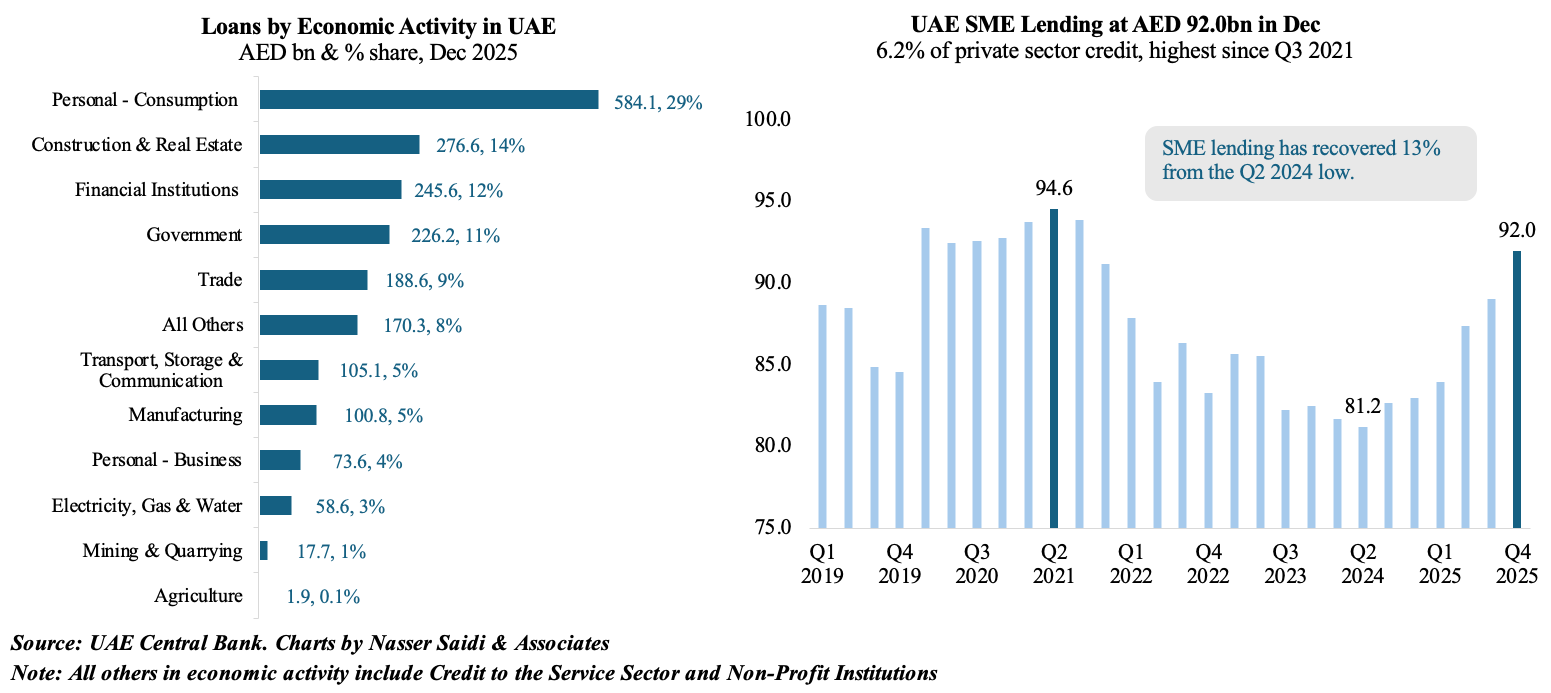
2. UAE domestic credit grew 11.2% last year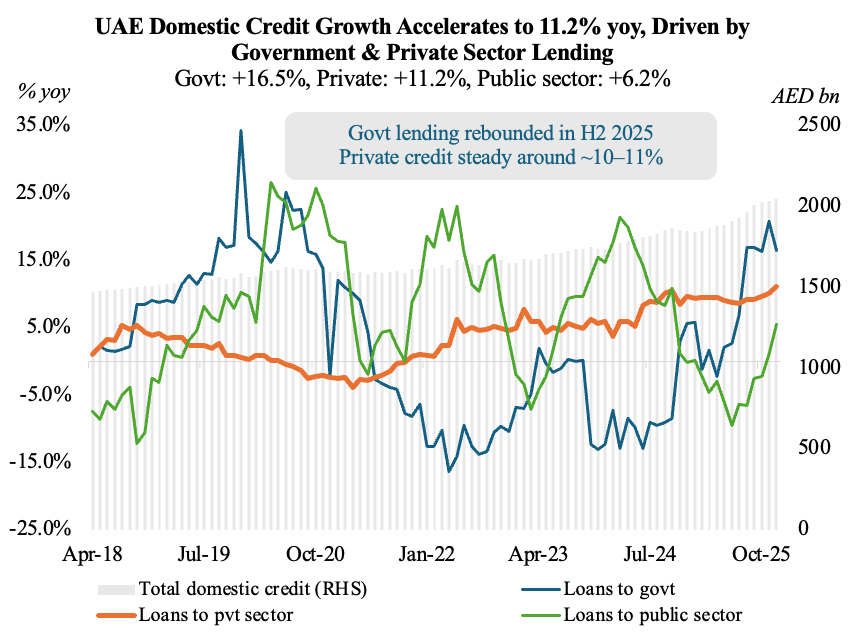
- Credit to UAE’s private sector, which grew by 11.2% yoy to AED 1.5trn in 2025, represented 72.8% of total domestic lending.
- Real estate & construction accounted for 13.5% of total lending in Dec 2025 (vs. 20% in 2021); but the fastest loan growth was reported in credit disbursed to financial services, trade and manufacturing sectors. UAE’s Comprehensive Economic Partnership Agreements (CEPAs) have also boosted trade-related financing requirements.
- SME financing grew by 3.3% qoq and 10.8% yoy to AED 92bn in Dec, the highest since Q3 2021 – accounting for 6.2% of credit to the private sector.
- A lower-cost-of-borrowing fuelled credit expansion can be expected in the UAE later this year, given the Fed rate cuts. This is likely to benefit more capital-intensive sectors such as manufacturing, renewable energy and advanced technology.
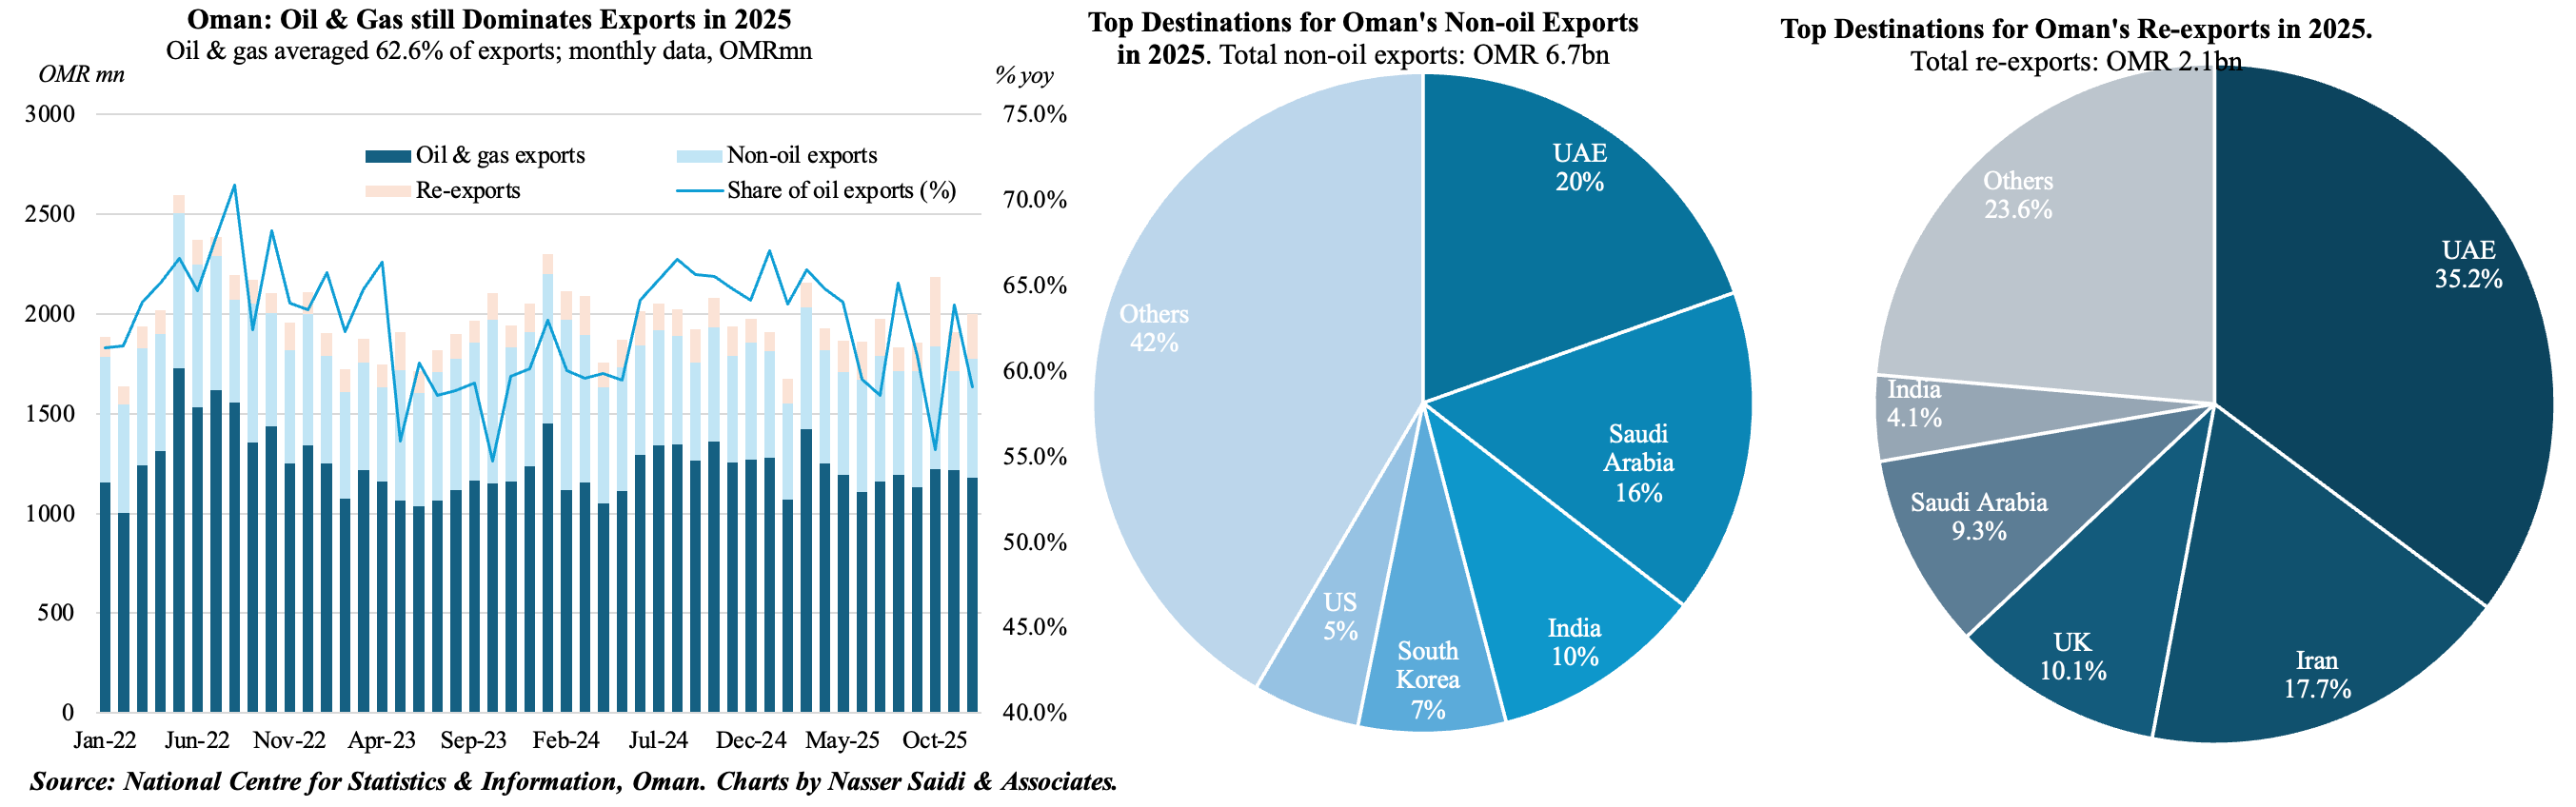
3. Non-oil exports & strong GCC linkages boost Oman’s trade performance in 2025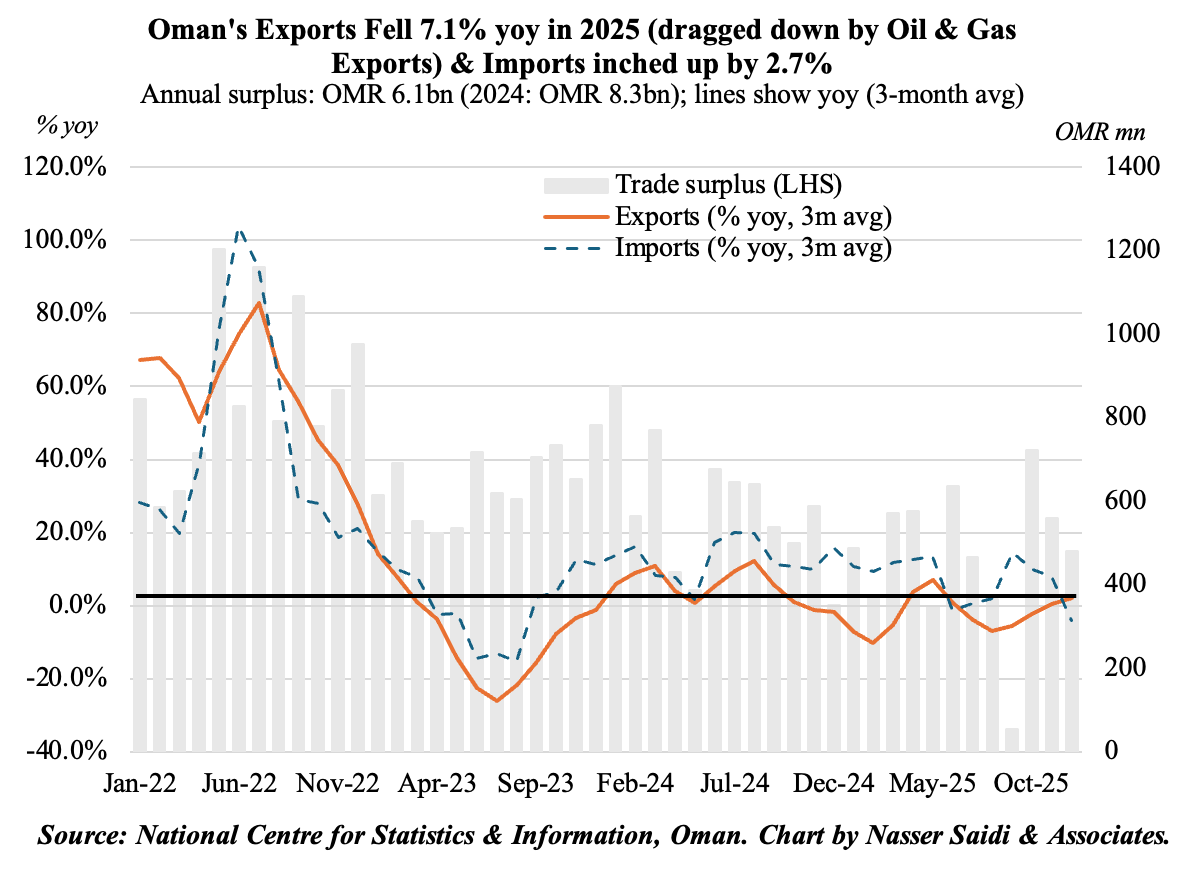
- Oman’s non-oil exports grew by 7.5% yoy to OMR 6.7bn in 2025, thanks to an acceleration in industrial sectors such as base metals (OMR 1.4bn, +9.4% yoy) and chemical products (OMR 908mn, +12.9% yoy). This underscores Oman’s strategic drive to move from just extraction of oil & gas to more value-added manufacturing.
- Intra-GCC trade has also supported this expansion. The UAE remained Oman’s largest non-oil trading partner in 2025, with gains in both direct exports (25.3% to OMR 1.3bn) and re-exports (27.2% to OMR 724mn).
- Oman’s re-export growth has been enabled by growth in its SEZs (e.g. Duqm) and increased rail and road connectivity with Saudi and the UAE. Re-exports to KSA surged 313.2% to OMR 207mn in 2025.
- While total merchandise exports saw a decline (-7.1% yoy to OMR 23.3bn in 2025) due to a 15.2% drop in oil and gas exports, imports grew by 2.7%, allowing the trade surplus to remain healthy at OMR 6.1bn.
- What factors support further expansion in Oman’s trade? (a) A concerted effort by the government to boost non-oil export growth (e.g. the 11th five-year development plan targets 5.9% annual growth in manufacturing); (b) deeper integration with the GCC trade ecosystem (e.g. infrastructure linkages) will support export momentum; (c) trade deals such as the CEPA signed with India in late 2025.
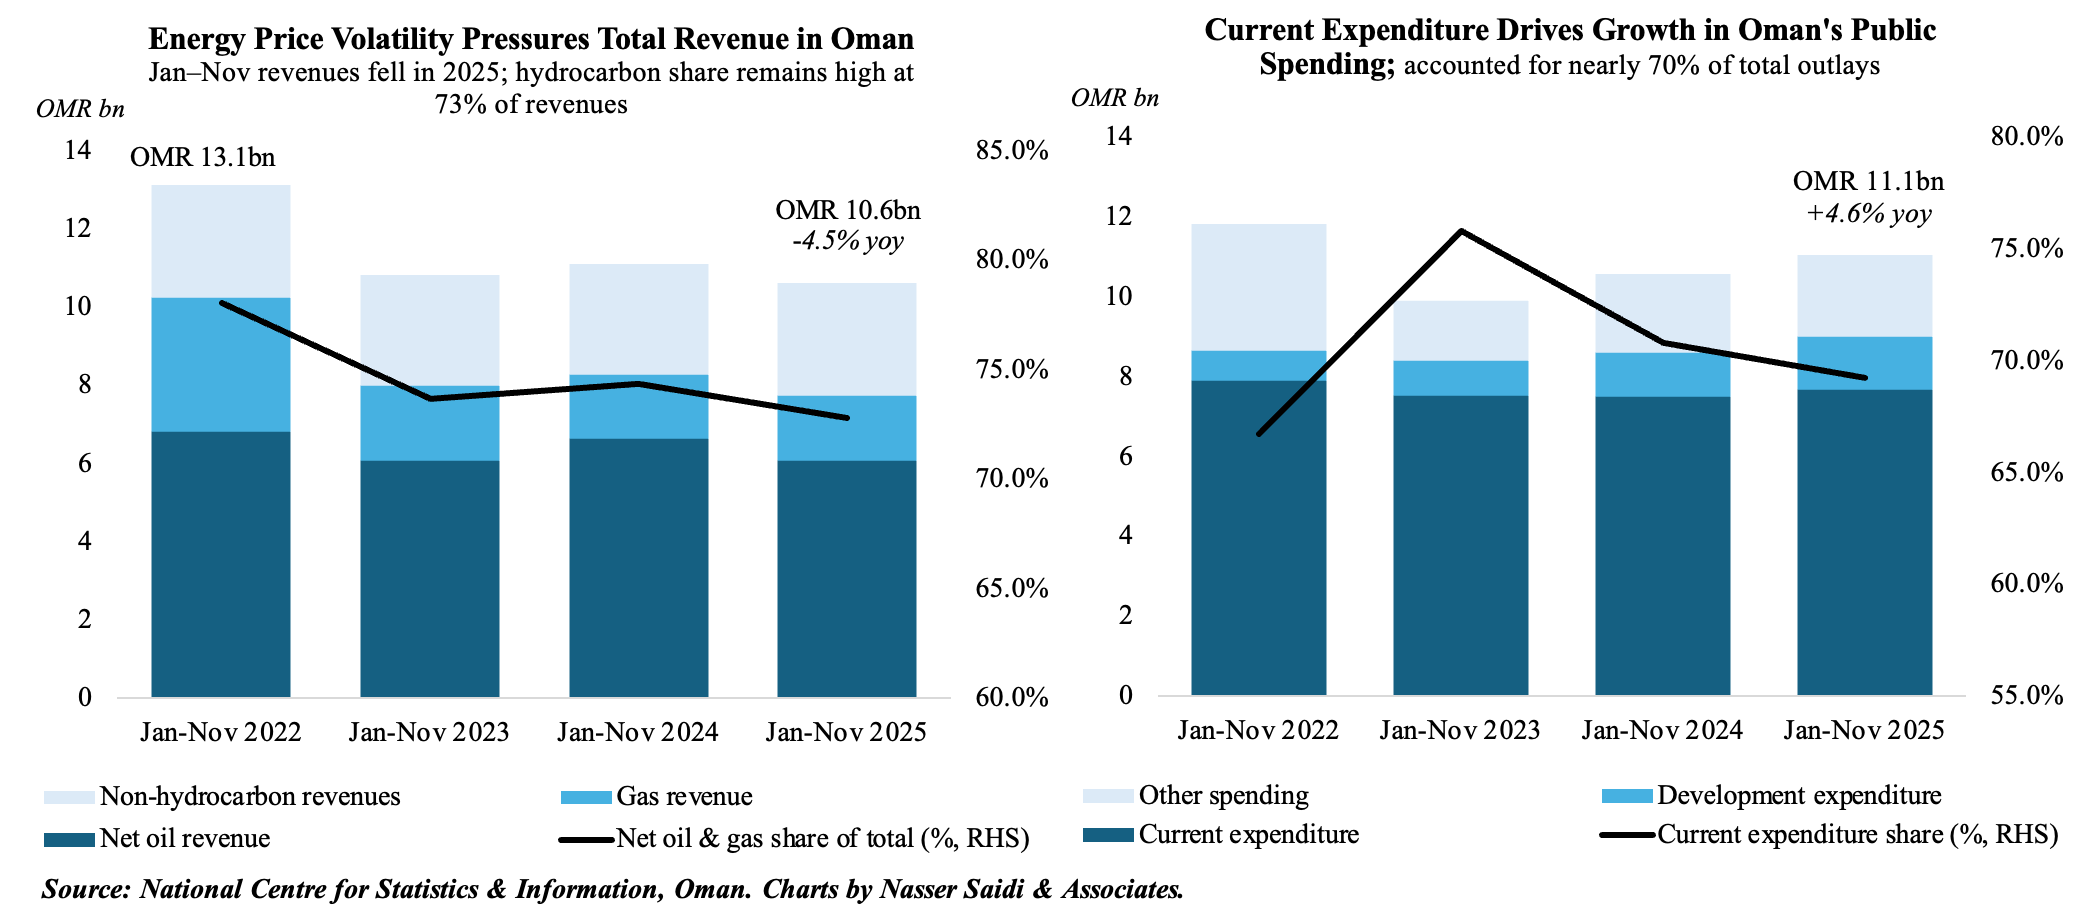
4. Oman’s fiscal deficit of OMR 184mn as of end-Nov ‘25 compares to surplus OMR 536mn in Jan-Nov ‘24; Non-hydrocarbon accounts for 27.2% of total receipts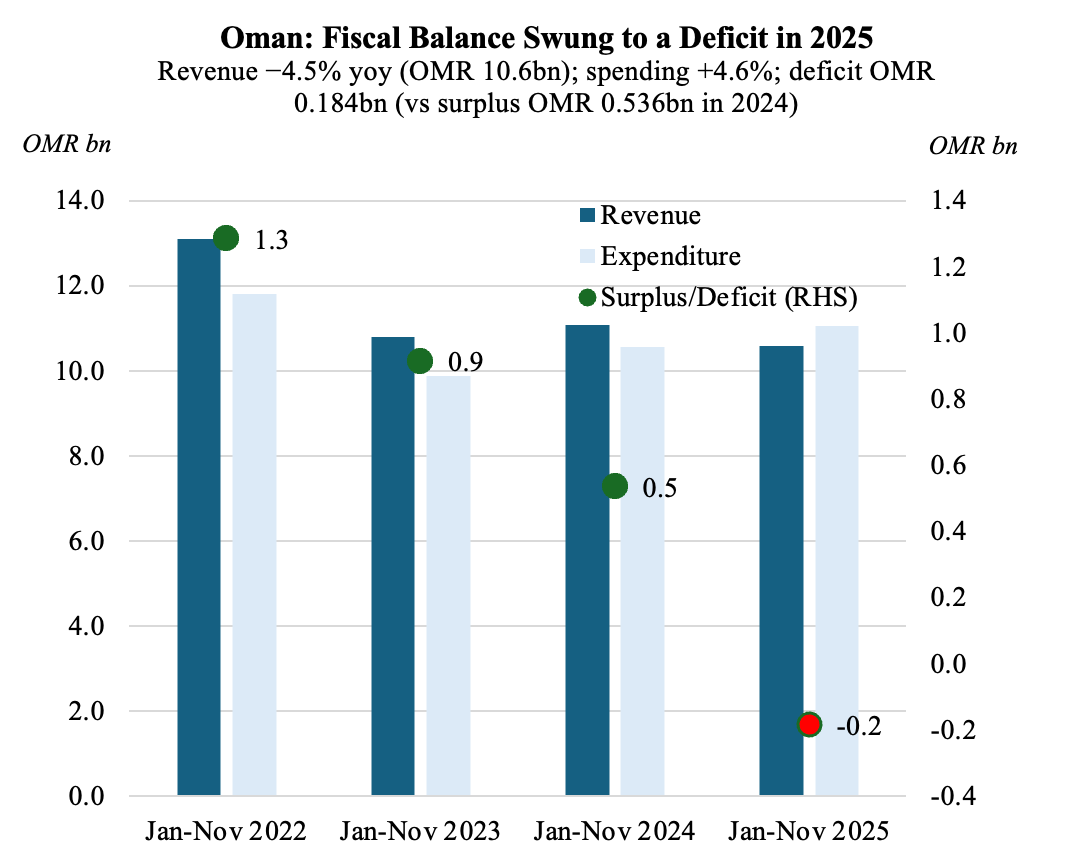
- Non-hydrocarbon revenues in Oman grew by 1.2% yoy to OMR 2.9bn in Jan-Nov ‘25. Though this accounts for about 27.2% of total receipts now, Oman has an ambitious target of 37.4% by 2030 as per the 11th Five-Year Development Plan.
- Despite the revenue diversification, hydrocarbons still account for 72.8% of revenues in Jan-Nov ‘25. Oman has taken steps to broaden its revenue base: e.g. corporate tax and VAT revenues accounted for 22.3% & 22.8% of non-oil receipts.
- Plans to roll out a personal income tax by 2028 underscores the government’s willingness to embrace new revenue instruments.
- Data showed a 20.1% surge in development expenditure (to OMR 1.3bn) in Jan-Nov 2025 & current expenditure edged up slightly (2.3% yoy to OMR 7.7bn). Social protection system and electricity sector subsidy accounted for 52.7% of contributions & other expenses; oil subsides were 2.8% of contributions (vs 10.5% a year ago).
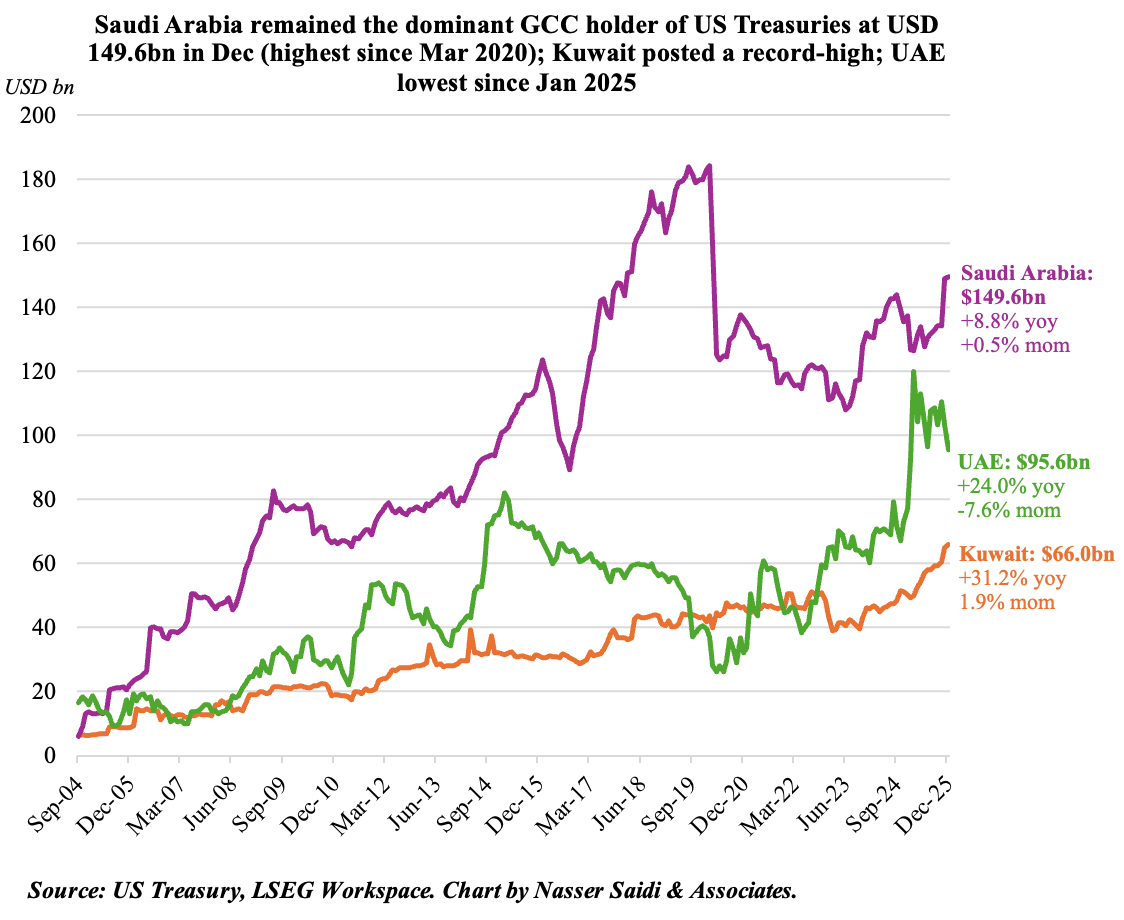
5. GCC nations increase holdings of US Treasuries in 2025; Kuwait rises to a record high; UAE, KSA & Kuwait feature among top buyers; Major BRICS countries (Brazil, India, China) holdings fell
- Overall foreign holdings of US Treasuries grew by 7.6% yoy to USD 9.27trn in 2025. This compares to Nov’s peak USD 9.36trn reading (-0.95% mom).
- While Japan continued as the dominant holder of US Treasury securities (USD 1.19trn). China’s decline in holdings was the most glaring. It fell 9.9% yoy (around USD 85bn) to USD 683.5bn by end-2025, the lowest since 2008. Brazil and India also cut their holdings by close to USD 70bn last year (more than USD 108bn in Nov 2024-Nov 2025).
- Increased buying from financial centres / custody hubs such as UK, Belgium & Luxembourg highlight a shift in holdings: demand from private investors (e.g. pension funds, asset managers) instead of central banks has helped support demand.
- From the GCC, Saudi Arabia, the UAE and Kuwait were among the top buyers last year; Kuwait’s holdings climbed to a record-high last year.
- Going forward, expect continued diversification by central banks (toward assets like gold; both Qatar & UAE added to holdings in 2025); geopolitical and interest rate considerations could reshape foreign demand patterns for US government debt.
Powered by:
![]()