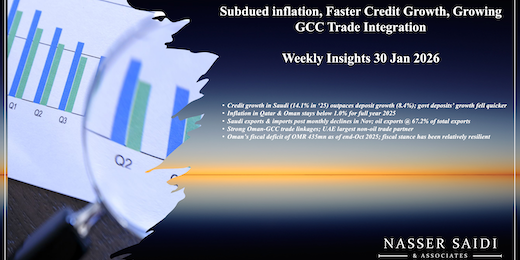


Subdued Inflation, Faster Credit Growth, Growing GCC Trade Integration: Weekly Insights 30 Jan 2026
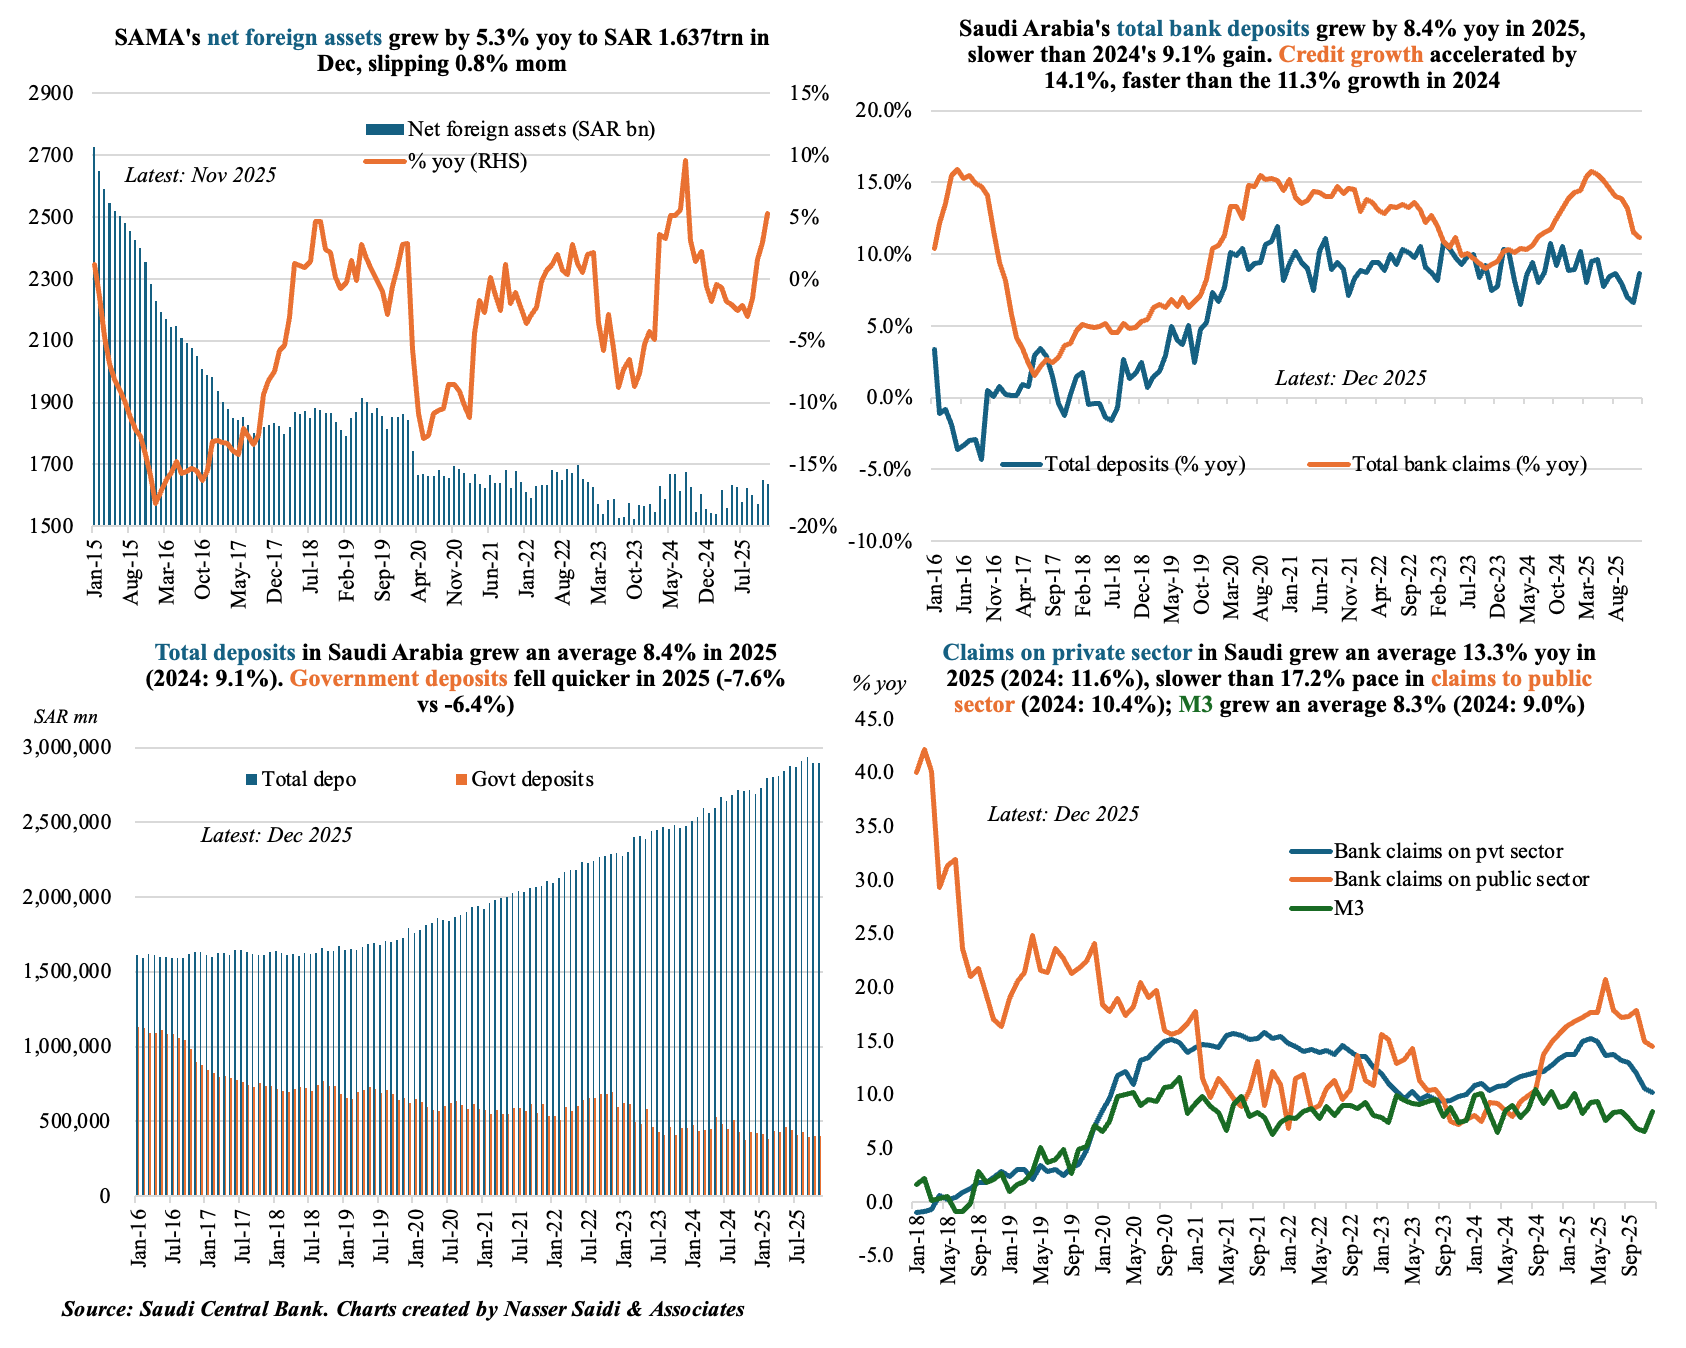
1. Broad money supply in Saudi Arabia grew by 8.3% in 2025 (slower than ‘24’s 9.0%). Pace of credit growth increased in 2025 (14.1% vs 11.3% in ‘24); outpaced deposit growth (which eased to 8.4% in ‘25 vs 9.1% in ‘24). Govt deposits’ growth fell quicker in ‘25. NFA increased by 5.3% yoy to SAR 1.637trn at end-2025.
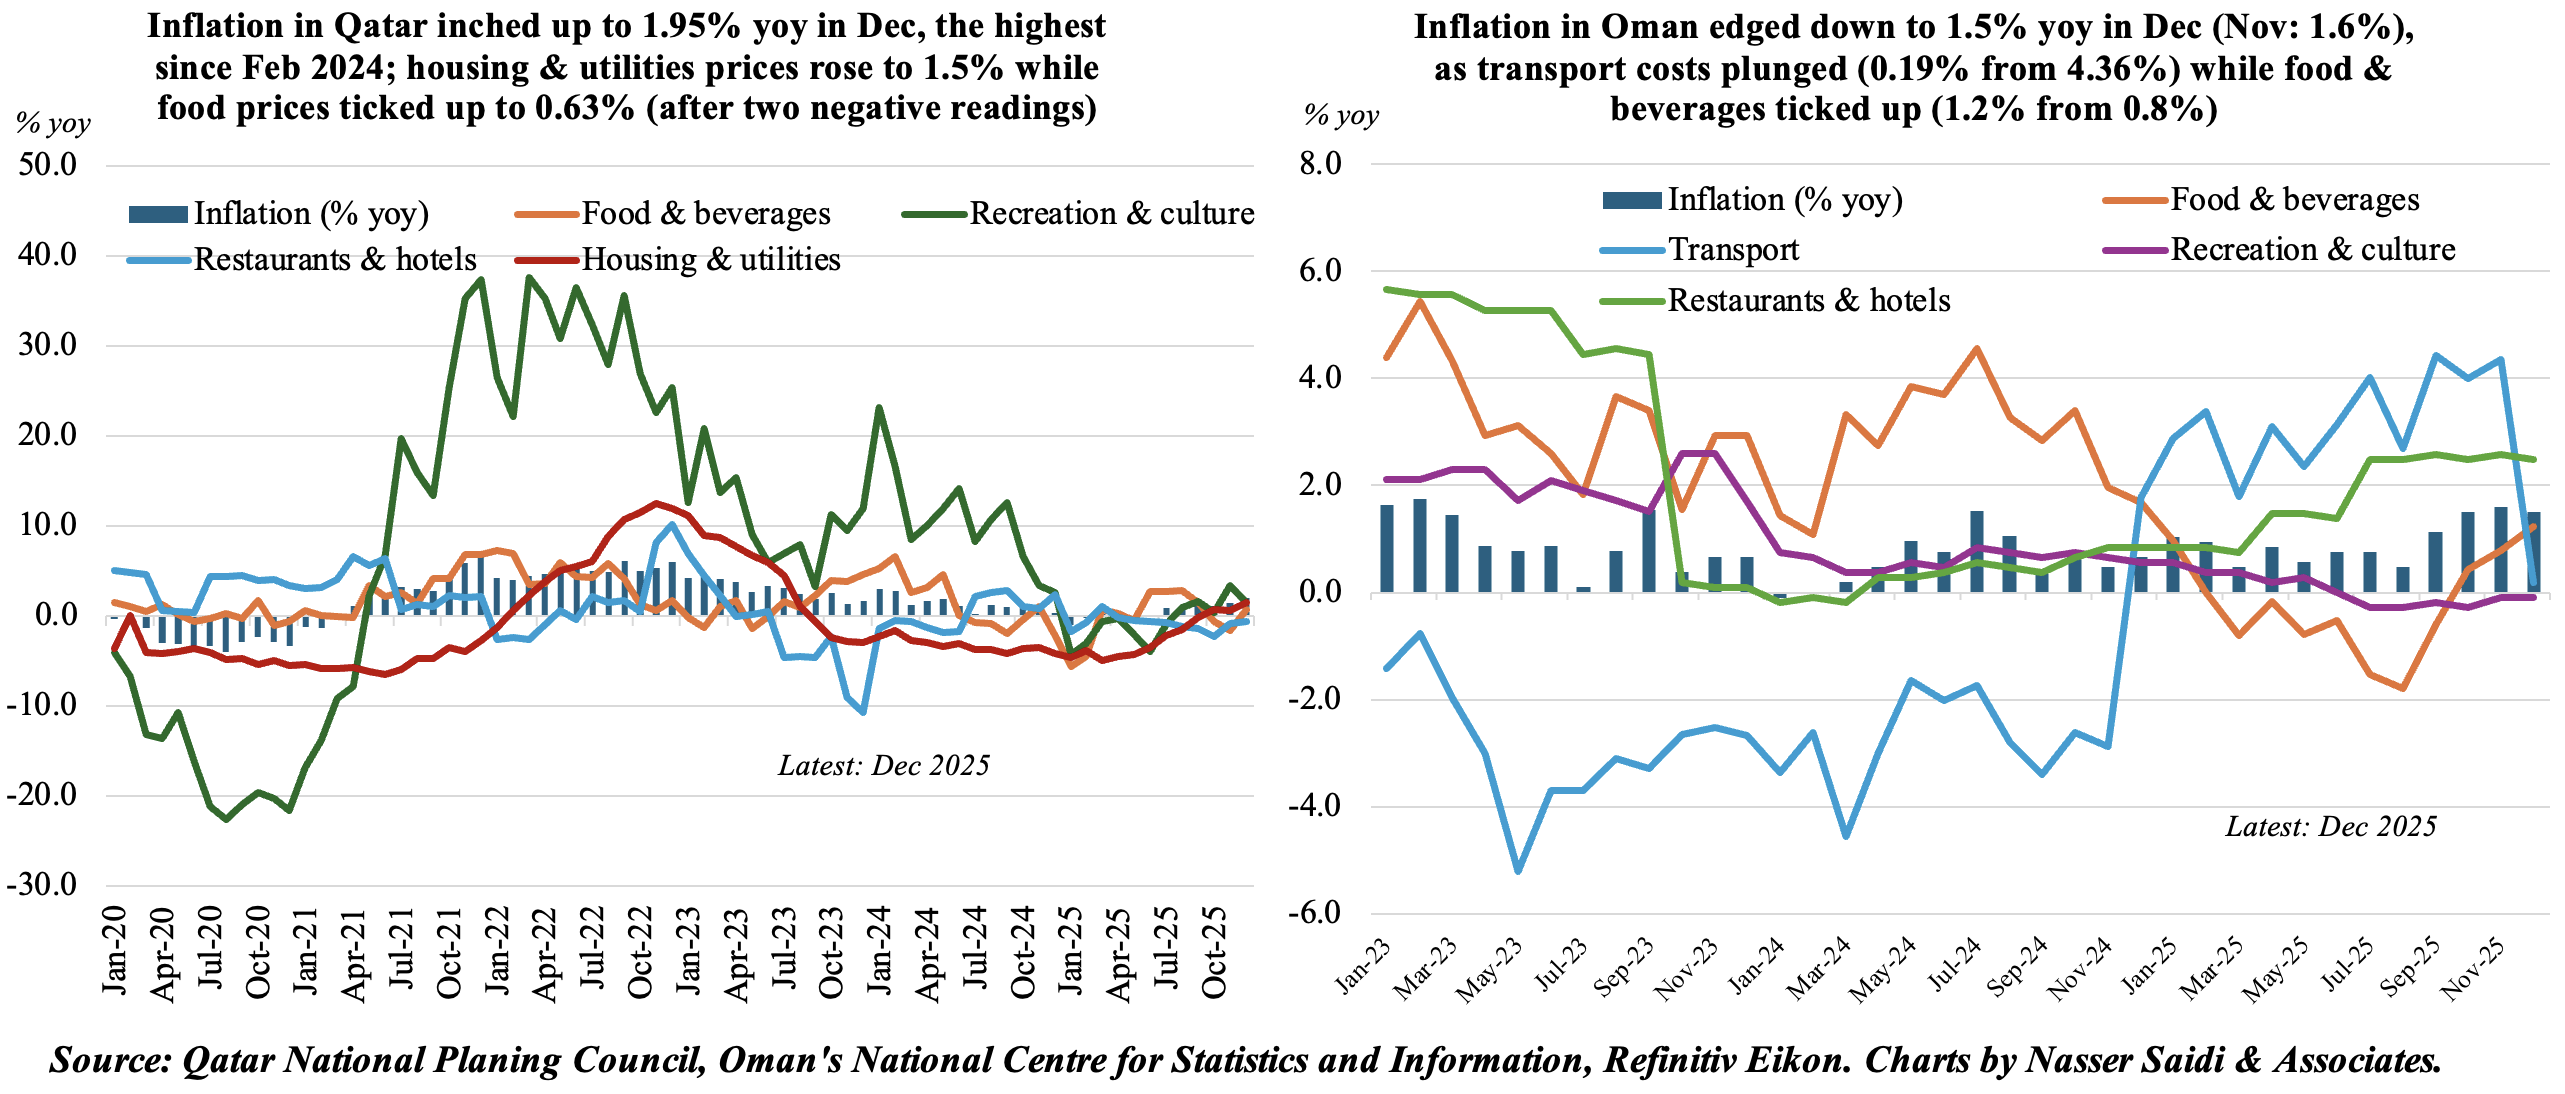
2. Inflation in Qatar & Oman stays below 1.0% for full year 2025
- Inflation in Qatar inched up to 1.95% yoy in Dec (Nov: 1.38%), the highest since Feb 2024, with the miscellaneous goods & services category posting the largest uptick (a record 18.7% yoy). In contrast, Oman’s inflation edged down to 1.5% in Dec, staying higher than 1.0% for the fourth month in a row. The underlying inflation remains well contained by regional standards.
- Food & beverages costs (with weights of 13.5% in Qatar and 20.615% in Oman) ticked up in both Qatar (0.63% vs Nov’s -1.7%) and Oman (1.22% vs Nov’s 0.79%). Prices of housing and utilities (with high weights of 21.2% in Qatar and 31.7% in Oman) rose in Qatar (1.5% in Dec vs Nov’s 0.5%) while in Oman in Oman, it remained flat. Deflationary transport costs in Qatar (-0.42% in Dec vs -1.76% in Nov) while it nudged up in Oman by 0.19%. Qatar’s restaurant & hotels costs fell (-0.65%, falling at an increasing pace for 9 months in a row) but was up 2.5% in Oman.
- For the full year 2025, both Qatar and Oman clocked in sub-1% readings: in Qatar it eased to 0.57% (2024: 1.34%) and inched up in Oman 0.85% (2024: 0.6%). Food & beverages costs were negative in both Oman (-0.48% vs 3.02%) and Qatar (-0.16% vs 1.4%). Qatar’s easing stemmed from recreation & culture (-0.65% vs 10.68%), restaurants & hotels (-0.86% vs 0.33%) and transport (-0.7% vs 0.78%) though miscellaneous good & services surged (12.3% from 3.94%). In Oman, categories that ticked up most were transport (3.2% vs -2.85%) and restaurants & hotels (1.68% vs 0.25%) while housing & utilities was flat (vs 0.39%. In 2024).
- Inflation is widely expected to stay subdued this year in the GCC: IMF estimates inflation to edge up to 2.0% in 2026 (vs 2025: 1.7%).
3. Saudi exports & imports post monthly declines in Nov; oil Xs at 67.2% of total exports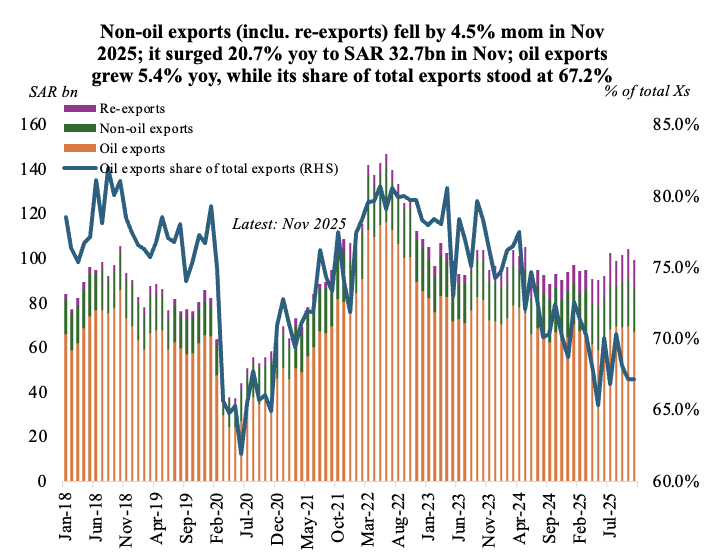
- Saudi Arabia’s overall exports declined by 4.4% mom in Nov, with monthly declines across oil (-4.4%), non-oil (-7.0%) & re-exports (-0.9%). Share of oil exports to overall exports held at 67.2%.
- Total non-oil exports (i.e. including re-exports) increased by 20.7% yoy to SAR 32.7bn in Nov, reflecting broadening external demand beyond hydrocarbons. A breakdown shows that re-exports and domestic non-oil exports (i.e. excluding re-exports) grew by 52.1% yoy and 4.7% yoy to SAR 13.7bn and SAR 18.97bn respectively.
- Imports fell by 6.9% mom and 0.2% yoy to SAR 77.4bn in Nov, resulting in a wider trade surplus, SAR 22.4bn.
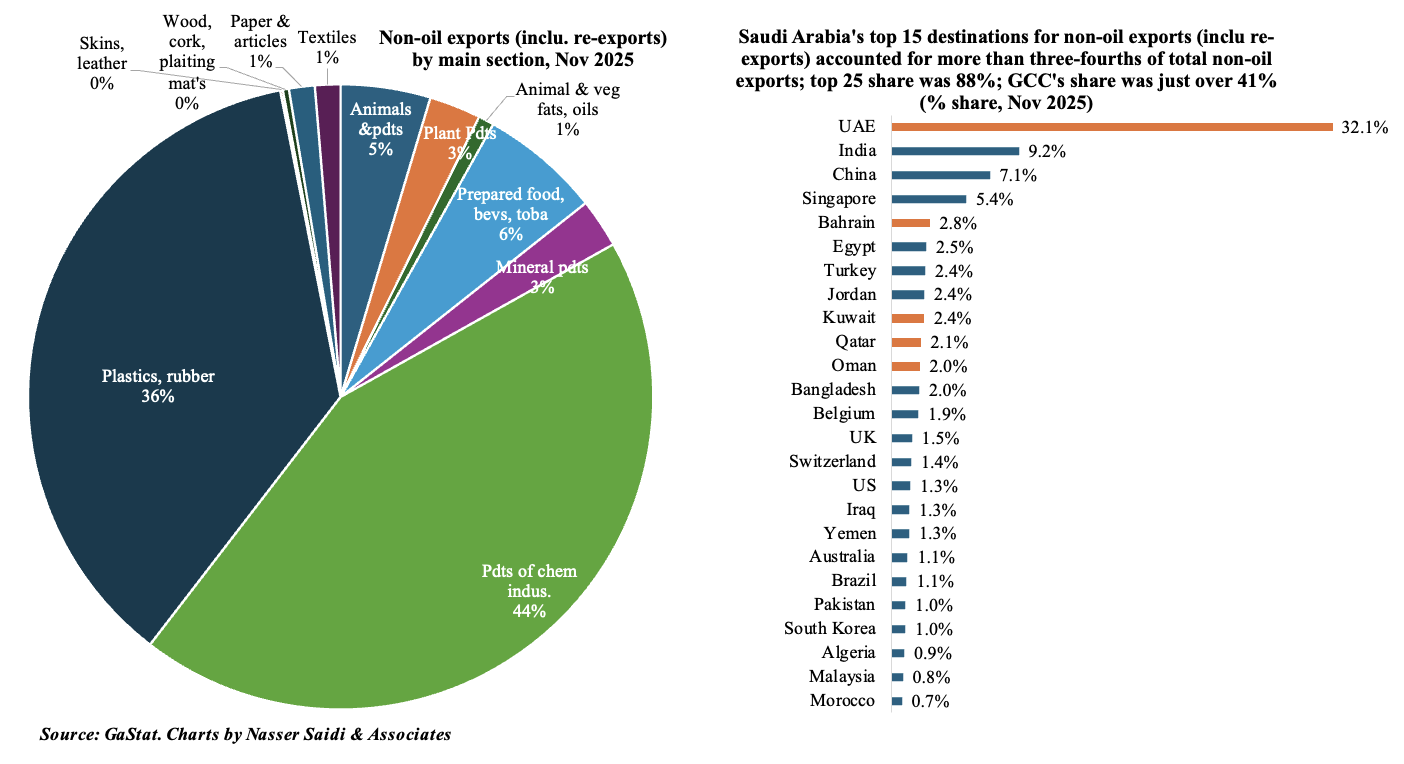
- Machinery was the largest segment of total non-oil exports (24.2%), followed closely by chemicals & its products (20.3%) and plastics, rubber and their articles (17.0%). UAE accounted for 32.1% of non-oil exports; share of non-oil exports to GCC was 41.3%.
- China was the largest trade partner for KSA in Nov: it received 13.7% of Saudi exports and was source nation for 26.7% of KSA imports.
- UAE was one of the top trade partners: received 11.7% of Saudi’s total exports (2nd globally) & 3rd largest source for 6.2% of Saudi imports.
- The share of Saudi non-oil trade with the rest of GCC is substantial: 41.3% of total in Nov. Non-oil trade surplus with the GCC more than doubled to SAR 6.6bn in Nov from a year ago. This was largely due to a 48.8% jump in re-exports & almost doubling of UAE surplus to SAR 5.7bn.
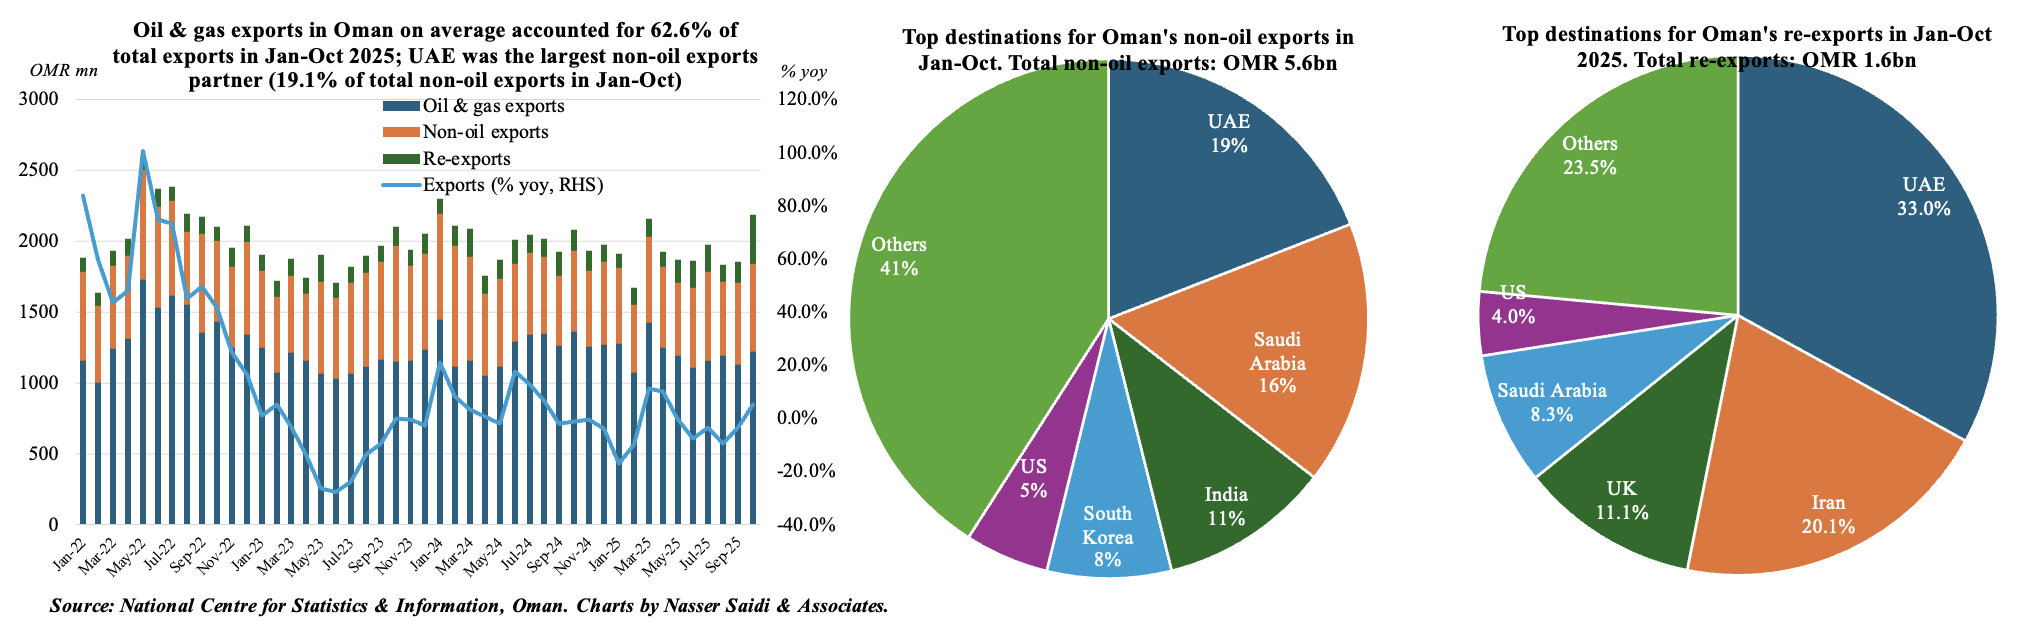
4. Strong Oman-GCC trade linkages; UAE largest non-oil trade partner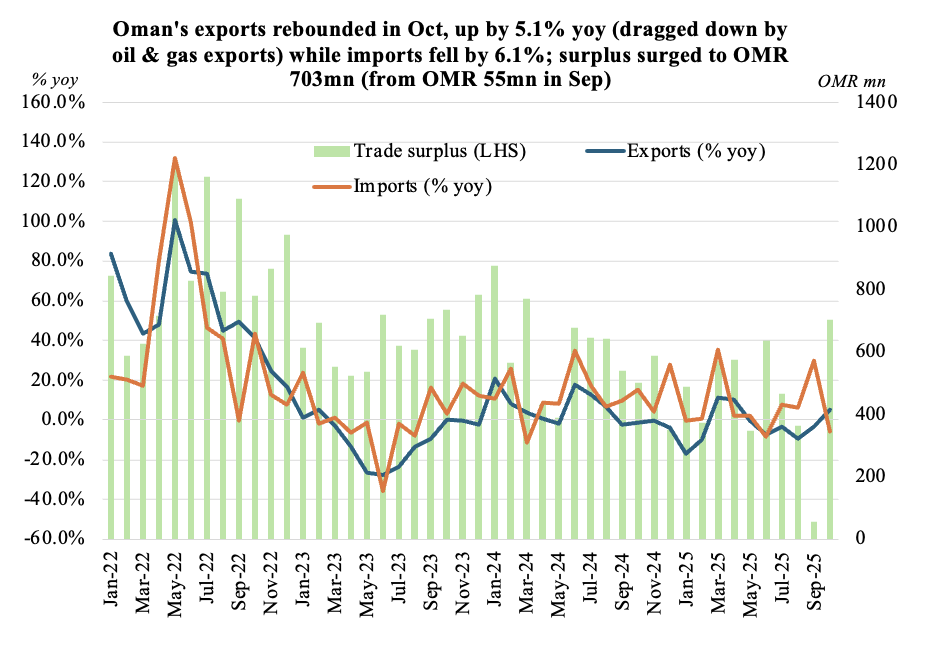
- Resilience in external demand: Oman’s exports rebounded in Oct, up 5.1% yoy (to OMR 2.18bn) following five months of yoy declines. Imports fell by 17.7% mom and 6.1% yoy (to OMR 1.48mn), clocking in a surplus of OMR 703mn versus Sep’s OMR 55mn (lowest since Sep 2017).
- Oil & gas exports continue to be under pressure. In Oct, oil exports fell by 10.3% yoy, accounting for 56% of total exports. In Jan-Oct, it plunged 16.3% yoy to OMR 12.13bn, with a share of 62.6% of Oman’s total exports.
- In contrast, non-oil exports grew by 9.9% yoy to OMR 5.6bn in Jan-Oct; mineral products, at OMR 1.42bn (-5.2% yoy), accounted for one-fourth of non-oil exports and 7.3% of total exports. Re-exports increased at a quicker pace, up 11.6% to OMR 1.61bn. This underscores the gradual progress in diversifying the export base beyond O&G.
- Import structure reflects capex & industrial investment: transport equipment (28.2% to OMR 1.55bn in Jan-Oct) & electrical machinery/equipment (4.9% to OMR 2.48bn). This could over time feed back into non-oil export sectors.
- In Jan-Oct, exports fell by 8.0% to OMR 19.4bn & imports rose by 6.8% to OMR 14.7bn resulting in a narrower trade surplus (OMR 6.25bn vs OMR 6.29bn a year ago).
- Greater regional integration. UAE is Oman’s largest non-oil trade partner: non-oil exports to UAE grew by 27.6% yoy to OMR 1.07bn in Jan-Oct, while re-exports were OMR 532mn (7.7%). Oman’s imports originated mainly from GCC: UAE was Oman’s largest source of imports (OMR 3.49bn, or 23.8% of total); along with Kuwait & KSA, these 3 countries accounted for 39.5% of imports. Agreements such as the recent Oman-CEPA can increase market access & boost trade.
5. Oman’s fiscal deficit of OMR 435mn as of end-Oct 2025 stands in contrast to a surplus of OMR 520mn in Jan-Oct 2024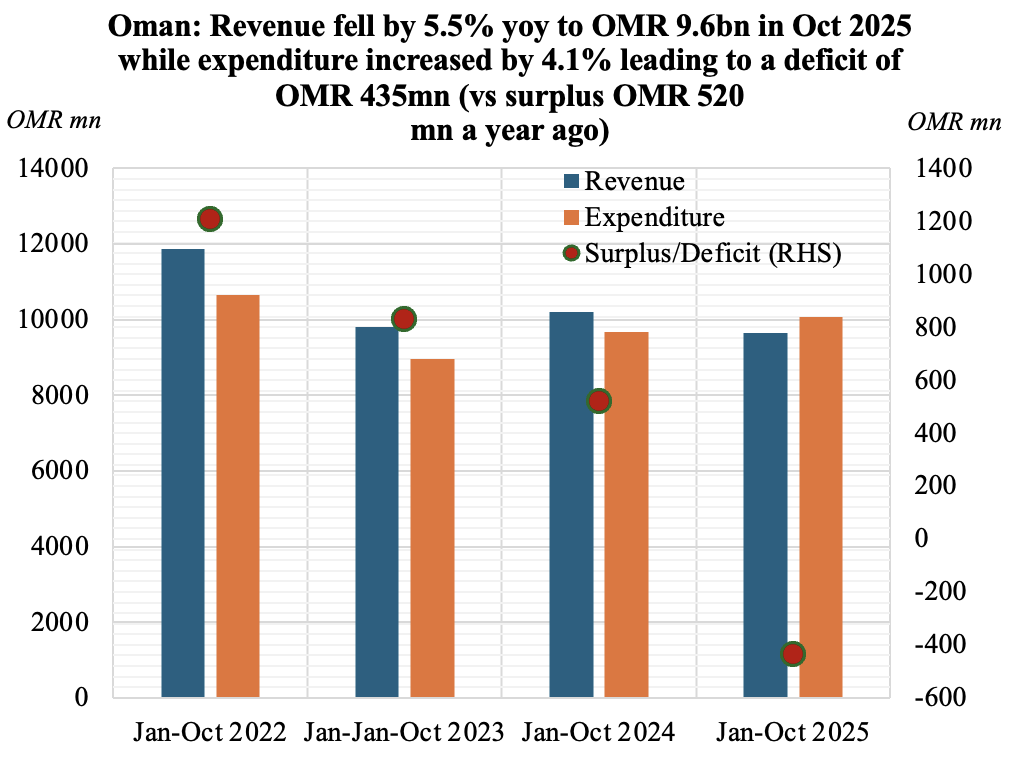
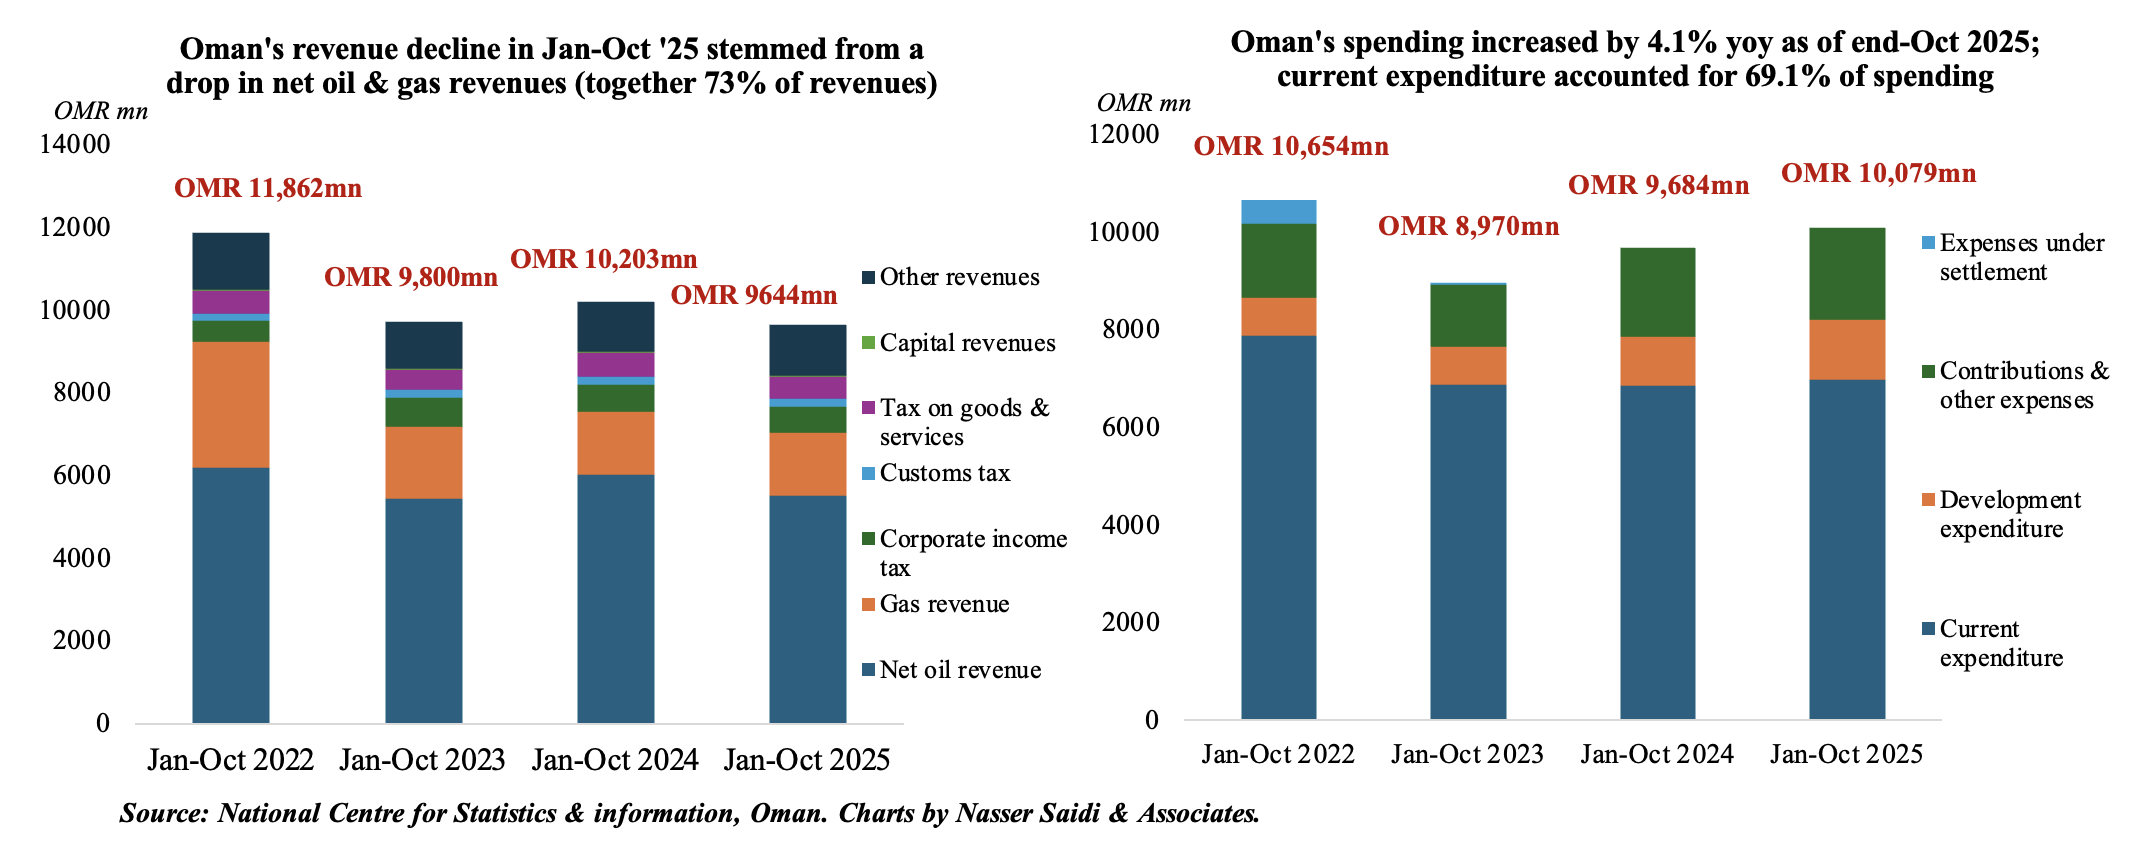
- Oman’s budget deficit of OMR 435mn in Jan-Oct 2025 compares to the projected deficit of OMR 620mn as per the budget). Revenues fell by 5.5% yoy to OMR 9.64bn alongside a 4.1% uptick in spending (to OMR 100.79bn).
- Revenues pressured by lower net oil and gas receipts. There was a sharp decline in net oil revenues (-8.46% yoy to OMR 5.52bn) and gas revenues (-0.13% to OMR 1.52bn). Net O&G together accounted for 73.0% of revenues as of Oct. Tax revenues fell by 4.66% to OMR 1.35bn: corporate taxes and taxes on goods & services accounted for 46.5% & 38.9%.
- Expenditure grew by 4.09% in Jan-Oct 2025: current expenditure edged up slightly (1.57% yoy to OMR 6.97bn) alongside a 25.3% surge in development expenditure (to OMR 1.24bn) while contributions & other expenses edged up by 2.0% to OMR 1.87bn. Social protection system and electricity sector subsidy accounted for 52.8% of contributions & other expenses; oil subsides were 3.5% of contributions (vs 10.9% a year ago).
- Oman’s fiscal stance has been relatively resilient, aided by expenditure discipline and a narrowing of deficits compared with earlier periods; broader IMF assessments note that prudent policies are helping sustain fiscal balance at modest levels relative to GDP.
Powered by:
![]()