

Download a PDF copy of the weekly economic commentary here.
Markets
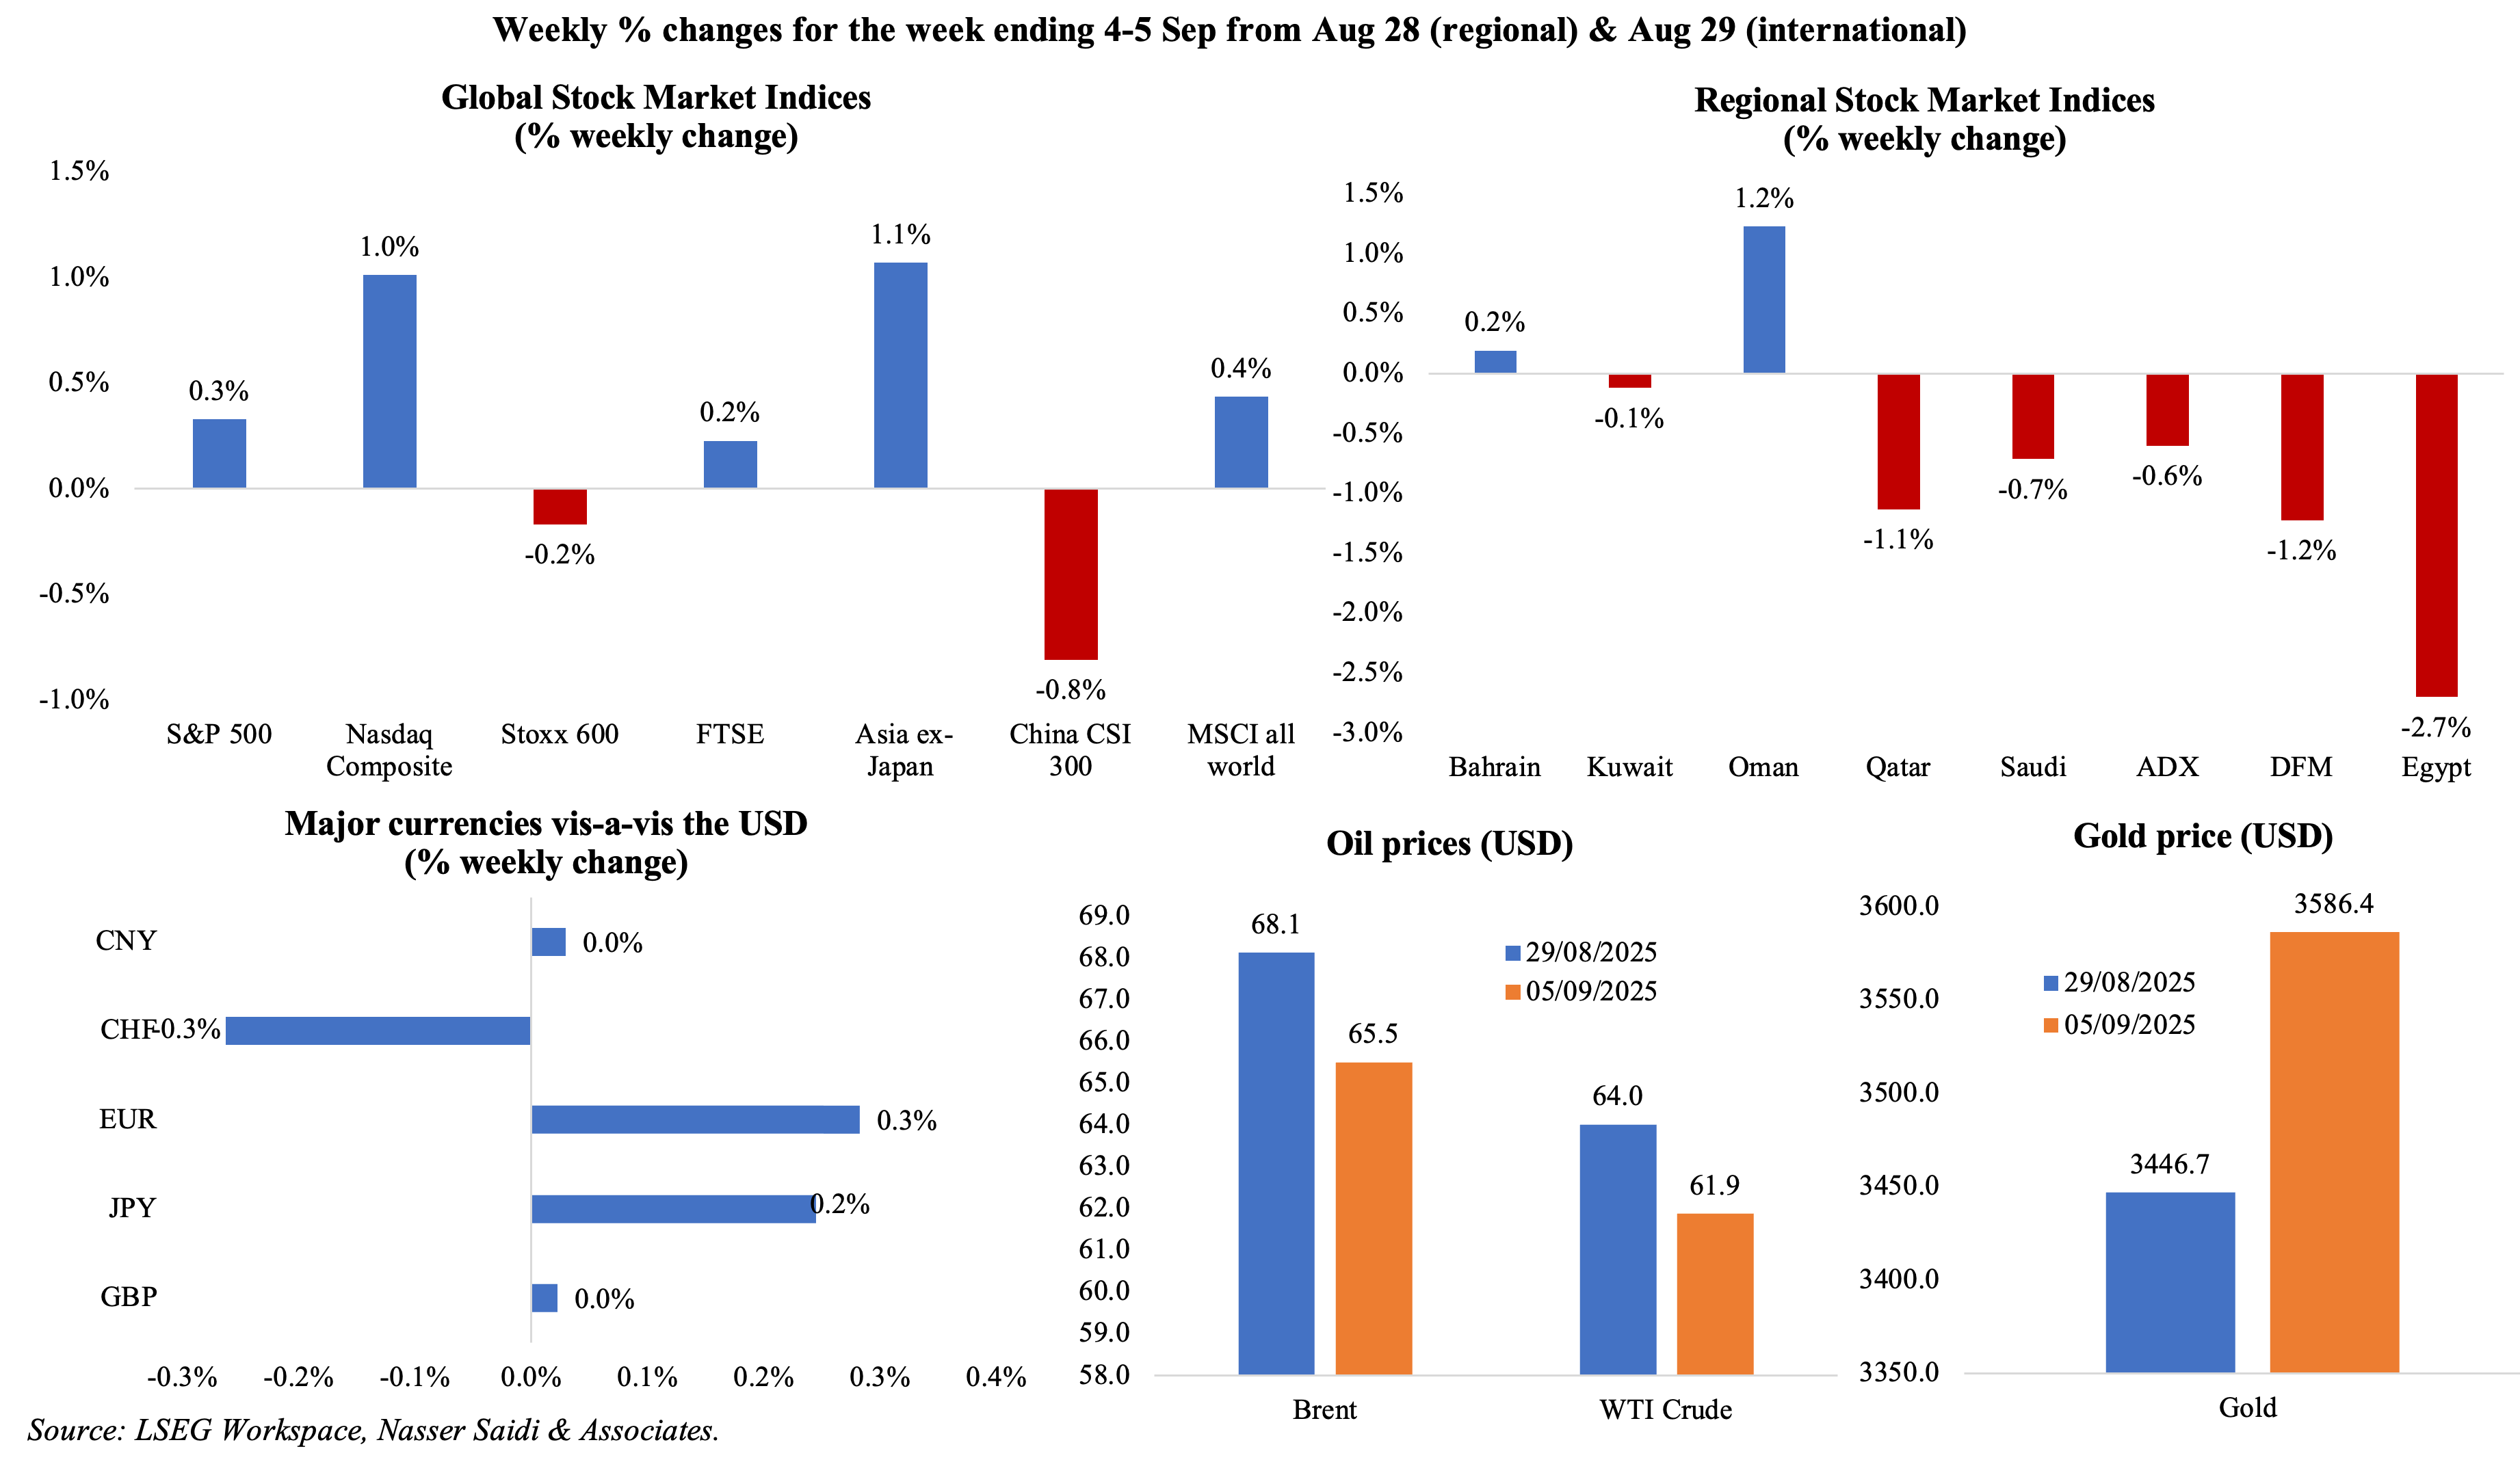
Global equities posed a mixed picture: US stocks touched record highs during the week that ended with weak nonfarm payrolls data feeding expectations of a Fed rate cut; Europe’s performance was quite muted; a US presidential executive order lowering tariffs on Japan’s automobile imports saw shares of the sector tick up. Regional markets were mostly down on weak oil. Among currencies, the dollar fell sharply after the payrolls data while worries about Fed’s independence are rubbing off on the global standing of the USD. Oil prices ticked lower ahead of the OPEC+ meeting over the weekend – where a decision was made to further increase production targets. Gold prices crossed record highs given uncertainty related to US tariffs and trade as well as questions related to the independence of the Fed (central banks are stocking up the metal).
Global Developments
US/Americas:
- Nonfarm payrolls in the US increased by just 22k in Aug, below an upwardly revised 79k in Jul (Jun’s was revised to show payrolls declined by 13k, the first drop since Dec 2020), suggesting a marked deceleration in hiring momentum. Health care and social assistance saw jobs increased by 31k and 16k respectively, while losses in the federal government amounted to 15k. Wage growth remained stable, rising by 0.3% mom and 3.7% yoy. Labour force participation rate inched up to 62.3%. Unemployment rate inched up to a near four-year high of 4.3% (Jul: 4.2%). Looking ahead, persistent softness in hiring could relieve wage pressures and support the Fed’s case for near-term easing.
- Non-farm productivity grew by 3.3% in Q2 (Q1: 2.4%), signalling improved efficiency within the economy, as output increased 4.4% while hours worked increased 1.1%. The modest increase in unit labour costs (+1%, following a 1.6% gain in Q1) also reflects a cooling in wage inflation, which is crucial for the broader inflation outlook.
- Private sector in the US added 54k jobs in Aug (Jul: 106k), with the services sector adding 42k jobs while manufacturing lost 7k jobs. This deceleration aligns with the broader cooling trend in the labour market and signals caution among employers amid high levels of economic uncertainty and tighter credit conditions.
- JOLTS job openings declined to 7.181mn in Jul (Jun: 7.357mn), the lowest level since Sep 2024, and there were just 0.99 job openings for every unemployed person. Importantly, a cooling in job openings without a surge in layoffs points to a “soft landing” scenario, where demand eases but widespread job losses are avoided.
- Initial jobless claims in the US rose by 8k to 237k in the week ended Aug 30 and the 4-week average inched up by 2.5k to 231k. Continuing jobless claims slipped to 1.944mn in the week ended Aug 23 and up from 1.94mn the week prior.
- Fed Beige book showed the economy has been flat (i.e. no growth), with most districts reporting little or no change in economic activity. Consumer spending was flat to declining, as “wages were failing to keep up with rising prices”, while business activity was uneven across sectors. Tariff-related price increases were reported by nearly all, and many Districts pointed to impact on prices of inputs.
- US factory orders fell by 1.3% mom in Jul, extending the weakness seen in Jun (-4.8%), dragged down by commercial aircraft bookings (-32.7%). Non-defence capital goods excluding aircraft, a proxy for business spending plans on equipment, jumped 1.1% in Jul. The back-to-back contractions points to both domestic and global demand being under pressure.
- Goods and services trade deficit in the US widened to USD 78.3bn in Jul (Jun: USD 59.1bn), primarily driven by a decrease in the services surplus (by USD 1.1bn to USD 25.6bn) and an uptick in goods imports (5.9% to USD 358.8bn; capital goods imports surged to a record USD 96.2bn). Goods trade deficit remained relatively stable (USD 103.9bn in Jul vs Jun’s USD 103.6bn): but the rising trade deficit will act as a drag on GDP.
- S&P Global manufacturing PMI in the US slowed to 53.0 in Aug (prelim: 53.3), but higher than Jul’s 49.8: new orders were up for the eighth month in a row while production grew at the fastest pace in more than three years. This was happening alongside accelerating input cost pressures (second-largest increase in three years) and rise in output charges. Services PMI slipped to 54.5 (from the flash estimate of 55.4 and Jul’s 55.7): while volume of new businesses grew (especially financial services) and employment increased (for the 6th consecutive month), higher payroll expenses and tariff-related input costs hike led to firms passing on costs to customers (output charge inflation was near a 3-year high).
- US ISM manufacturing PMI increased to 48.7 in Aug (Jul: 48), as new orders jumped (51.4 from 47.1) and employment ticked up (43.8 from 43.4) while prices paid declined (63.7 from 64.8). ISM services PMI rose to 52 in Aug(Jul: 50.1), as new orders increased (56 from 50.3) and employment inched up (46.5 from 46.4) while prices paid slowed (69.2 from 69.9).
Europe:
- Preliminary estimates show inflation in the eurozone inched up to 2.1% in Aug (Jul: 2.0%), with an increase in unprocessed food prices (5.5% from 5.4%), while services inflation eased (3.1% from 3.2%) and energy costs fell 1.9%. Core inflation held steady at 2.3%, the lowest since Jan 2022. The persistence of core inflation above the ECB’s 2% target underscores the sticky nature of underlying price pressures.
- Eurozone’s manufacturing PMI rose to a 38-month high of 50.7 in Aug (prelim: 50.5, Jul: 49.8), with increase in production the quickest since Mar 2022 and total new order volumes rising for the first time in close to 3.5 years (thanks to better domestic sales). The rebound in manufacturing is encouraging after a prolonged slump, even as pressure on supply chains intensified. Services PMI eased to 50.5 (flash estimate of 50.7) as new orders stagnated alongside an increase in job creation; both input and output costs increased.
- Producer price index in the eurozone grew by 0.4% mom and 0.2% yoy in Jul. The yoy increase was seen across consumer goods – both non-durable (1.9%) and durable (1.7%) – and capital goods (1.8%) while energy prices declined (-1.2% from 0.0%).
- Eurozone’s retail sales fell by 0.5% mom in Jul (Jun: 0.6%), the sharpest decline in almost two years, pointing to weakening consumer momentum. The drop was evident in sales of food, drinks and tobacco (-1.1% from Jun’s 0.7%) and automotive fuel sales (-1.7% from 0.8%). In yoy, sales grew by 2.2%, slower than Jun’s 3.5% gain, suggests a loss of spending strength.
- Unemployment rate in the eurozone declined to 6.2% in Jul (Jun: 6.3%), a positive surprise suggesting that labour markets remain resilient despite broader economic headwinds. Youth unemployment also improved, falling to an all-time low of 13.9% (Jun: 14.3%), while the lowest rates were reported by Germany (3.7%) and the Netherlands (3.8%).
- German factory orders fell by 2.9% mom and 3.4% yoy in Jul (Jun: -0.2% mom and 1.7% yoy), driven by a 38.6% mom plunge in orders for aircraft, ships, trains, and military vehicles. This decline stemmed from waning demand from key trading partners (-3.1% mom; declines of 3.8% and 2.8% from non-euro area and within the bloc respectively) and weaker capital and intermediate goods orders (-2.4% and -5.3% respectively), which are typically forward-looking indicators.
- Manufacturing PMI in Germany edged down slightly to 49.8 in Aug (from the preliminary estimate of 49.9 and higher than Jul’s 49.1), the strongest reading since mid-2022. New orders rose for the third month in a row and output growth quickened (most since Mar 2022). Services PMI fell below-50, to 49.3 (from 50.1), as new work decreased alongside a stagnation in hiring. Both input prices and output charges increased from Jul’s multi-year lows (firms cited wage pressures).
- UK manufacturing PMI fell to 47 in Aug (prelim: 47.3; Jul: 48), staying in contractionary territory for the 11th month in a row, indicating sustained weakness amid global and domestic pressures. Output fell (but at a slower pace) alongside a faster drop in new orders and employment levels fell.
- Retail sales in the UK grew by 0.6% mom and 1.1% yoy in Jul (Jun: 0.3% mom and 0.9% yoy), supported by good weather and one-off factors such as the sales of clothing and merchandise related to the Euro 2025 women’s football tournament. The ONS also made corrections to past data (taking into account effect of holidays such as Easter), resulting in H1 retail sales growth being revised down to 1.1% from 1.7%.
Asia Pacific:
- China’s RatingDog manufacturing PMI rose to 50.5 in Aug (Jul: 49.5), returning to expansionary territory and the highest reading since Mar, thanks to output returning to growth, stronger inflows of new orders amid sentiment rising to a 5-month high. Services PMI inched up to 53 (Jul: 52.6), the fastest uptick since May 2024, as new orders and export orders rose; input prices ticked up on higher wages and rising raw material prices while selling prices fell.
- Japan’s GDP grew at a 2.2% annualised pace in Q2, more than double the initial estimate of 1.0%. GDP ticked up by 0.5% qoq, supported by private consumption (0.4%) and exports (2.0%) while capital spending posted a weaker reading (0.6% qoq versus initial estimate of 1.6%). The stronger than expected growth rate could allow the BoJ build a case for pursuing a rate hike, though PM Ishiba’s resignation could lead to some disruption / policy uncertainty.
- Overall household spending in Japan grew by 1.4% yoy in Jul (Jun: 1.3%), maintaining a modest upward trend. In monthly terms, spending was up 1.7%, reversing Jun’s 5.2% decline. This improvement, coupled with a notable acceleration in labour cash earnings to 4.1% yoy (Jun: 3.1%) suggests that real incomes may finally be recovering after a prolonged period of stagnation.
- Preliminary estimated indicate that Japan’s leading economic index increased to a 4-month high of 105.9 in Jul (Jun: 105.1). Coincident index fell to 113.3 (Jun: 115.9) suggesting softening current economic conditions, with manufacturing and exports facing headwinds.
- Japan’s manufacturing PMI inched lower to 49.7 in Aug (prelim: 49.9), the 13th straight month of contraction, as output fell and foreign sales fell at the fastest rate since Mar 2024 – reflecting weak external demand and a cautious investment outlook. By contrast, the services sector remains robust, with the PMI jumping to 53.1 (from preliminary reading of 52.7), buoyed by strong domestic demand while foreign demand weakened further and employment posted the first decline since Sep 2023.
- India slashed consumption tax on hundreds of items to bolster domestic demand, and this will come into effect on 22nd Sep, just ahead of the festive season. The goods and services tax has been simplified into two slabs of 5% and 18% (from 4 slabs currently). However, a separate 40% tax will apply on sin goods such as cigarettes and carbonated beverages as well as on “super luxury” items (e.g. cars with engine capacity exceeding 1,500 cubic centimetres).
- Manufacturing PMI in India declined to 59.3 in Aug from the initial estimate of 59.8 (vs Jul: 59.1). Production growth accelerated to a near five-year high while new orders grew at the fastest pace in 57 months. Domestic demand remaining strong supported optimism for the future, especially in the backdrop of Trump’s 50% tariff.
- South Korea’s GDP grew by 0.7% qoq and 0.6% yoy in Q2 (prelim: 0.6% qoq and 0.5% yoy), confirming a stable recovery, supported by government stimulus and improving exports (4.5% qoq vs prelim 4.1% rise, thanks to demand for semiconductors and petrochemicals). Last week, the BoK raised its 2025 growth forecast to 0.9% (from 0.8%), citing the impact of two supplementary budgets worth KRW 45.6trn aimed at boosting household consumption.
- Inflation in South Korea eased to 1.7% in Aug (Jul: 2.1%), the lowest since Nov 2024, largely due to a decline in telecommunication costs (-13.3%) and gasoline prices while the largest increase stemmed from food & beverage costs (4.9%). Core inflation tipped down to 1.9% from Jul’s 2.3%. This downward trend reduces pressure on the BoK to maintain a restrictive policy stance, especially as growth remains tepid.
- Singapore’s manufacturing PMI returned to a neutral territory, clocking in a reading of 50 in Aug (Jul: 49.9). The electronics sector PMI ticked up to 50.4 (from 50.2) supported by the demand related to AI, while overall PMI was supported by faster growth in new exports and new orders.
- Retail sales in Singapore rebounded by 4.1% mom in Jul (Jun: -1.1%), with most sectors posting increases including supermarkets & hypermarkets (9.6%), minimarts & convenience stores (6.1%) and computer & telecommunications equipment (5.7%) among others. In yoy terms, sales grew by 4.8% (Jun: 2.4%).
Bottom line: With all the recent US labour-related data pointing to more underlying weakness than suggested by the headline unemployment rate, traders have already priced in an interest-rate cut when the Fed meets next week; the inflation print this week could be crucial though. The ECB meeting this week is likely to see the apex bank hold rates steady – in the backdrop of the EU-US trade deal and recent relatively positive economic data. Post-meeting comments will be watched for one, policy direction and two, remarks related to the economic and fiscal turmoil in France. Separately, worldwide PMI surveys climbed to a 14-month high in Aug, but future expectations fell to one of the lowest levels seen since the pandemic on US policy uncertainty (related to tariffs).
Regional Developments
- Bahrain’s non-oil imports surged by 17.0% yoy to BHD 544mn (USD 1.44bn) in Jul, driven primarily by raw materials like non‑agglomerated iron ores (11% of total), other aluminum oxide (9%), and aircraft engine parts (5%). Meanwhile, non-oil exports declined by 1.0% to BHD 333mn and non-oil re-exports rose 3.0% to BHD 63mn million, with over a third directed to the UAE. Trade deficit widened to BHD 148mn from BHD 66mn in Jul 2024.
- Bahraini private sector investments in Egypt totalled USD 450mn across more than 237 companies in 2024, channelled into finance, industry, tourism, and real estate while bilateral non-oil trade was around USD 460.5mn. According to EDB Bahrain, in 2024, Egypt ranked as Bahrain’s 14th largest non-oil trading partner for imports and 6th largest export destination.
- Egypt’s non‑oil private sector PMI contracted for the sixth consecutive month in Aug, with the headline reading at 49.2 (Jul: 49.5), reflecting a fall in output and new orders amid persistent weak demand. Employment rose modestly and rate of input cost inflation eased to a five-month low.
- Egypt’s net foreign assets increased to a record USD 18.5bn in Jul, driven by higher commercial bank assets (up by USD 3.28bn to USD 39.49bn), strong remittances (up to USD 26.4bn in the nine months to Mar), and GCC investment inflows. The broader Arab financing surge underscores regional confidence and opportunities in Egypt’s economy.
- Net international reserves in Egypt rose to USD 49.251bn in Aug (Jul: USD 49.036bn, end-2024: USD 47.11bn), thanks to gains from gold holdings (up 3.3% mom to USD 14.09bn) while foreign currency reserves dipped slightly (by USD 94mn to USD 35.12bn).
- Egypt’s Ministry of Planning disclosed plans to raise investments into the electricity and renewable energy sector to EGP 136.3bn in the fiscal year 2025-26, nearly double the EGP 72.6bn earmarked in the previous fiscal year: public investment accounted for around 73% of this total, with state-controlled holding companies’ share at approximately 45% of the public investment. Egypt is also accelerating its regional energy integration, targeting electricity exports to the tune of 3.9 GW by 2025-26.
- In a bid to diversify debt funding sources, Egypt plans to sell new bonds and sukuk worth over USD 4bn over the next year (to bridge the widening fiscal deficit); a new set of investors being tapped are the 1mn+ Egyptian expatriates living in the GCC.
- Kuwait’s non-oil PMI weakened slightly to a six-month low of 53.0 in Aug (Jul: 53.5), with slowing rates of expansion for output and new orders. Prices related to inputs eased to the lowest since Dec 2022 while output prices also increased at a relatively slow pace.
- Fitch Ratings affirmed Kuwait’s Long-Term Foreign-Currency Issuer Default Rating (IDR) at“AA-” with a stable outlook, reflecting the country’s robust financial and external balance sheets (sovereign net foreign assets projected to reach 607% of GDP in 2025), despite its over-dependence on oil and a large public sector. Kuwait issued bonds worth KWD 1.2bn (equivalent to 2.4% of GDP) since Jun; debt remains low at close to 3.0% of GDP.
- Lebanon’s PMI jumped to a six-month high and moved into an expansionary zone in Aug, clocking in a reading of 50.3 (Jul: 48.9), thanks to stronger output and new orders supported by domestic demand as export sales declined. Input costs were the softest since the start of the year and selling price rose at the weakest pace in a year.
- Oman and Iraq signed 24 agreements and MoUs across key sectors with an aim to deepen bilateral ties and foster long-term cooperation. One notable development was the agreement to construct a 10mn barrel crude oil storage facility in Oman’s Duqm between Oman’s state-owned energy company OQ and Iraq’s State Oil Marketing Organization.
- Oman started enforcing a new law (issued in Oct 2024) to protect bank depositors, offering compensation up to OMR 20k (approximately USD 52k) per affected customer in the event of a bank default: this will boost investor confidence. The Central Bank of Oman established a five-member board to manage the compensation fund’s assets: board can authorise investing funds in government bonds, sukuk, and other secure financial instruments.
- PMI in Qatar inched up to 51.9 in Aug (Jul: 51.4): though slightly lower than the long-run average since 2017 (52.2), the headline PMI was driven by a record increase in employment and a slower decline in new orders. On an optimistic note, the future activity sub-index increased strongly to a seven-month high and back above its long-run trend.
- Syria exported 600k barrels of heavy crude oil – its first official crude oil export shipment in 14 years – marking a significant milestone in its energy sector. Though a far cry from the 380k bpd exported in 2010, the shipment bound for Egypt underscored Syria’s efforts to revive its oil industry amidst ongoing challenges.
- Expatriates represented close to 78% of the GCC workforce in Q2 2024, with the total labour force at 24.6mn, according to the GCC Assistant Secretary General for Economic and Development Affairs.
- OPEC+ agreed to increase oil production by 137k barrels per day starting Oct 2025. This decision comes amid concerns of a possible oil glut during winter in the northern hemisphere and an anticipated slowdown in global demand.
- Data from the GCC Statistical Centre showed that GCC’s Circular Carbon Economy Index rose to 41.5 in 2024, up from 37.7 in 2023. The Performance Index, tracking deployment of emissions-mitigation technologies, rose to 35.8 (from 29.7) while the enablers index measuring readiness to transition improved to 47.2 (from 45.6).
Saudi Arabia Focus
- Saudi Arabia’s non-oil PMI moved up to 56.4 in Aug (Jul: 56.3), aided by increases in new and export orders and continued employment expansion amid slight uptick in output. Companies passed through elevated input costs via higher selling prices (which rose for the third month in a row).
- FDI inflows into Saudi Arabia increased by 24% to SAR 119.2bn (USD 31.8bn) in 2024, according to the Ministry of Investment. With FDI outflows rising to USD 10.4bn, net inflow stood at a total of USD 21.3bn – slightly down on last year, but the fifth-highest figure on record. Cumulative FDI stock nearly doubled to SAR 977.3bn (USD 260.5bn) in 2024, versus SAR 501.8bn in 2017. Manufacturing sector was the biggest single recipient of FDI, followed by wholesale and retail trade, and construction.
- Saudi Investment Minister projected a sharp ramp‑up in the relocation of regional headquarters: currently hosting 660 RHQs, it crossed the target of 500 by 2030, and the aim is for this to reach 1,000+ “within a few years”. He also disclosed that foreign companies are estimated to incest SAR 500bn in the country over the coming years.
- Saudi Aramco is preparing to issue USD‑denominated Islamic bonds (sukuk) this month, reported Reuters, with plans to raise between USD 3bn to USD 4bn – leveraging its strong balance sheet amid declining oil prices.
- About 65.4% of Saudi families own homes as of 2024, surpassing the 2025 target a year ahead of schedule. Home ownership rate has increased from 47% in 2016 and the aim has been revised upward (70% home ownership rate by 2030). However, rising urban property prices (especially in main cities such as Riyadh) highlight affordability challenges.
- Saudi Arabia and the UK announced joint investments worth GBP 360mn (USD 445mn), focused on clean energy, professional and financial services. These projects are expected to create 187 jobs across both countries (97 in the UK and 90 in Saudi Arabia) illustrating mutual gains in employment and skills transfer. Education and skills development were also prioritized, with over ten new initiatives (e.g. Cambridge University Press and Assessment plans to open an office in Riyadh).
- Japanese firms have invested about SAR 23.6bn (USD 6.28bn) into Saudi Arabia, with 18 companies setting up regional headquarters.
- Saudi Arabia raised USD 5.5bn through its first international Ijarah‑based sukuk – this was divided into two tranches of USD 2.25 (5‑year) and USD 3.25bn (10‑year). The order book reached about USD 19bn, more than 3.5 times the issued amount. For policymakers, this underscores an opportunity to deepen Islamic capital markets and attract diversified international capital via repeat issuances and structured pipelines. Saudi issued USD 20bn of bonds this year, near the 2017 record.
UAE Focus
- UAE non-oil sector PMI increased to 53.3 in Aug (from Jul’s 4-year low of 52.9), thanks to an expansion in output (fastest for six months) even as sales weakened with new orders falling to their lowest level since mid‑2021. Cost pressures are mounting, with input price inflation and wages increasing, firms passed along rising costs to the consumers and selling prices rose the quickest in 5 months and is among a series high.
- UAE real GDP grew by 3.9% yoy to AED 455bn in Q1 2025, with the non-oil sector growing at a faster pace (5.3% to AED 353bn), signalling a robust economic momentum. Contribution of non-oil sector activity to real GDP jumped to a record high of 77.3% in Q1, and the fastest growth rates can be seen in manufacturing (7.7%), finance & insurance and construction (both at 7.0%) as well as real estate (6.6%).
- The UAE central bank increased its gold holdings by 26.3% year-to-date to USD 7.9bn in Jan-May 2025, in line with global central banks moves to hedge against inflation, forex volatility and geopolitical risks.
- Non‑oil trade between the UAE and India surged by 19.7% yoy to USD 65bn in 2024, underscored by the CEPA that came into force in May 2022. Among the highlighted successful initiatives are cross-border payment integration as well as the India-UAE Start-Up Series launched to help entrepreneurs access each other’s markets among others.
- The UAE was the leading foreign investor in Morocco last year, committing USD 310mn or roughly 18.9% of Morocco’s total net FDI (up 57.8% yoy).
- Majid Al‑Futtaim, one of the leading mall operators in the UAE, reported a 23% rise in net profit excluding valuation and tax to AED 1.3bn in H1‑2025. This was despite a 1% decline in retail revenue “due to softness in its brick-and-mortar business and the ongoing impact of geopolitical tensions on consumer sentiment in certain markets”, thanks to strong performance in real estate (net revenue up 14%) and entertainment sectors (net revenue up 11%).
Media Review:
What if the AI stock market blows up?
https://www.economist.com/finance-and-economics/2025/09/07/what-if-the-ai-stockmarket-blows-up
France’s curse and Bayrou’s political suicide: FT
https://www.ft.com/content/e8c48c32-ae34-4a12-92a6-63b6596a16a1
Uncertainty about Uncertainty: IMF F&D
https://www.imf.org/en/Publications/fandd/issues/2025/09/uncertainty-about-uncertainty-nicholas-bloom
Powered by:
![]()