

Download a PDF copy of the weekly economic commentary here.
Markets
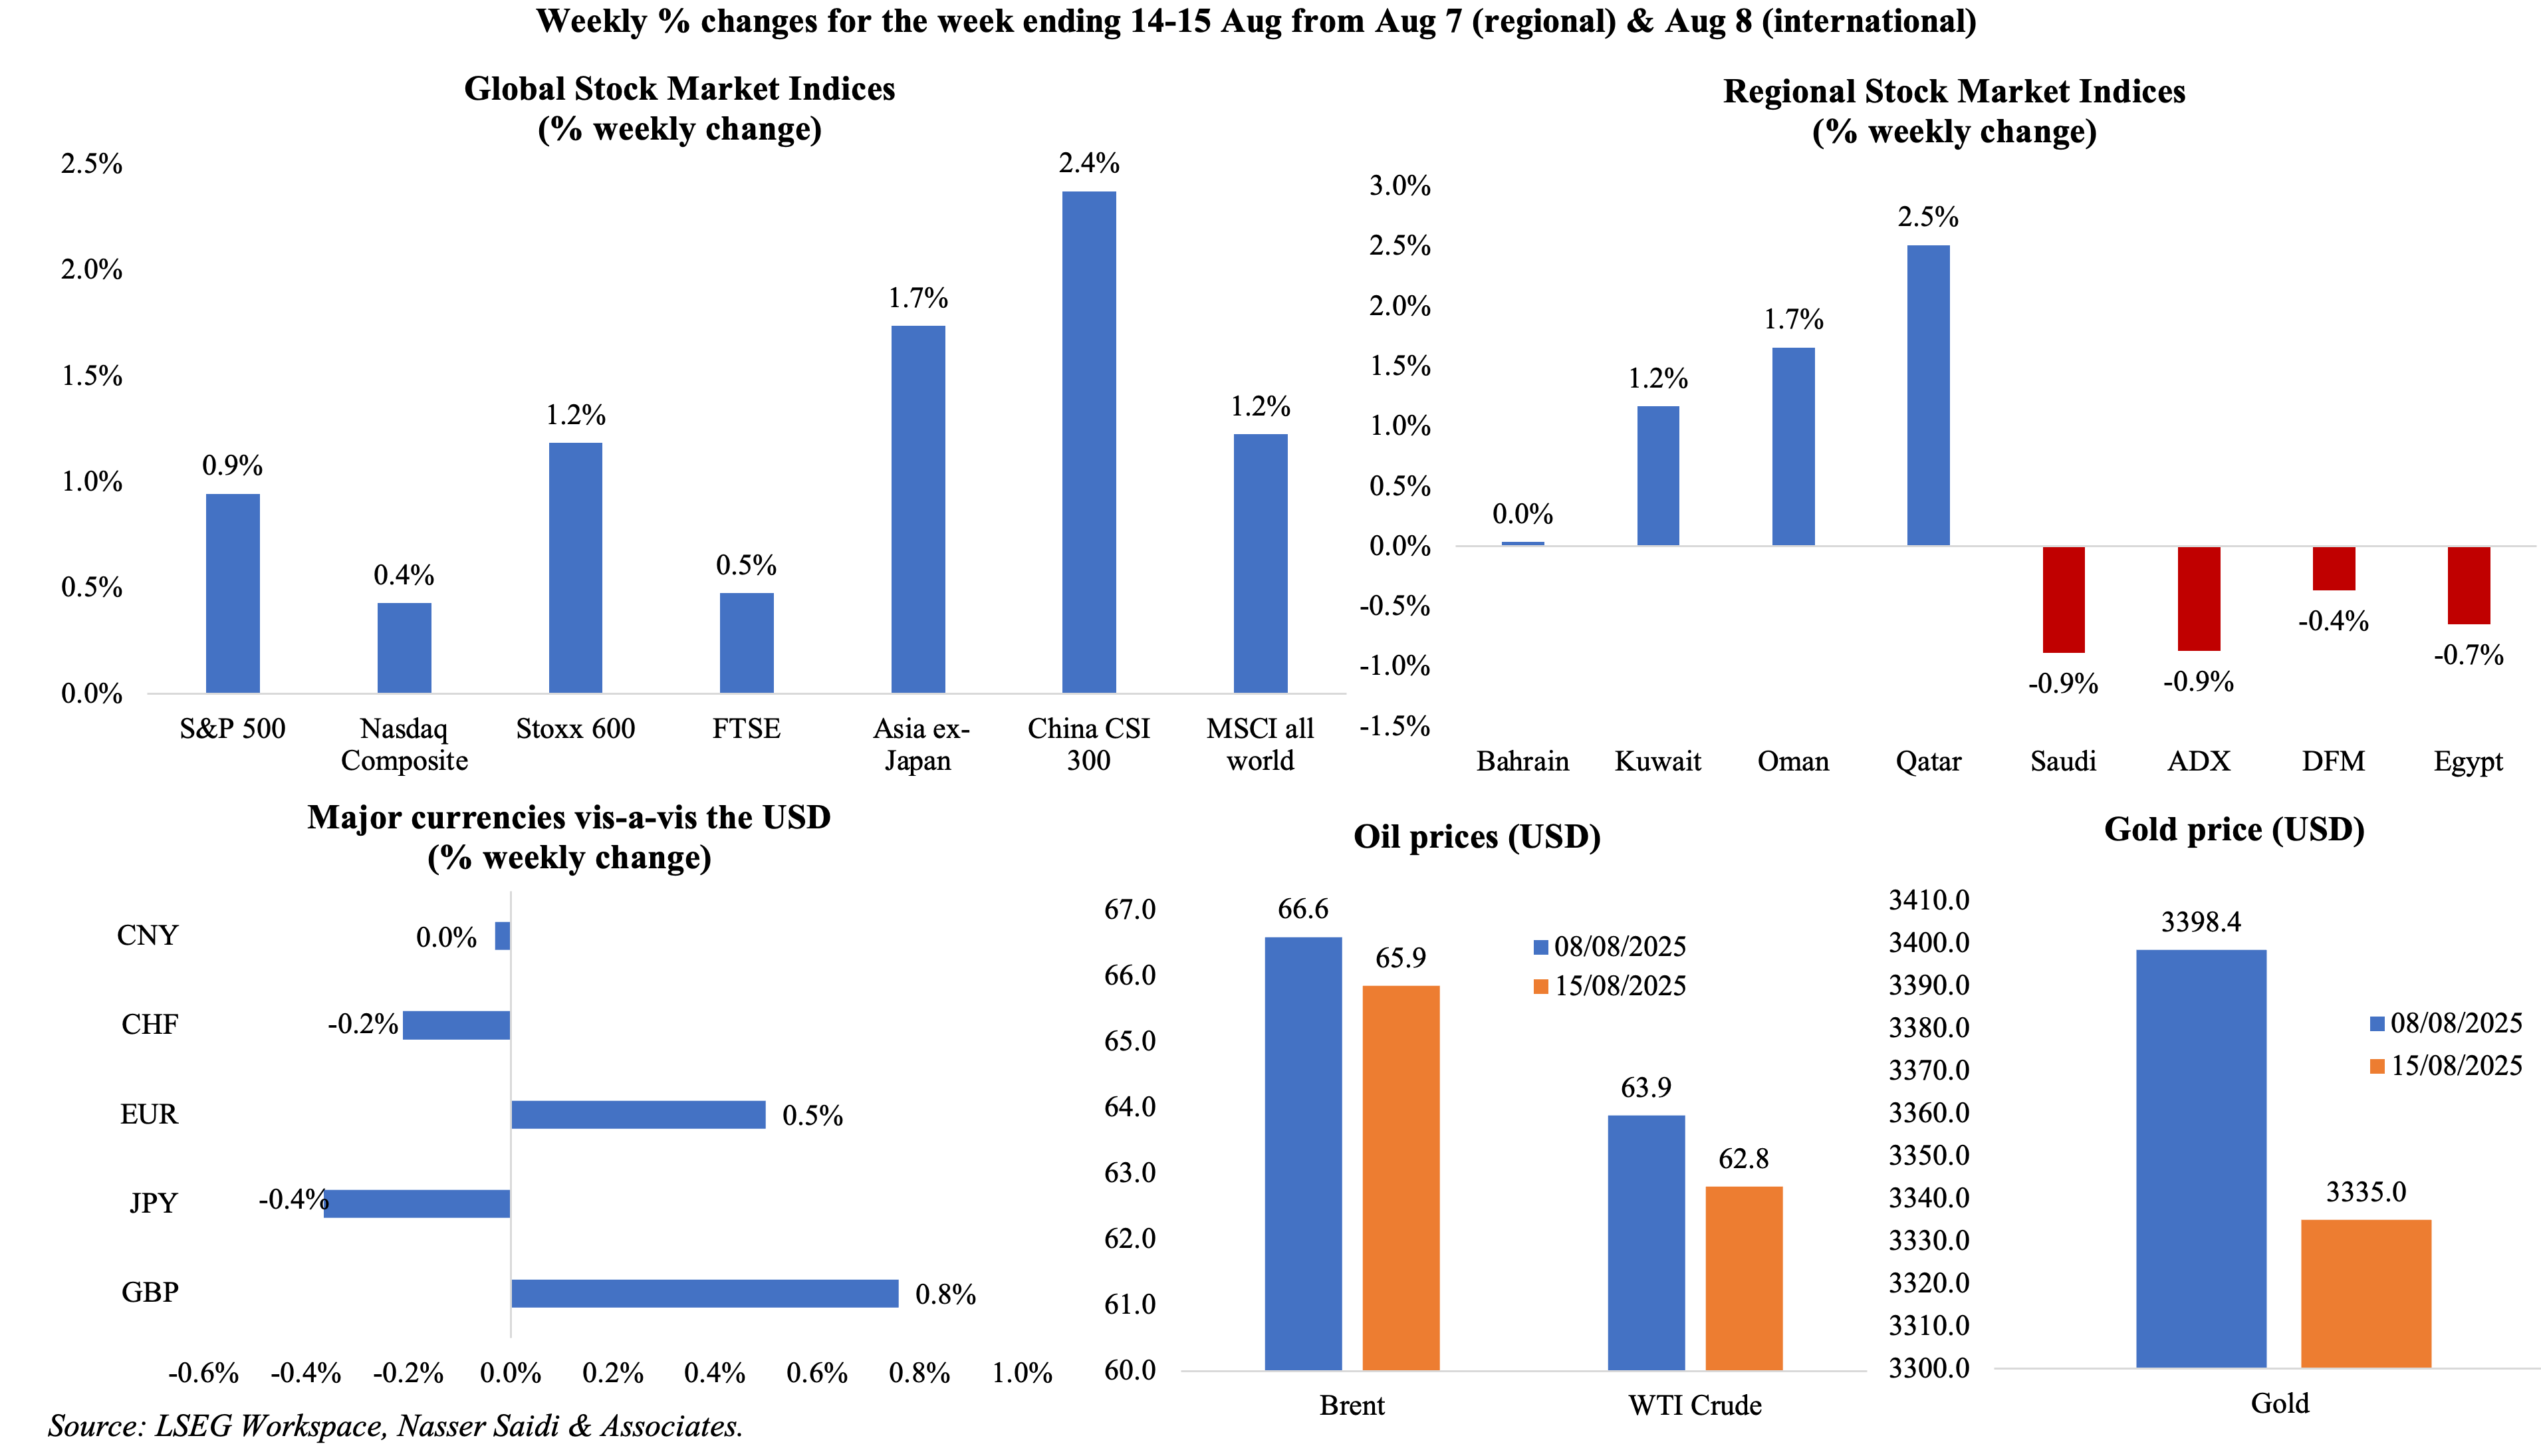
Global equities markets had a good week – stocks are hovering near record-highs, the China-US tariff pause was extended, supporting Chinese & Asian equities markets and the US inflation holding steady in Jul renewed hopes for a Fed rate cut. Regional markets were mixed, with Egypt falling from recent record highs, while UAE and Saudi markets were relatively more sluggish amid pressure from oil markets. The dollar weakened slightly vis-a-vis major peers, including the yen and Swiss franc, while the euro strengthened modestly. Crude oil prices declined on hopes potential sanctions relief and of reduced US-Russia tensions (neither of which materialised during Friday’s meeting between Presidents Trump and Putin). Gold prices stayed above USD 3300+, buoyed by safe‑haven demand as markets awaited geopolitical developments.
Global Developments
US/Americas:
- Last week, China and US agreed to extend the pause on tariffs for another 90 days. Separately, a planned visit by US trade negotiators to India from August 25-29 was called off and will be rescheduled to another date (not yet decided). This is important given that the additional 25% secondary sanctions on India are scheduled to be imposed on Aug 27: this was imposed citing India’s purchases of Russian oil for direct consumption (vs China’s purchase for refining purposes or Europe’s buying of natural gas).
- Inflation in the US held steady at 2.7% yoy in Jul, as overall food prices ticked up (2.9%), as did prices of used cars (4.8% from 2.8% in Jun), medical care (4.3%), housing (3.7%) and food away from home (3.9%). The 1.6% drop in energy prices helped stabilise the overall pace. Core inflation inched up to a 5-month high of 3.1% from 2.9% the month before – signals that underlying price dynamics are still robust, particularly in housing and healthcare.
- Producer price index in the US increased 0.9% mom (the largest uptick since Jun 2022) and 3.3% yoy in Jul (Jun: 2.4% yoy) with large upticks in services’ inflation (1.1% in Jul, largest gain since Mar 2022) and trade services margins (+2%). Excluding food and energy, prices accelerated to 3.7% (Jun: 2.6%), underscoring rising chances of pass-through effects to consumer prices in the coming months. Looking ahead, the substantial rise in PPI will keep the Fed cautious, and rate cuts seem unlikely before a sustained cooling trend emerges.
- US industrial production fell by 0.1% mom in Jul (Jun: 0.4%), with manufacturing up by a marginal 0.1% and index for mining down 0.4%. Capacity utilisation eased to 77.5% (from 77.7%). Evidence of cooling activity: forward-looking indicators indicate subdued industrial growth unless global demand and/or domestic investment accelerates meaningfully.
- Monthly budget in the US returned to a deficit of USD 291bn in Jul (Jun: USD 27bn surplus), as spending (10% to a record USD 630bn) was much higher than revenues (+2% to USD 338bn) and despite the rise in gross customs receipts (USD 28bn). Absent meaningful fiscal consolidation, long-term debt sustainability concerns remain, spooking US debt markets.
- NFIB business optimism index inched up to 100.3 in Jul (Jun: 98.6). About 21% of small business owners reported labour quality as the single most important problem, up 5 points.
- NY Empire State manufacturing index jumped to 11.9 in Aug (Jul: 5.5), with increases in new orders (15.4 from 2.0) and shipments (12.2 from 11.5). Input cost pressures remained high (54.1 vs 56.0) alongside a slight easing of selling prices (22.9 vs 25.7).
- Michigan consumer sentiment index declined to 58.6 in Aug (Jul: 61.7), with current conditions lower (60.9 from 68) and a fall in the expectations gauge (57.2 from 61.7). Inflation expectations for the one- and five-year ahead increased in Aug, to 4.9% and 3.9% respectively (Jul: 4.5% and 3.4%): these are below the recent highs seen in Apr-May. Unless inflation perceptions improve and real income gains accelerate, consumer confidence may remain fragile heading into Q4.
- US retail sales grew by 0.5% mom and 3.9% yoy in Jul (Jun: 0.9% mom and 4.4% yoy) on higher demand for motor vehicles (1.6% mom) and furnishings (1.4% mom) alongside widespread promotions and discounts.
- Initial jobless claims in the US declined by 3k to 224k in the week ended Aug 9 and the 4-week average inched up by 1k to 221.75k. Continuing jobless claims slipped to 1.953mn in the week ended Aug 2, and up from 1.968mn the week prior. Labour market indicators remain strong.
Europe:
- GDP in the euro area grew by 0.1% qoq and 1.4% yoy in Q2 (Q1: 0.6%), according to the flash estimate. Larger economies such as Germany and Italy saw declines of 0.1%, reflecting weak domestic demand and stagnant investment amid rising geopolitical uncertainties, while Ireland shrank the most (-1.0%).
- Industrial production in the euro area declined by 1.3% mom in Jun (prev: +1.1%), with production rising for energy (2.9%) alongside declines in capital goods (-2.2%) as well as durable (-0.6%) and non-durable consumer goods (-4.7%). In yoy terms, IP growth eased to 0.2% from 3.1% the month before.
- The ZEW economic sentiment index for Germany plunged to 34.7 in Aug (Jul: 52.7) reflecting heightened concerns over sluggish growth, as well as the disappointment from the announced EU-US trade deal. The worsening current situation (-68.6 from -59.5) reinforces that the downturn is not just expected, but already materializing. The EU economic sentiment index fell by 11 points to 25.1 while the current situation deteriorated (-7.0 points to -31.2).
- Current account surplus in Germany widened to EUR 18.6bn in Jun (May: EUR 7.5bn). The primary income account moved to a surplus EUR 15.2bn, following a EUR 1.2bn deficit.
- GDP in the UK grew by 0.3% qoq and 1.2% yoy in Q2 (Q1: 0.7% qoq and 1.3% yoy), led by an expanding services sector (0.4%) and rising construction output (1.2%). Industrial production and manufacturing rebounded by 0.7% mom and 0.5% (prev: -1.3% and -1%). For the Bank of England, this mixed picture complicates the case for near-term rate cuts.
- UK like-for-like retail sales grew by 1.8% yoy in Jul (Jun: 2.7%), with food sales grew by 3.9% and non-food sales increased by 1.4%.
- Average earnings including (excluding) bonus in the UK grew by 4.6% (5.0%) yoy in the three months to Jun. Annual growth in real terms at 1.5% for regular pay and 1.1% for total pay (i.e. including bonuses). Unemployment rate held steady at 4.7%: data showed that job losses was concentrated most in the retail and hospitality sector.
Asia Pacific:
- China’s money supply grew by 8.8% yoy in Jul (Jun: 8.3%). New loans unexpectedly plunged in Jul, contracting for the first time since Jul 2005 (-CNY 50bn): the total for the period Jan-Jul totalled CNY 12.87trn. Total social financing grew by 9% yoy (quickest since Feb 2024) to CNY 431.26trn in Jul.
- The slew of Chinese macro data highlights weak demand at home. Industrial production grew by 5.7% yoy in Jul(Jun: 6.8%), an 8-month low. Retail sales increased by 3.7% (Jun: 4.8%) pointing to fragile consumer demand. Fixed asset investment grew by 1.6% in Jan-Jul, slowing from H1’s 2.8% increase. Unless confidence improves and policy becomes more targeted, weak domestic demand and external softness could lead to further deceleration.
- GDP in Japan grew 1.0% on an annualised basis in Q2 (Q1: 0.6%, revised upwards from a 0.2 drop); it was up by 0.3% qoq, supported by strong exports (2.0%), private consumption (0.2%) and capital spending (1.3%). Japan’s medium-term growth outlook remains constrained unless domestic demand picks up (in Q2, it dipped by 0.1%).
- Industrial production in Japan grew by 2.1% mom in Jun (flash: 1.7% mom; May: -0.1%) driven by gains in transport equipment excluding motor vehicles (16.9% vs -19.2% in May) as well as electronic parts and devices (8.8% vs -14.8%). In yoy terms, IP rebounded, rising 4.4% – the largest gain since Sep 2022.
- India’s trade deficit widened to an 8-month high of USD 27.35bn in Jul (Jun: USD 18.78bn), as exports and imports grew by 7.3% and 8.6% respectively. Exports to the US since the start of the fiscal year in Apr grew by 22% yoy while exports to China grew by a slightly slower 20%. With a 50% tariff expected to come into effect later this month, India’s trade position will be closely monitored.
- Consumer price inflation in India eased for the ninth month in a row to 1.55% yoy in Jul (Jun: 2.1%). This reading, on the back of falling food prices (-1.76% from Jun’s -1.01%), was the lowest since Jun 2017 and was also this was the first time since 2019 that inflation fell below the RBI’s tolerance band of 2% to 6%. Wholesale price inflation fell for the second month in a row by 0.58% yoy in Jul (Jun: -0.13%), the sharpest decline since Jul 2023, as food prices plunged by 2.15% (the most since Aug 2015).
- Singapore GDP grew by 1.4% qoq and 4.4% yoy in Q2 (Q1: -0.5% qoq and 4.1% yoy), benefiting from a pick-up in services (4.3% from Q1’s 3.8%) and manufacturing (5.2% from 4.7%). Thanks to the better H1 2025 performance (4.3% this year), the trade ministry upgraded its GDP growth forecast for 2025 to 1.5% to 2.5% from 0.0% to 2.0% before.
Bottom line: The much-touted Trump-Putin meeting, was a non-meeting, resulting in massive disappointment, after reaching no agreement, no ceasefire and no semblance of a roadmap. President Trump, after the meeting, stated that “the best way to end the horrific war between Russia and Ukraine is to go directly to a Peace Agreement” (with no mention of a ceasefire any longer). Ukraine’s President Zelensky is meeting with Trump today, along with a European leaders’ delegation in a bid to understand what is being offered as “robust security guarantees” to reach a truce. Central bankers’ Jackson Hole meetings are also underway now, in the backdrop of near-record level stocks and questions of a will-or-won’t the Fed cut interest rates at the next meeting. Any hint from the Fed Chair has the potential to move markets during a relatively lull time; the jump in latest PPI and continued above desired inflation rates is likely to keep the Fed geared towards the “cautious” spectrum.
Regional Developments
- Real GDP in Bahrain grew by 2.7% in Q1 2025, supported by a 5.3% gain in oil sector activity (rebounding from Q4’s 3.4% drop). The non-oil sector contributed 84.8% to real GDP in Q1 and grew by 2.2% (slower than Q4’s 4.6% gain). Among the non-oil non-govt sector, hotels and restaurants recorded the highest growth: 10.3% yoy vs 6.1% in Q4. Financial & insurance activities grew by 7.5% in Q1, rising from 4.8% in Q4: the sector also contributed most to real GDP (17.4%), followed closely by crude petroleum & natural gas (15.2%) and manufacturing (14.4%).
- Bahrain’s total inward FDI stock grew by 3.5% yoy to BHD 17.1bn in Q1 2025. Financial and insurance activities accounted for close to two-thirds of Bahrain’s inward FDI stock (64.2%), followed by manufacturing (13.4%); by country of origin of investment, Kuwait, Saudi Arabia and the UAE topped the list – each with a share of 35.0%, 22.1% and 9.8% respectively of total FDI stock.
- Egypt inflation clocked lower at 13.9% yoy in Jul (Jun: 14.9%), driven by higher fuel prices and lower food prices (3.4%, the lowest since Jun 2021). Core inflation inched up to 11.6% (from 11.4%). The Central Bank of Egypt expects inflation to stabilise near current levels through 2025 before falling toward its 7% (±2%) target by end-2026. Latest projections are 15–16% for 2025 and 11–12% for 2026, down sharply from the 28.3% peak in 2024.
- Egypt and Jordan inked 10 cooperation agreements and MoUs covering investment, free zones, scientific cooperation and heritage protection among others. The countries also reiterated their commitment to boosting electricity interconnection capacity, underscoring the importance of infrastructure integration.
- Structural changes: Egypt plans to commission four additional public free zones by mid-2026, expanding its nine existing zones (that have reached a 95% occupancy rate) to support export growth and foreign investment. These zones will be strategically located and will be entirely export-oriented, supporting the target of USD 140bn in exports by 2030.
- Iraq recorded a fiscal surplus of approximately USD 4.5bn in H1 2025, reversing the USD deficit posted in 2024, largely due to higher oil output aligned with OPEC+ quotas; revenues totalled IQD 62.4trn (of which IQD 57trn was from oil exports) and spending IQD 56.6trn (with current expenditures accounting for almost 70% of spending). This turnaround enhances short-term fiscal stability and will support social and wage commitments ahead of parliamentary elections (scheduled for Nov 11th), yet underscores the fragility posed by over-dependence on oil prices.
- Kuwait’s government awarded a USD 3.3bn contract to develop the North Al-Zour gas-fired combined-cycle power and desalination plant. Granted to a consortium of ACWA Power and Gulf Investment Corporation, this marks Kuwait’s first privately-owned facility of this scale, and it looks set to become operational by mid-2028. Separately, Kuwait is seeking private-sector investors for its Umm Al-Hayman wastewater treatment plant (designed to serve nearly 1.7mn people) – this would be one of the Middle East’s largest utility PPPs.
- Kuwait currently provides 90-day tourist visas on arrival to any foreign national with at least six months of a valid GCC residency, replacing a selective, profession‑based system from 2008. This aims to boost intraregional tourism, facilitate mobility, and support the country’s economic diversification goals.
- UAE-style CEPAs are catching fire: India and Oman have officially concluded negotiations for a Comprehensive Economic Partnership Agreement (CEPA), according to India’s Minister of State for Commerce and Industry, though no signing date has been specified yet.
- Oman issued new development bonds worth OMR 75mn (USD 195mn) with a five‑year maturity and a 4.35% annual coupon rate; a green‑shoe option allows issuance up to OMR 15mn more. The bonds, open to both resident and non‑resident investors, can be held as collateral or traded on the Muscat Stock Exchange, thereby enhancing liquidity and broadening investor participation.
- Oman reported a 7.5% yoy drop in inbound tourists to 1.8mn in H1 2025, with majority of the visitors coming from the GCC (36% of the total) while Europe and Asia & Oceania nations were also significant (at 22% and 30% respectively). UAE accounted for more than three-fourths of visitors from GCC, while Germany and UK were the top source nations from Europe (17.2% and 12.4% of visitors from Europe). The revenues for Oman’s three‑ to five‑star hotels rose by 18% year‑on‑year to OMR 141 million (~US $367 million) by June 2025, supported by a 9% increase in guest arrivals to 1.1 million
- Oman’s Salalah Free Zone secured OMR 187mn in new investments during H1 2025, lifting cumulative capital inflows to OMR 4.9 billion (~US $12.7 billion).
- Oman’s Ministry of Energy and Minerals signed three new exploration and industrial development agreements worth USD 500mn with local firms, covering copper, chromite, salt, sodium carbonate, and hydrated lime production across key governorates.
- Bilateral trade between the UK and Oman declined by 4.6% yoy to GBP 1.6bn (OMR 784mn) in Q1 2025, given a 9.9% drop in UK exports to Oman (particularly a 17.5% fall in goods exports). Imports from Oman meanwhile rose 12%, resulting in a narrower trade surplus with Oman – to GBP 680mn from GBP 852mn from the same period a year ago.
- Tourists into Qatar grew by 3.4% yoyto 2.953mn tourists in Jan-Jul, with visitors from the GCC accounting for 36% of the total, and with Europe and Asia & Oceania accounting for 25% and 22% respectively. Hotel supply increased – there were 41,463 room keys by end-July and full market occupancy was around 69.34% across the year (highest on record).
- Qatar clocked in a low unemployment rate of 0.1% in Q2 2024, much lower than its GCC peers, according to a GCC-Stat report and data. There were 2.2mn expats in Qatar, accounting for 8.9% of regional expatriate workforce.
- Qatar leapt to rank 12th in the Global FDI Performance Index, up 21 places from the previous year, as the country nearly doubling its greenfield FDI project count in 2024.
- IPOs in MENA generated USD 2.5bn from 14 listings in Q2 2025, according to EY’s MENA IPO Eye report. Saudi alone accounted for 76% of the region’s IPO proceeds, with 13 of the 14 listings in the quarter including Flynas (44% of the quarter’s total).
Saudi Arabia Focus

- Saudi Aramco signed a USD 11bn lease and leaseback deal with a BlackRock-led consortium (Global Infrastructure Partners) for midstream assets of the Jafurah gas field, forming a new subsidiary Jafurah Midstream Gas Co. (with Aramco retaining 51% control). Jafurah is estimated to contain 229trn standard cubic feet of raw gas and 75bn Stock Tank Barrels of condensate and is critical to Aramco’s aim to become a global player in natural gas and boost gas production capacity.
- Consumer price inflation in Saudi Arabia edged down to 2.14% in Jul(Jun: 2.3%): as housing & utilities costs eased (5.6% vs 6.5%) as did prices at restaurants & hotels (1.44% from 1.64%) while prices inched up for food & beverages (1.62% from 1.53%), and recreation & culture (0.74% from -0.05%). Rental costs slowed (6.6% from 7.6%). Five major categories (of out 12) clocked in deflationary readings. CPI averaged 2.17% in Jan-Jul 2025 vs 1.6% in the same period in 2024, with the increase stemming from food & beverages (1.55% from 0.99%).
- Wholesale prices in Saudi Arabia held steady at 2.1% in Jul; agriculture & fishery prices inched up slightly (4.43% from 4.38%) as did food products (0.34% from 0.21%); deflation continued in ores & minerals though the pace slowed (-0.85% vs -1.13%). Average wholesale prices almost halved to 1.74% in Jan-Jul 2025 (vs Jan-Jul 2024: 3.43%), as prices of “other transportable goods” plunged (3.6% vs 8.5%) while costs of agriculture & fishery increased substantially (4.25% from -0.18%).
- Saudi Arabia attracted 616 regional headquarters of global firms by Q1 2025, up from 571 in Q4 2024, according to the minister of media.
- Saudi Arabia’s Public Investment Fund (PIF) assets under management grew by 19% yoy to USD 913bn by end‑2024, with its average portfolio return at 7.2% since 2017. The fund reported a 25% increase in revenue, deployed capital worth USD 56.8bn across priority sectors in 2024 (to a total of over USD 171bn since 2021) and took a USD 8bn write‑down on its giga‑projects, reducing valuation to SAR 211bn (or USD 56.23bn vs 2023’s SAR 241bn). PIF reduced its US-listed equity exposure by nearly USD 2bn in Q2 2025 (from tech firms like Meta, Shopify, and PayPal) bringing total US holdings down to USD 24bn by June 30.
- Saudi EXIM Bank credit facilities expanded by 44% yoy to SAR 23.6bn (USD 6.29bn) in H1 2025, alongside an acceleration in export financing and insurance coverage by 26% and nearly 59% respectively. This will support the country’s target to raise industrial exports to SAR 557bn by 2030 under the National Industrial Strategy.
- Saudi Arabia’s mining sector surged to 23rd place globally in the Fraser Institute’s Investment Attractiveness Index, up from 104th in 2013, reflective of the country’s improvement in “clarity and effectiveness of mining administration”, “clarity of land use for mining activities reflecting effective and stable regulatory environment reforms” and “improvement in labour regulations”. Saudi also advanced in policy perception (20th from 82nd) and mineral potential (24th from 58th).
- Saudi nationals younger than 35 accounted for 69.4% of the population, as per data from GaStat, with a nearly equal gender distribution (50.3% male and 49.7% female). The report revealed an average age of roughly 26.6 and a median age at 23.5 years: this will have a significant impact on labour market dynamics in the future as well as public service demand.
UAE Focus

- Dubai’s GDP grew by 4% yoy to AED 119.7bn in Q1 2025, driven by robust expansion across key sectors such as human health and social work (+26% to AED 1.9bn), real estate (+7.8%), and finance and insurance (+5.9%). The wholesale & retail trade sector contributed 23% to the economy while finance & insurance, transport & storage and real estate sectors contribution stood at 13.4%, 13% and 7.5% respectively.
- UAE’s Federal Tax Authority (FTA) collected AED 357.2mn in taxes and fines in H1 2025, up 86.3% yoy, by undertaking 85,500 field inspections (+110.7%). Seizures of non‑compliant excise goods such as 11.52mn tobacco packs lacking Digital Tax stamps and 6.1mn other goods including beverage units surged by 108.7% and over 250% respectively, signalling a crackdown on illicit goods and stronger regulatory enforcement.
- The Abu Dhabi Chamber of Commerce and Industry revealed that certificates of origin increased by 10.3% yoy as of Jun 2025. The emirate’s non-oil foreign trade expanded by 34.7% yoy in H1 2025 with non-oil exports and re-exports up by 64% and 35% respectively.
- Air Arabia posted a 3% yoy decline in net profit to AED 415mn in Q2 2025 after regional conflicts disrupted flights, and despite a 15% rise in passenger traffic (to 5mn+) and an 85% average load factor. Nevertheless, H1 results remained strong: net profit rose 11% to AED 770mn, buoyed by broader network expansion (200 routes from its six operating hubs).
- DP World revenues jumped by 20.4% yoy to USD 11.24bn in H1 2025 despite trade uncertainty, raising net profit by 68.5% to USD 960mn, boosted by rising container volumes and logistics integration even amid regional geopolitical instability. The firm invested USD 1.08bn in H1 toward capacity expansion across key markets and is expected to meet its 2025 capex target of USD 2.5bn.
- Dubai’s real estate sector recorded 4,049 new activities in H1 2025, reflecting a buoyant market environment underpinned by population growth, infrastructure development, and digitized regulatory services via the “Trakheesi” platform. Brokerage services – both for sales (2,301 activities) and leasing (1,279 activities) – dominated.
- Knight Frank reported that UAE office transaction volumes surged in H1 2025, with high-value office sales in Dubai spiking 207% and Abu Dhabi leasing demand more than doubling. Grade A vacancies are at historic lows, driving rents higher in premium locations, according to the firm. A Cavendish Maxwell report disclosed that 34k sqm of new Dubai office space was delivered in H1, with another 110k sqm predicted by end-2025 and 340k sqm in 2026.
- Abu Dhabi’s Emirates Water and Electricity Company launched an RFP for a 3.3 GW carbon-capture-ready combined cycle gas turbine plant at the Al Nouf complex: the plant is slated to commence operations in Q3 2029 under an independent power producer model.
Media Review:
Dubai developers bring construction in-house as demand surges
https://www.reuters.com/world/middle-east/dubai-developers-bring-construction-in-house-demand-surges-2025-08-13/
The nightmare of a Trump-Putin pact isn’t over
https://www.economist.com/leaders/2025/08/16/the-nightmare-of-a-trump-putin-pact-isnt-over
Litigation funders target Gulf disputes as claims surge
https://www.agbi.com/analysis/law/2025/08/litigation-funders-target-gulf-disputes-as-claims-surge/
Powered by:
![]()