Weekly Insights 8 Jun 2024: GCC PMIs stable. Egypt signs of recovery. Lebanon continues contracting. Sustained rise in shipping rates to herald inflation?
1. GCC PMIs stabilise; contractionary readings continue in Egypt & Lebanon, but the recovery signals are strong in the former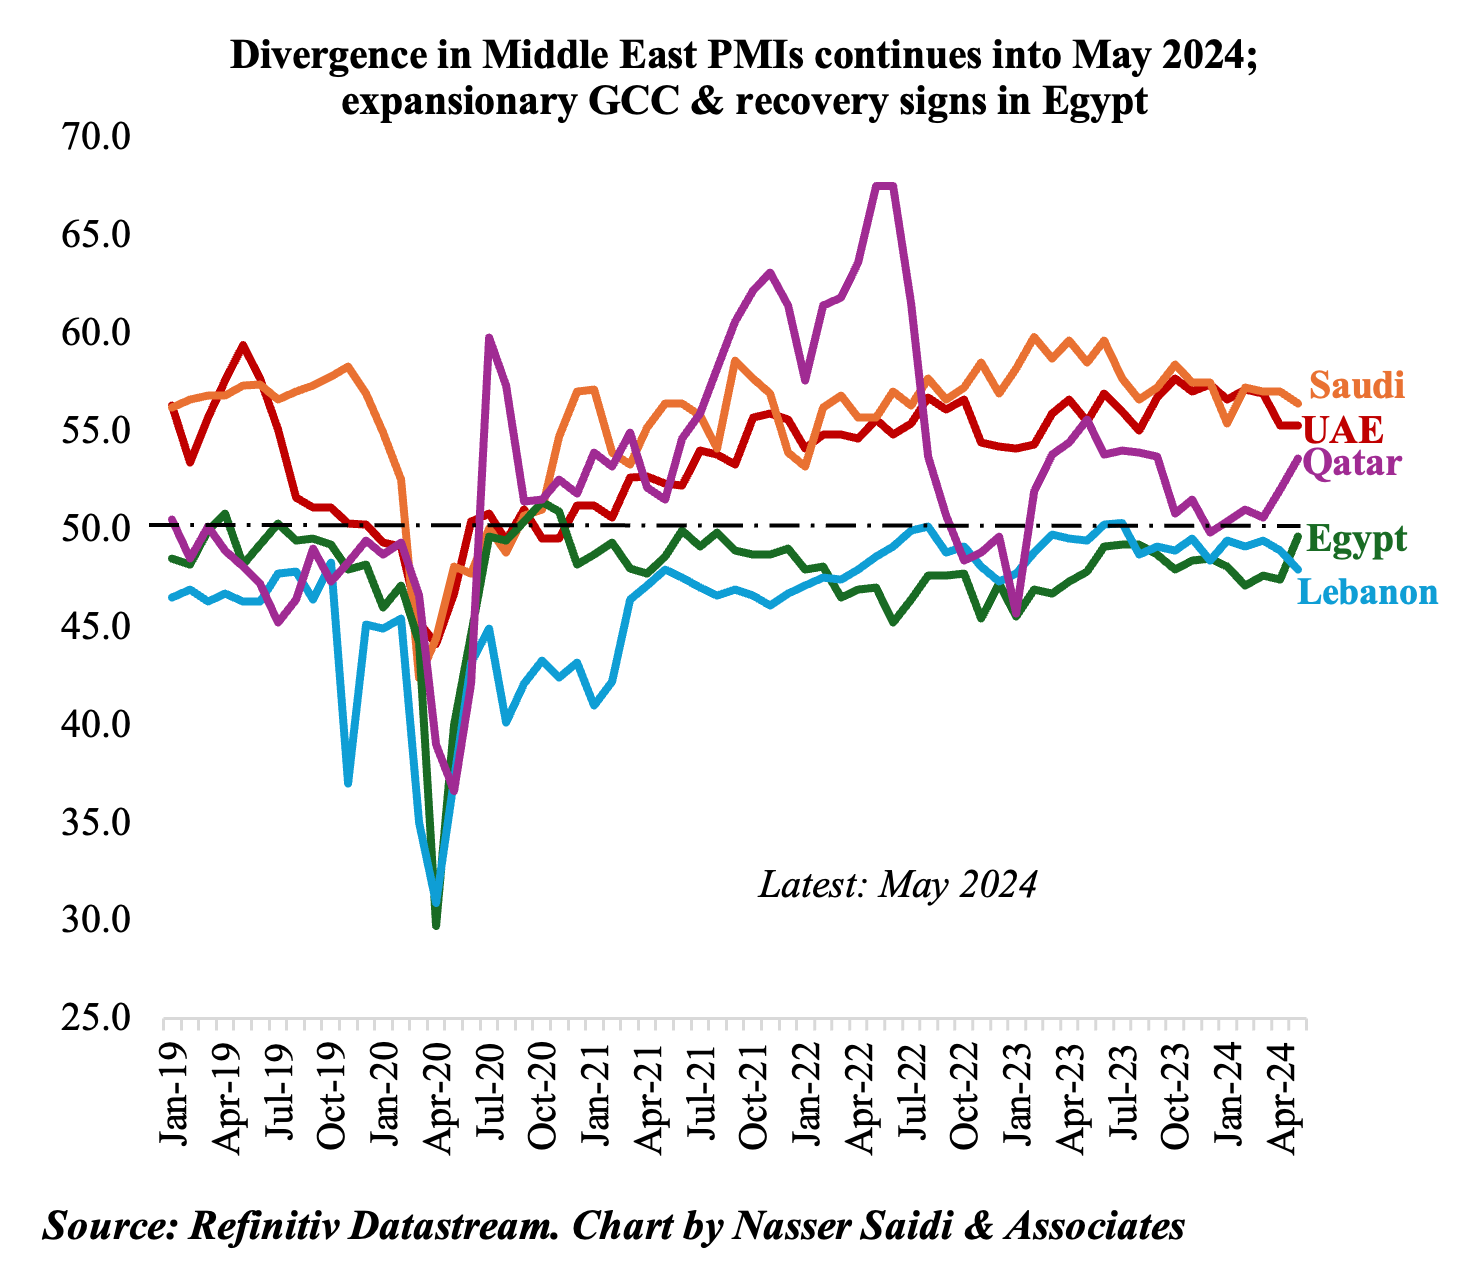
- GCC’s PMIs for May were all expansionary. It increased in Qatar (53.6 from 52 in Apr) and Kuwait (52.4 from 51.5), remained steady in UAE (an 8-month low of 55.3) and inched down in Saudi Arabia (at a high 56.4, from 57).
- In contrast, PMI readings for Egypt and Lebanon remained below-50. Egypt’s reading however rose to 49.6 (Apr: 47.4), the highest reading since Aug 2021.
- Qatar’s PMI uptick in May was above the long-run trend level (of 52.3, since Apr 2017). Kuwait, which started reporting PMI recently, posted a 4-year high reading of 52.4 (Apr: 51.5) on record-high new orders (most since reporting began in Sep 2018).
- New orders expanded in Saudi & UAE, but the pace was slowest in 2 years in Saudi (supported by domestic orders) while in UAE it was the second-weakest since Aug 2023.
- UAE’s demand is recovering post the flood disruptions; but, input costs were the highest since Jul 2022 (on higher wages & fuel costs).
- Egypt posted its 42nd consecutive month of contractionary readings, but there are signs of optimism & recovery. Demand increased as prices stabilised and currency availability improved. Services and construction activity picked up and new orders fell at the slowest pace since Sep 2021. Input cost inflation slowed to a 38-month low though rising wages were still cited as a constraint.
- Lebanon’s PMI however slipped further to a 16-month low of 47.9 in May (from 48.9). Domestic and overseas demand fell on escalating tensions. Supply issues continue to affect businesses and both output and input prices rose. While tourism is expected to prop up activity come summer, businesses were pessimistic about the 12-month outlook.
2. Qatar’s economic activity is driven by robust services sector growth (hospitality & logistics); inflation low in Apr amid some relatively higher non-tradeable costs
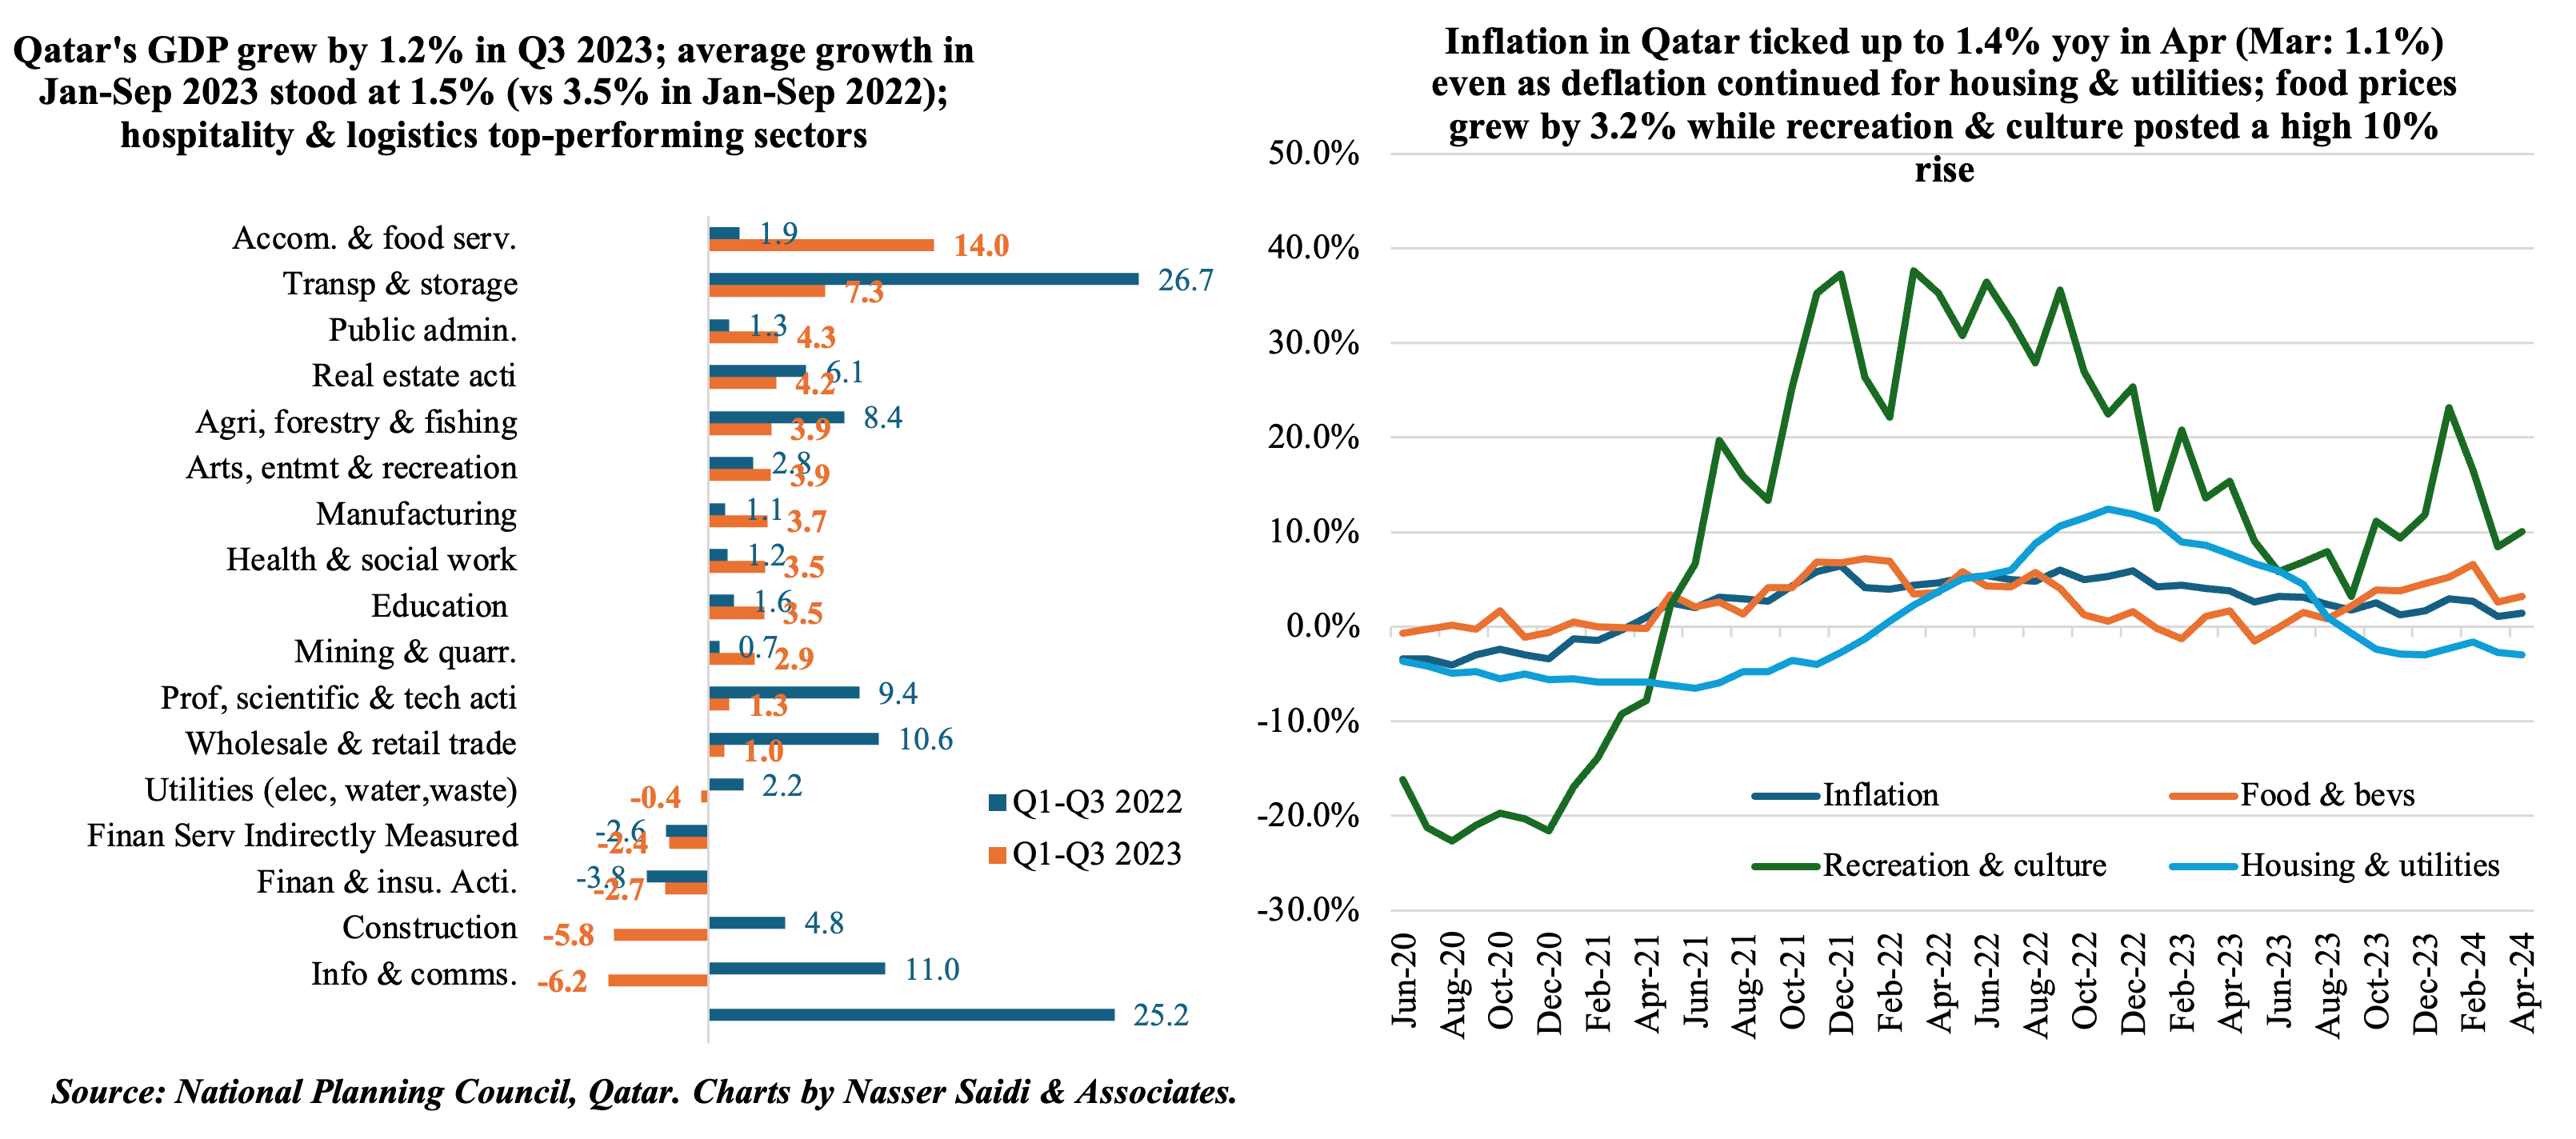
- Qatar GDP grew by 1.2% in Q3 2023, at the same pace as in Q2, with accommodation & food services activities and transportation & storage growing at the fastest pace (of 13% and 7.1% respectively). These two sectors were also the top performers when considering growth during the Jan-Sep 2023 period. Mining and quarrying grew by 2.3% in Q3 and by 2.9% in Jan-Sep 2023.
- In its most recent statement, the IMF forecast Qatar GDP to grow by 1.75% in 2024-25, supported by strong public sector investments, tourism and expansion of LNG projects.
- Inflation in Qatar inched up to 1.4% yoy in Apr (Mar: 1.1%). Food prices ticked up (3.2% from 2.6%) as did recreation costs (10% from 8.5%) while transport costs rebounded (1.2% From -0.9%). Housing & utilities and restaurants & hotels continued in deflationary territory (at -2.9% and -1.3% respectively).
3. Qatar’s deposits surged in Apr; about 2mn+ tourists enter Qatar in Jan-Apr, with visitors from GCC the largest share
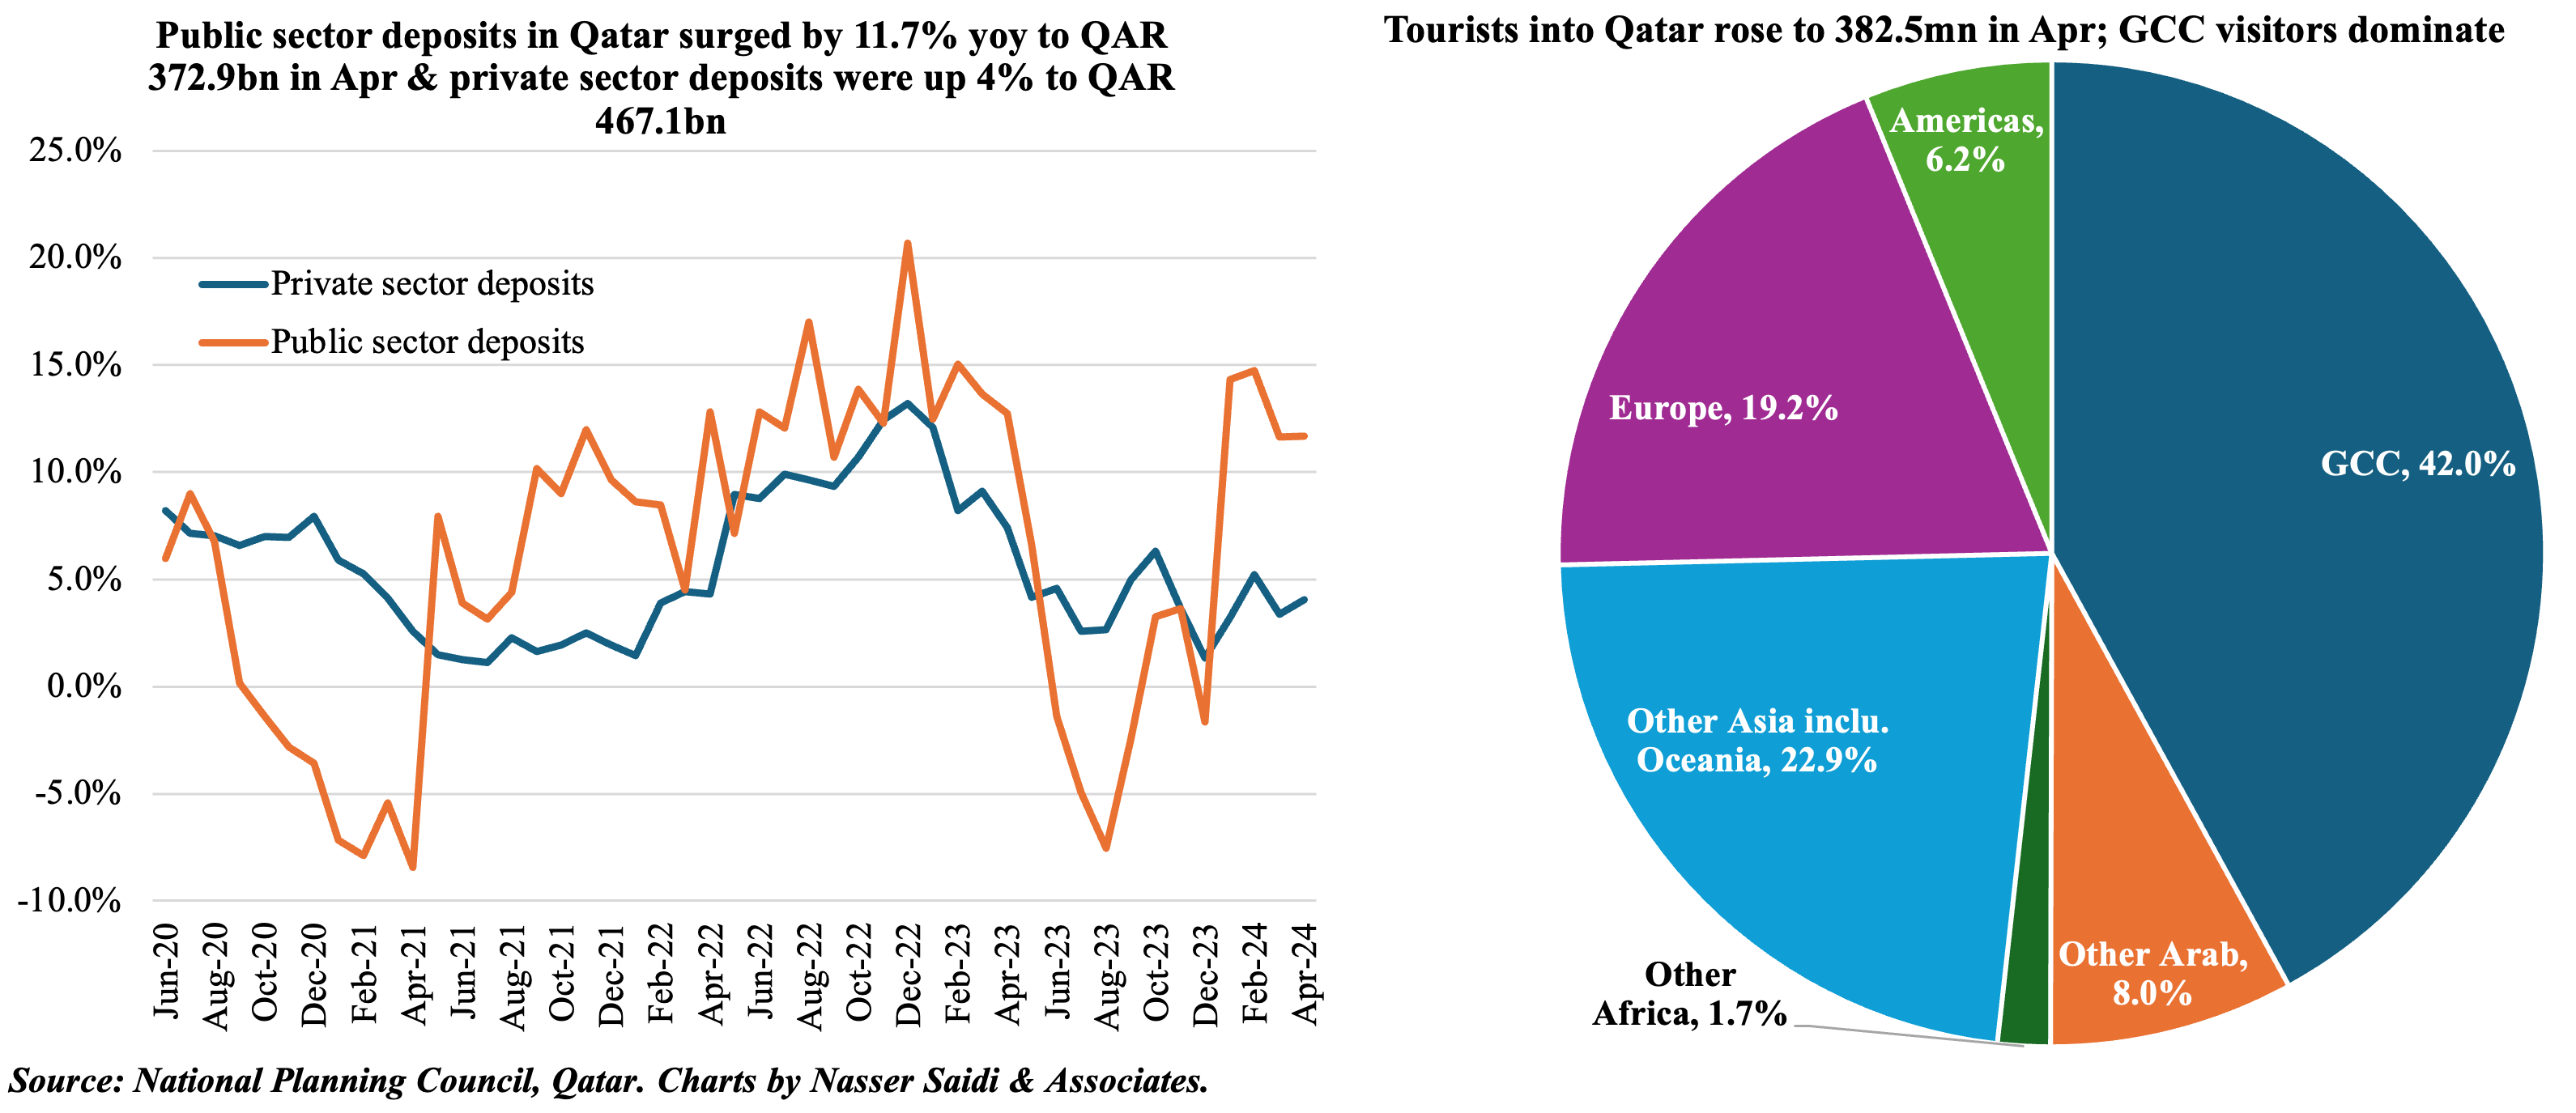
- Latest monetary statistics data released by the National Planning Council showed a 6.3% increase in commercial bank deposits in Qatar, driven by public sector deposits (+11.7% yoy and 0.9% mom to QAR 372.9bn); private sector deposits edged down slightly in month-on-month terms (but was up 4% yoy). Money supply growth remained healthy: M2 and M3 were up by 5.7% and 7.2% respectively.
- Credit growth was up by just 4.9% yoy in Apr, with claims to the private and public sectors up by 5.1% (to QAR 867.2bn) and 3.9%(to QAR 389.1bn) respectively.
- Tourism continues to rise, with April alone seeing an inflow of 382.5k tourists, taking the total to more than 2mn visitors in Jan-Apr 2024 (Qatar had clocked in a record-high 4mn visitors in full year 2023). While visitors from the GCC account for close to 50% of the total, the upcoming unified GCC visa will support tourism even further. There is already a “Double the Discovery” campaign in operation, being conducted in collaboration with Saudi Arabia.
4. Fears of prolonged trade disruptions & surging shipping costs and delays, amid rising competitiveness of air cargo
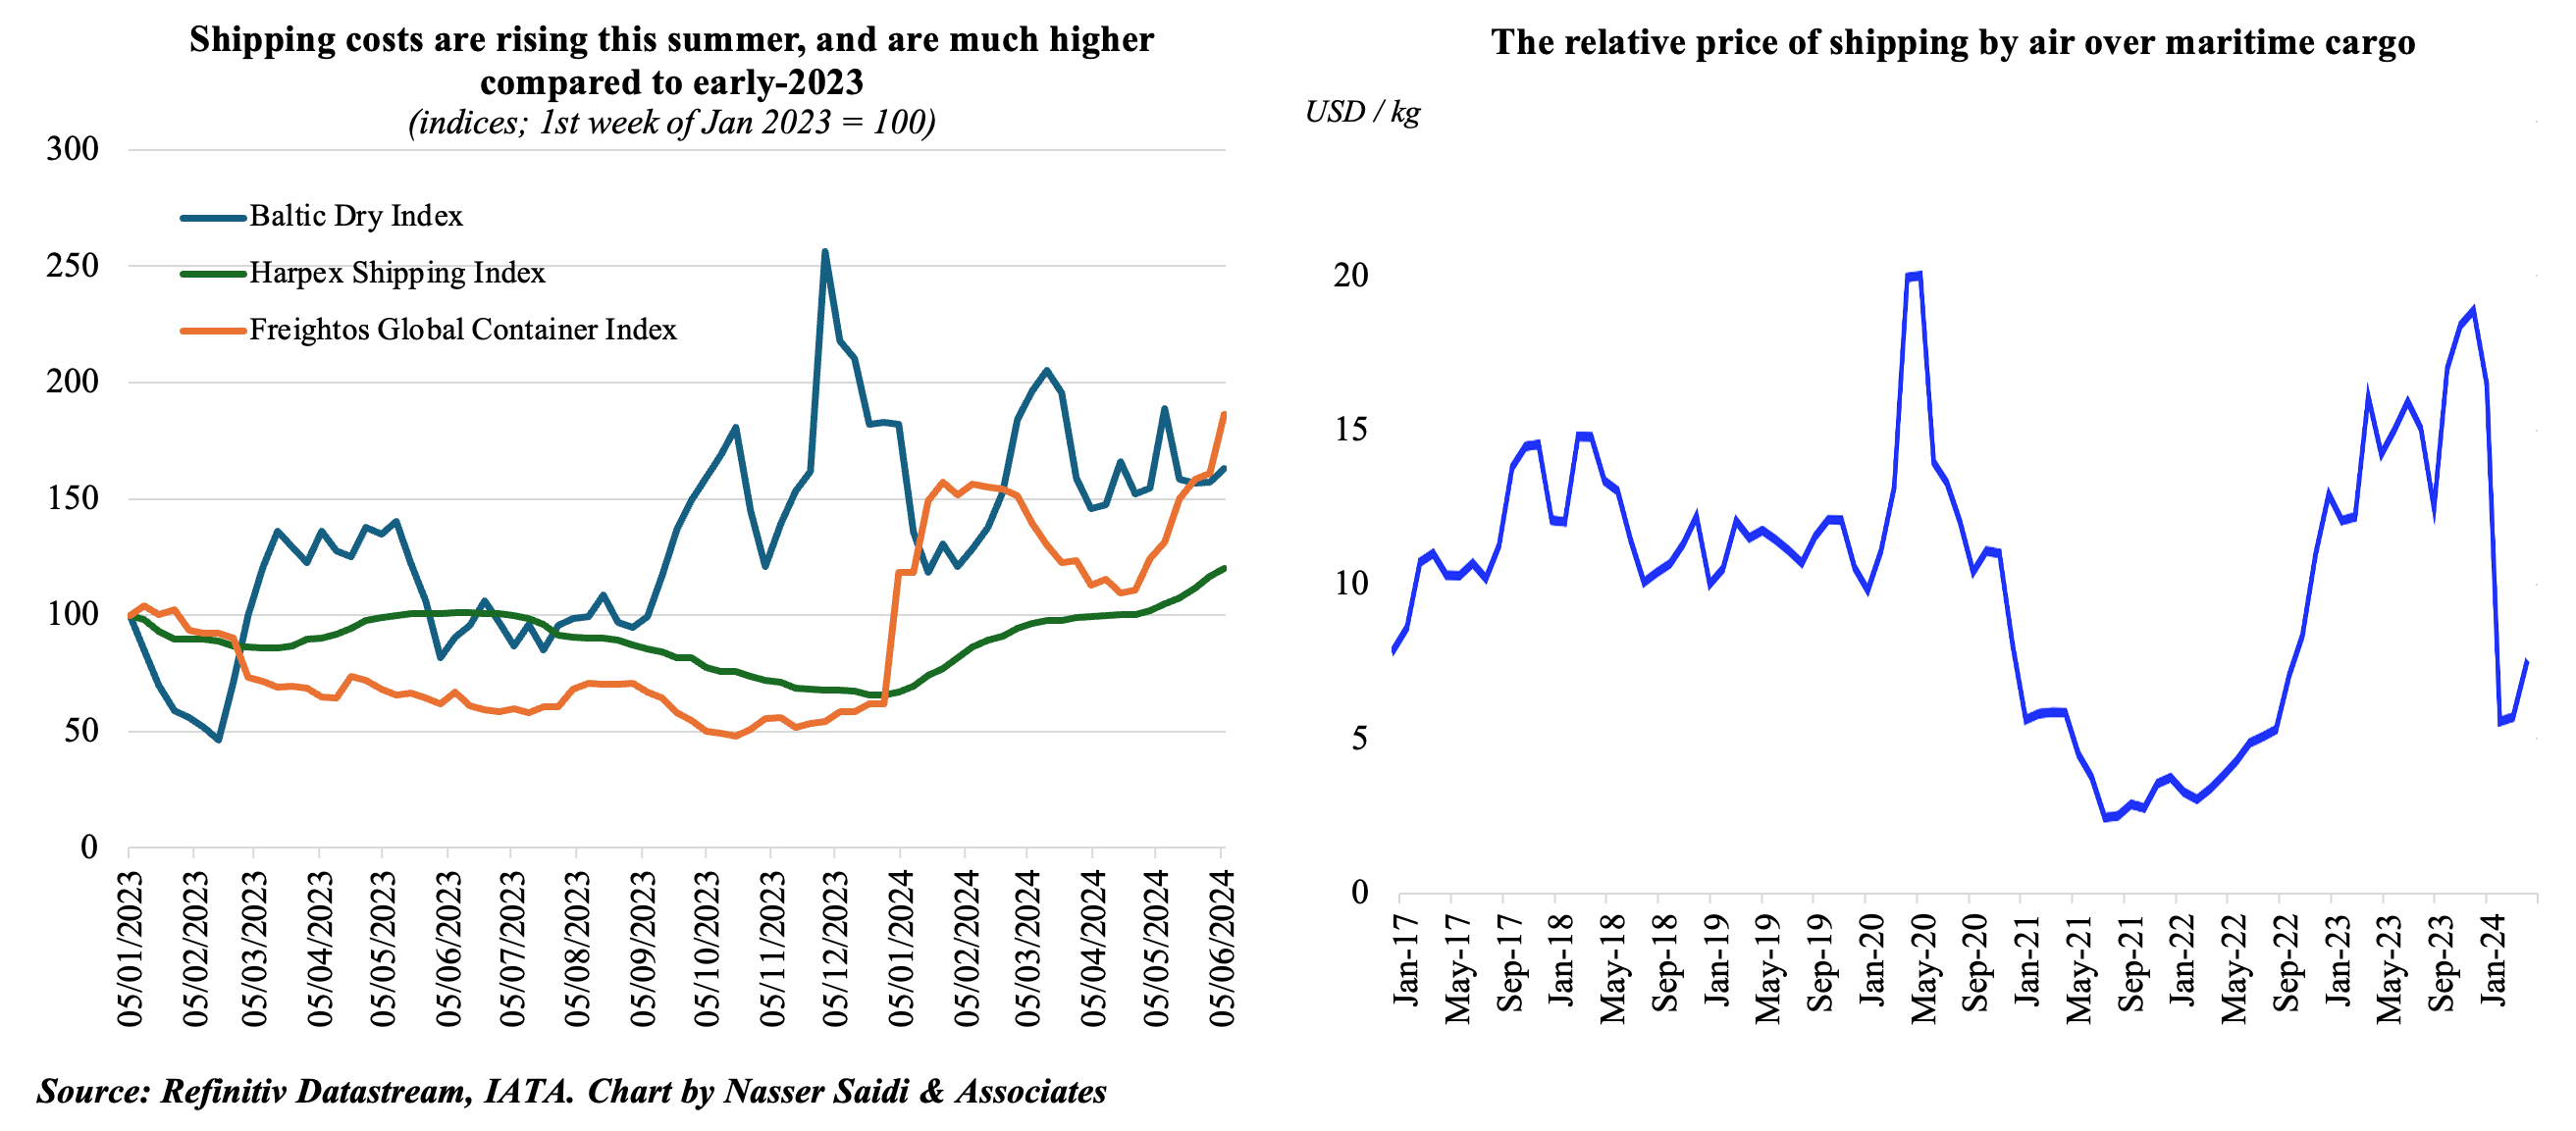
- Trade disruptions have been rising – implying time delays & higher shipping rates. According to the IMF’s PortWatch platform, the shipping volume via Suez Canal was down by two-thirds in Apr 2024 versus a year ago; this follows a 55% yoy drop in Q1 this year. Food prices also remain vulnerable to shipping disruptions.
- Shipping costs have been rising, with past few weeks seeing a sudden jump. The average cost of shipping a 40ft container now exceeds USD 4,000, a 140% surge from 2023 (Source: Xeneta). Shipping container rates from China jumped to 2-year highs on the recent announcement of hike in US tariffs and as concerns rise about the potential extension of Red Sea disruptions. Shipments are being processed earlier than normal (retailers are placing orders for Black Friday & Christmas now than towards late summer) ahead of the US tariffs coming into effect and given fears of an escalation in US-China trade tensions.
- IATA’s report on the global outlook for air transport indicated that the disruptions in container shipping brought about a sharp drop in relative air cargo rates over maritime shipping in Q1 2024, increasing the competitiveness of air cargo. But the air freight rates are still relatively much higher. There has been a strong increase in air cargo demand in the Middle East, Africa, and Asia Pacific; overall cargo volumes are expected to expand this year after a less-than-stellar 2022 and 2023.
5. Global supply chain pressures inch up & global food prices rise for a third consecutive month
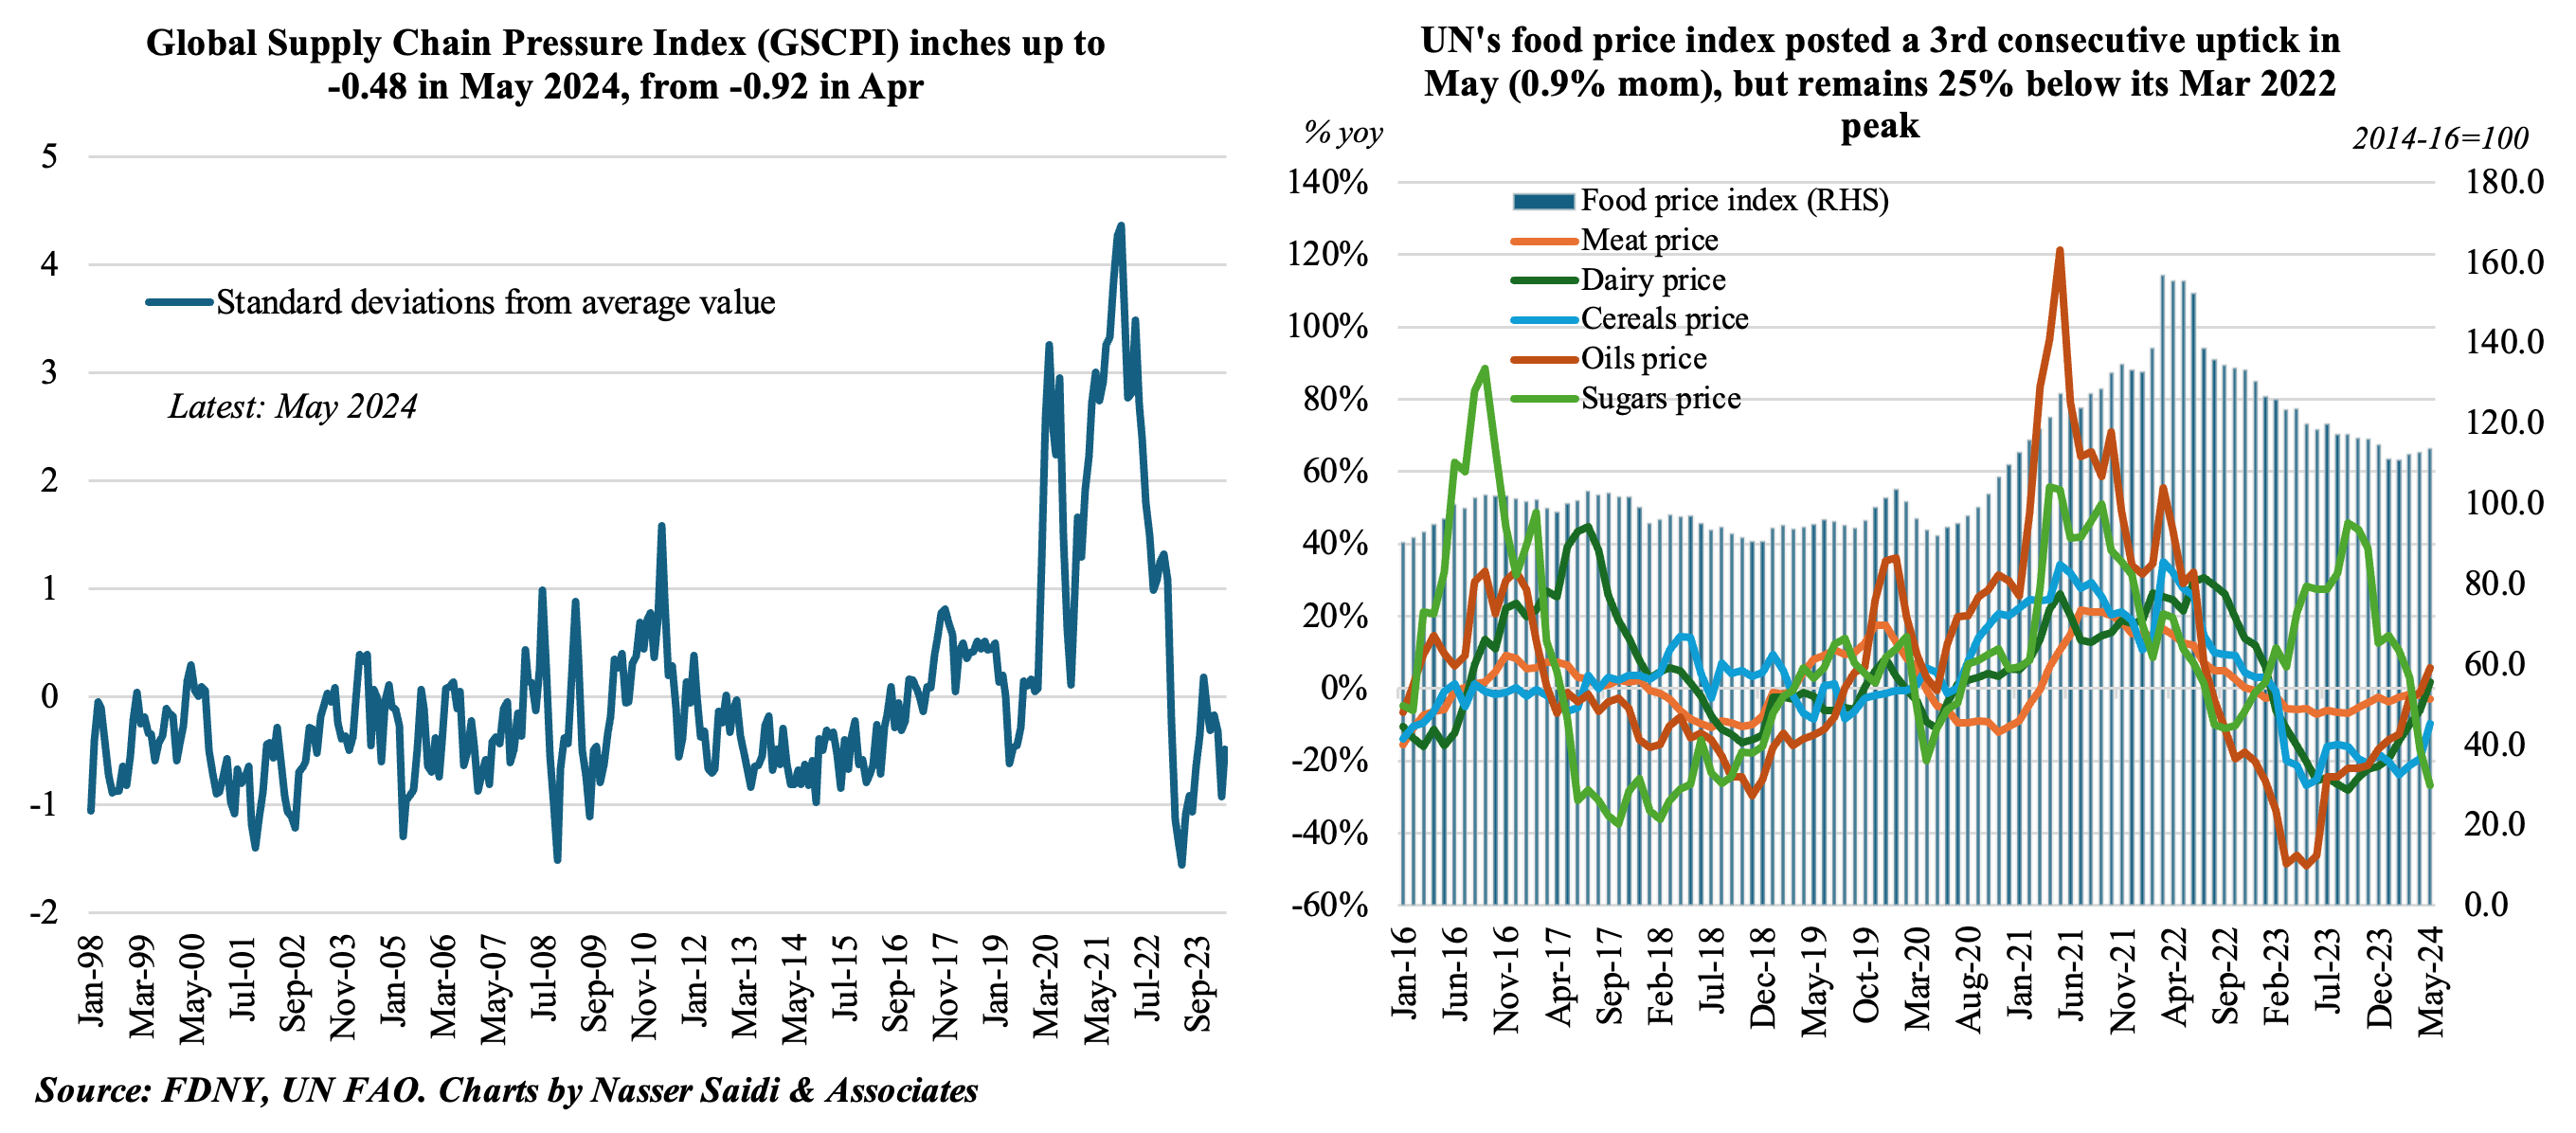
- The Fed’s Global Supply Chain Pressure Index (GSCPI) is still below its historical mean despite edging up to -0.48 in May from Apr’s -0.92 reading. A reading below zero suggests below normal supply chain pressures. Global supply chain issues had peaked (at 4.33) in Dec 2021 and have been falling since that point for most of the time. With ongoing logistics-related troubles (that show little signs of abating), it is not unsurprising that the index has ticked up in May, moving closer to zero.
- In addition, the UN’s real food price index rose for the third month in a row, by 0.9% mom (though it fell by 5.1% in yoy terms), as prices ticked up for dairy (1.8% mom) and cereals (6.3% mom) amid declines across other categories. Wheat prices increased the most among major cereals, partly due to production and partly due to damaged Black Sea shipping infrastructure.
- A prolonged period of shipping disruptions and increase in shipping rates could increase supply chain pressures and pose inflationary risks, especially if it continues into H2 2024.
Powered by:


