

Middle East PMIs. Saudi foreign trade & monetary statistics. Dubai tourism. GCC inflation. Global supply chain pressures.
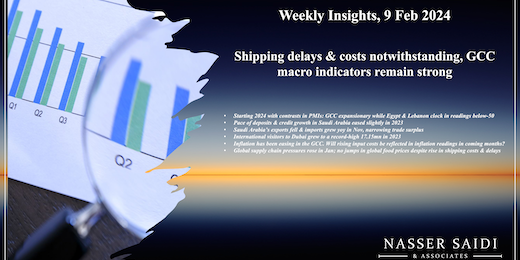
Weekly Insights 9 Feb 2024: Shipping delays & costs notwithstanding, GCC macro indicators remain strong
1. Starting 2024 with contrasts in PMIs: GCC expansionary while Egypt & Lebanon clock in readings below-50 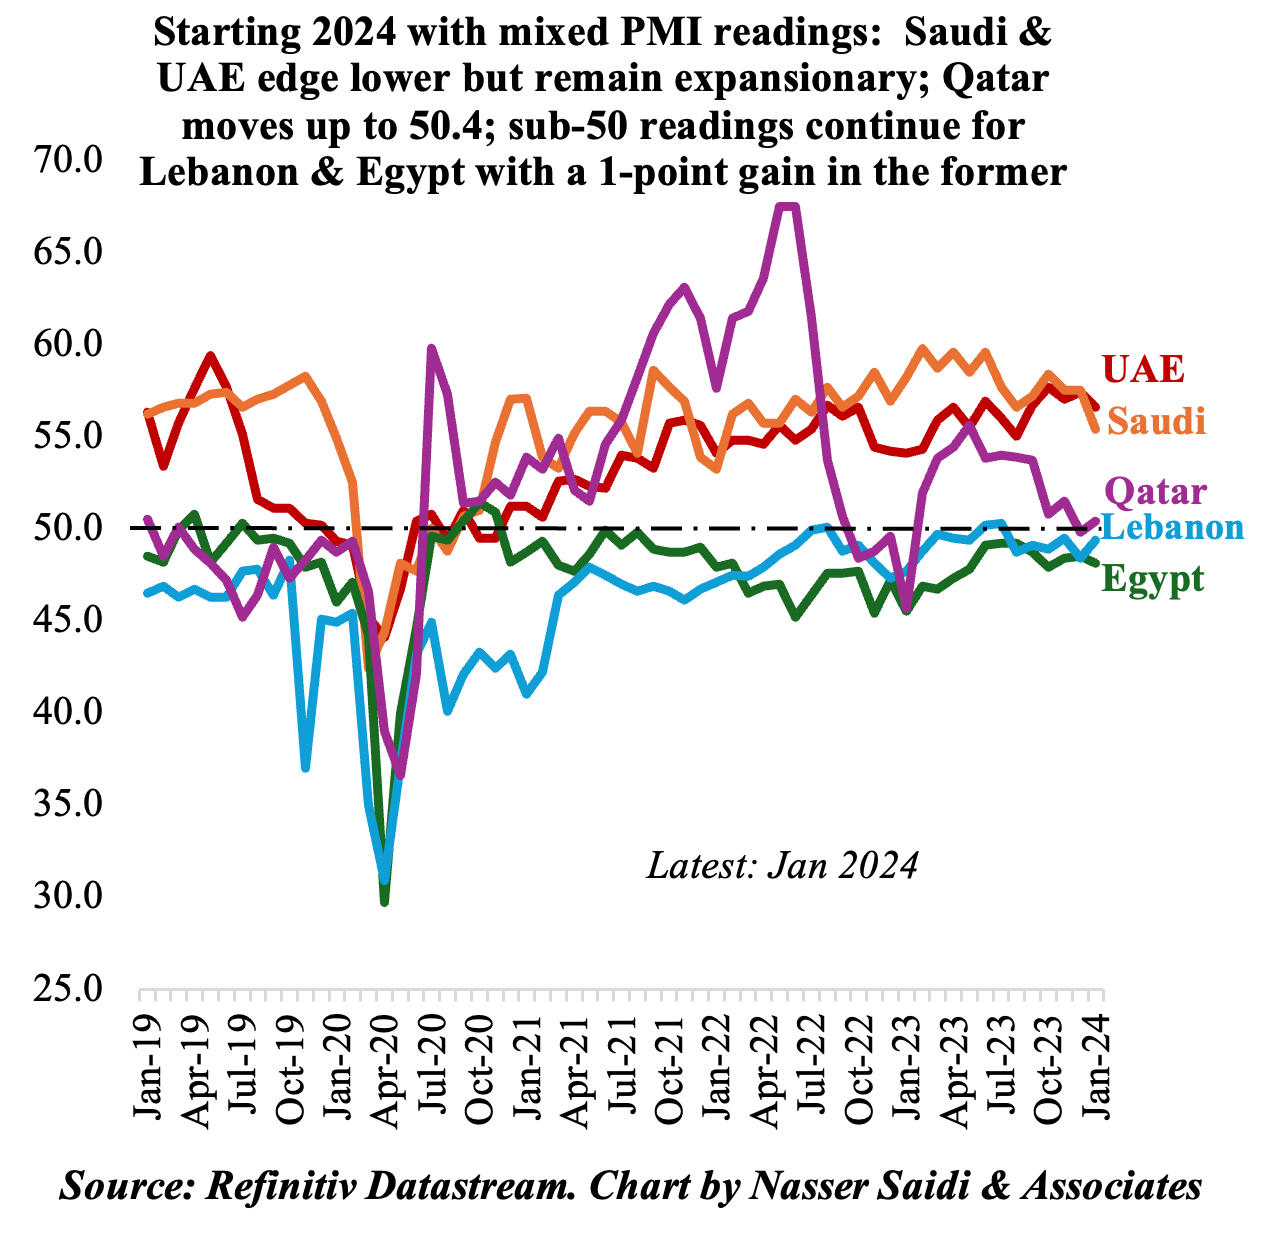
- Saudi, UAE and Qatar post expansionary readings in Jan 2024, with the latter supported by tourism related to the AFC Asian Cup.
- Both Saudi and the UAE saw slight declines in Jan. Saudi PMI was the lowest since Jan 2021, as demand weakened amid cost pressures while export orders fell for the fourth time in 6 months. UAE PMI stood at a 5-month low, but both output and new orders stayed above long-run trends.
- Egypt remained contractionary for the 38th month in a row amid weak demand. Input and output costs were at 1-year highs, given import restrictions & currency weakness. Forward looking sentiment plunged to the lowest in the series history. Potential devaluation and IMF-suggested structural reforms would likely bring further distress (before seeing the positive effects).
- Lebanon saw a slight uptick in Jan, though remaining in contractionary territory, thanks to slower pace of declines in output and new orders. With limited impact of the conflict in Gaza, and stable exchange rates, business confidence was higher than the average in past 4 years.
- The common thread across many nations was instances of delivery delays as well as rising input costs (in Saudi it rose to the highest since Aug 2020 while UAE firms also mentioned higher shipping costs). In both Saudi and UAE, firms reported greater competition (to increase sales) & as a result firms absorbing the rising input costs.
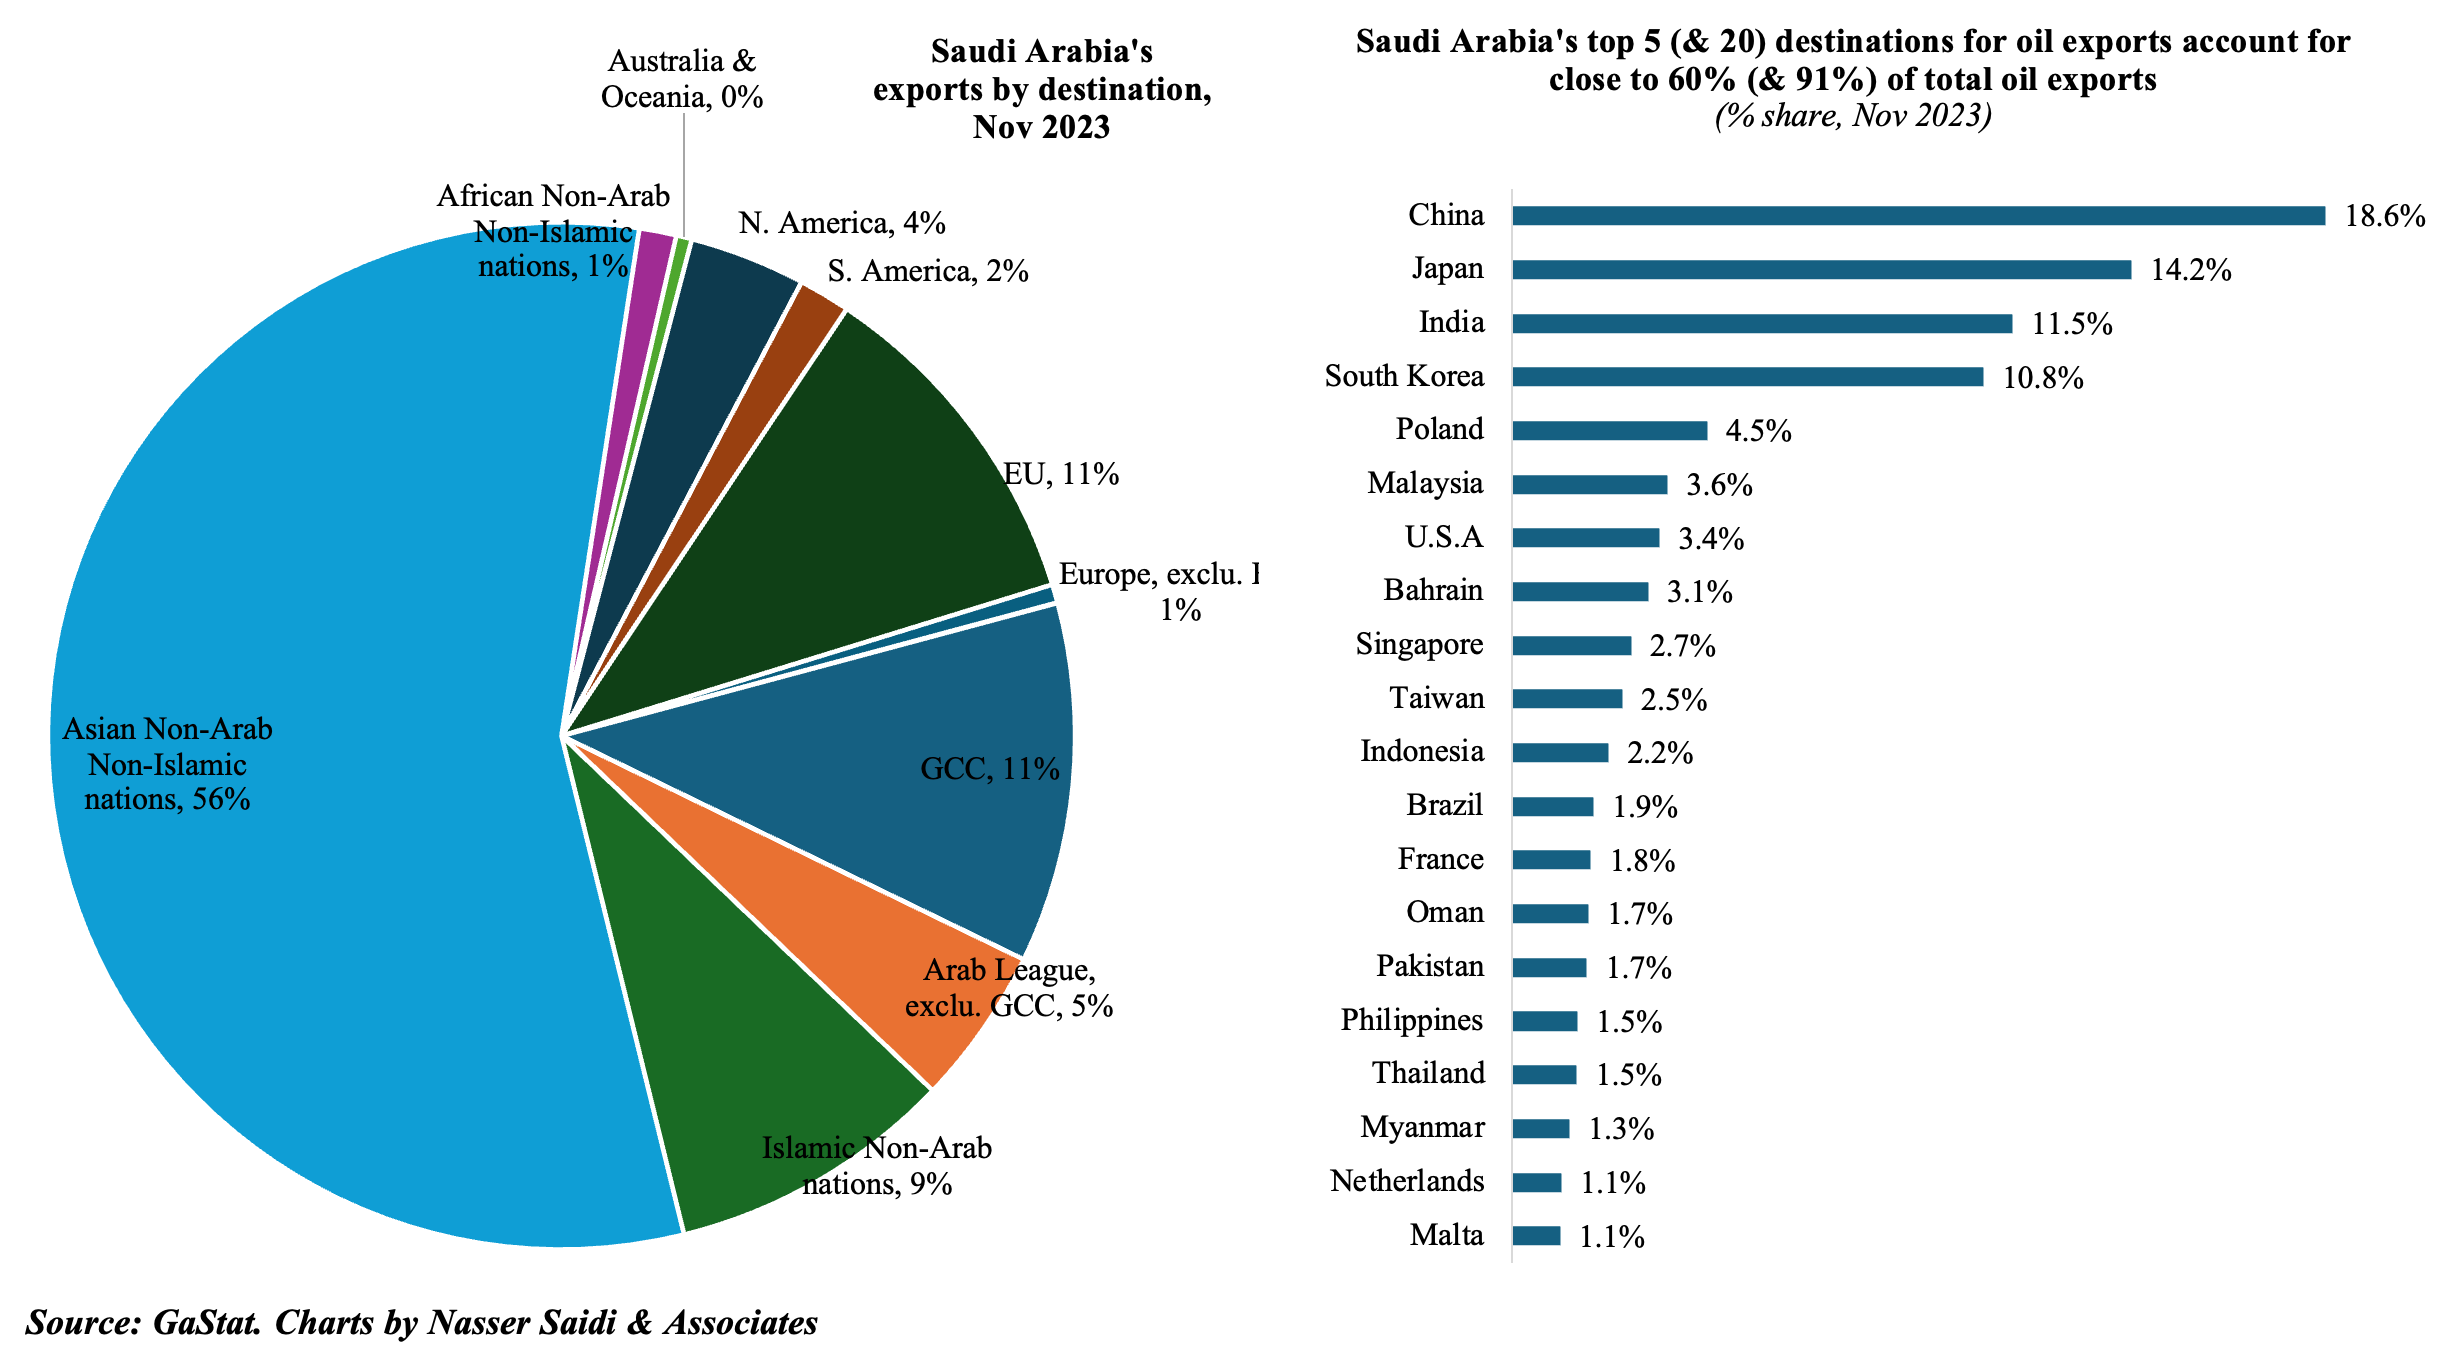
2. Saudi Arabia’s exports fell & imports grew yoy in Nov, narrowing surplus 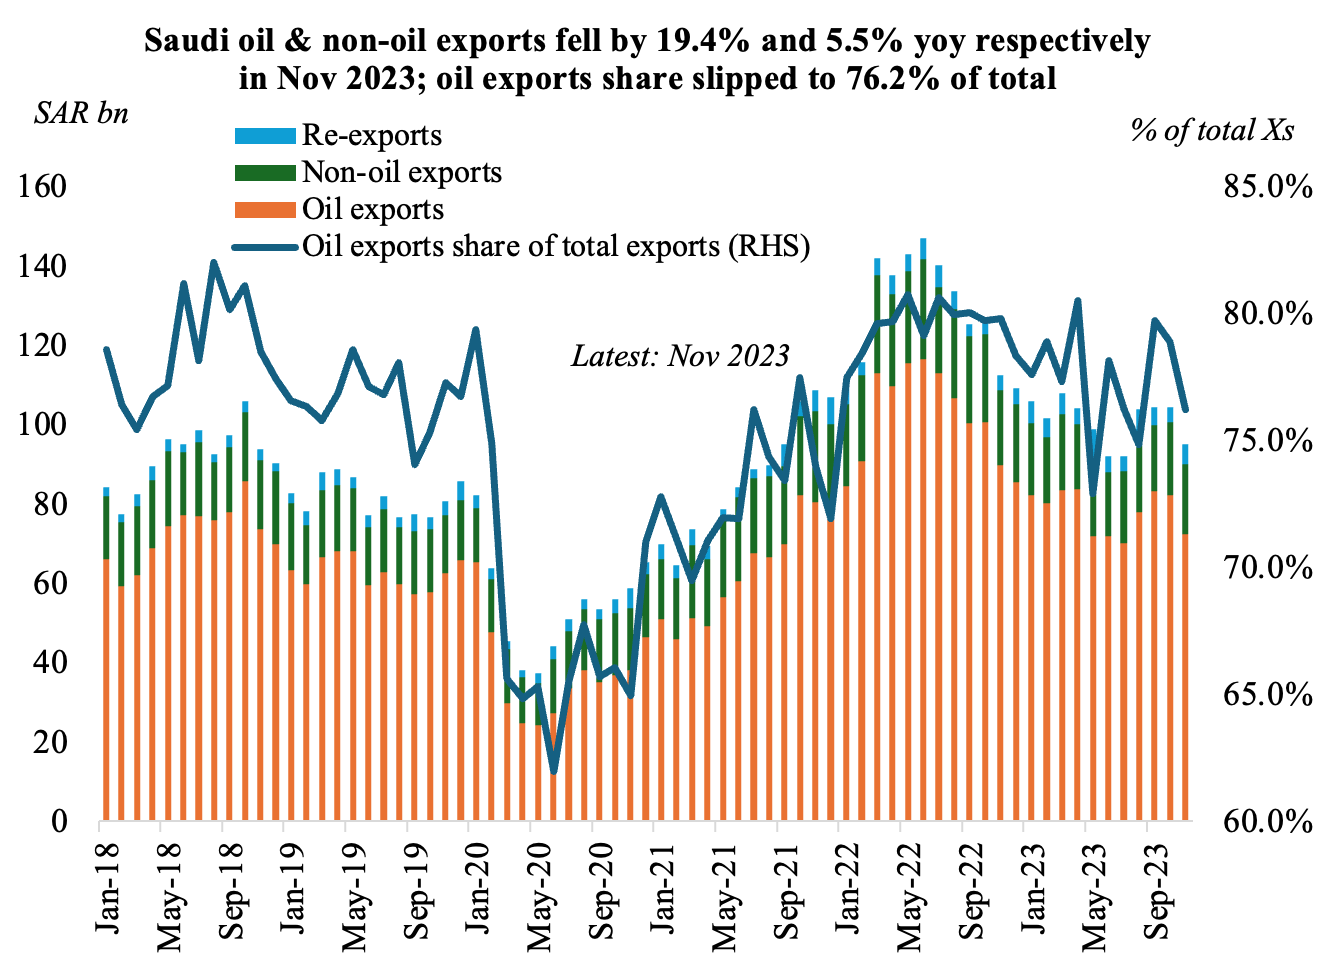
- Saudi Arabia’s overall exports fell by 15.6% yoy and 9% mom to SAR 94.98bn in Nov, partly due to the drop in oil exports (-19.4% yoy). Oil exports share in total exports slipped to 76.2% in Nov.
- Non-oil exports also fell, by 5.5% yoy and 2.7% mom to SAR 17.8bn (close to 20% of total exports). Re-exports, which accounts for 5.1% of total exports, grew by 21.8% yoy and 28% mom.
- Imports grew by 3.7% yoy but fell by 9.1% mom to SAR 67.2bn.
- Overall trade surplus narrowed for a second month in Nov, to SAR 27.8bn, from Oct’s SAR 30.4bn. It plunged by 58% in yoy terms.
- China was the top trade partner in Nov: accounting for 17% of overall exports and 25% of total imports.
- Oil exports to the top 5 destinations (China, Japan, India, South Korea and Poland) accounted for 59.5% of the total oil exports in Nov and for the top 25 it was close to 95%.
- Largest non-oil exports (including re-exports) were chemicals & allied products and plastics (close to 55% of outbound trade).
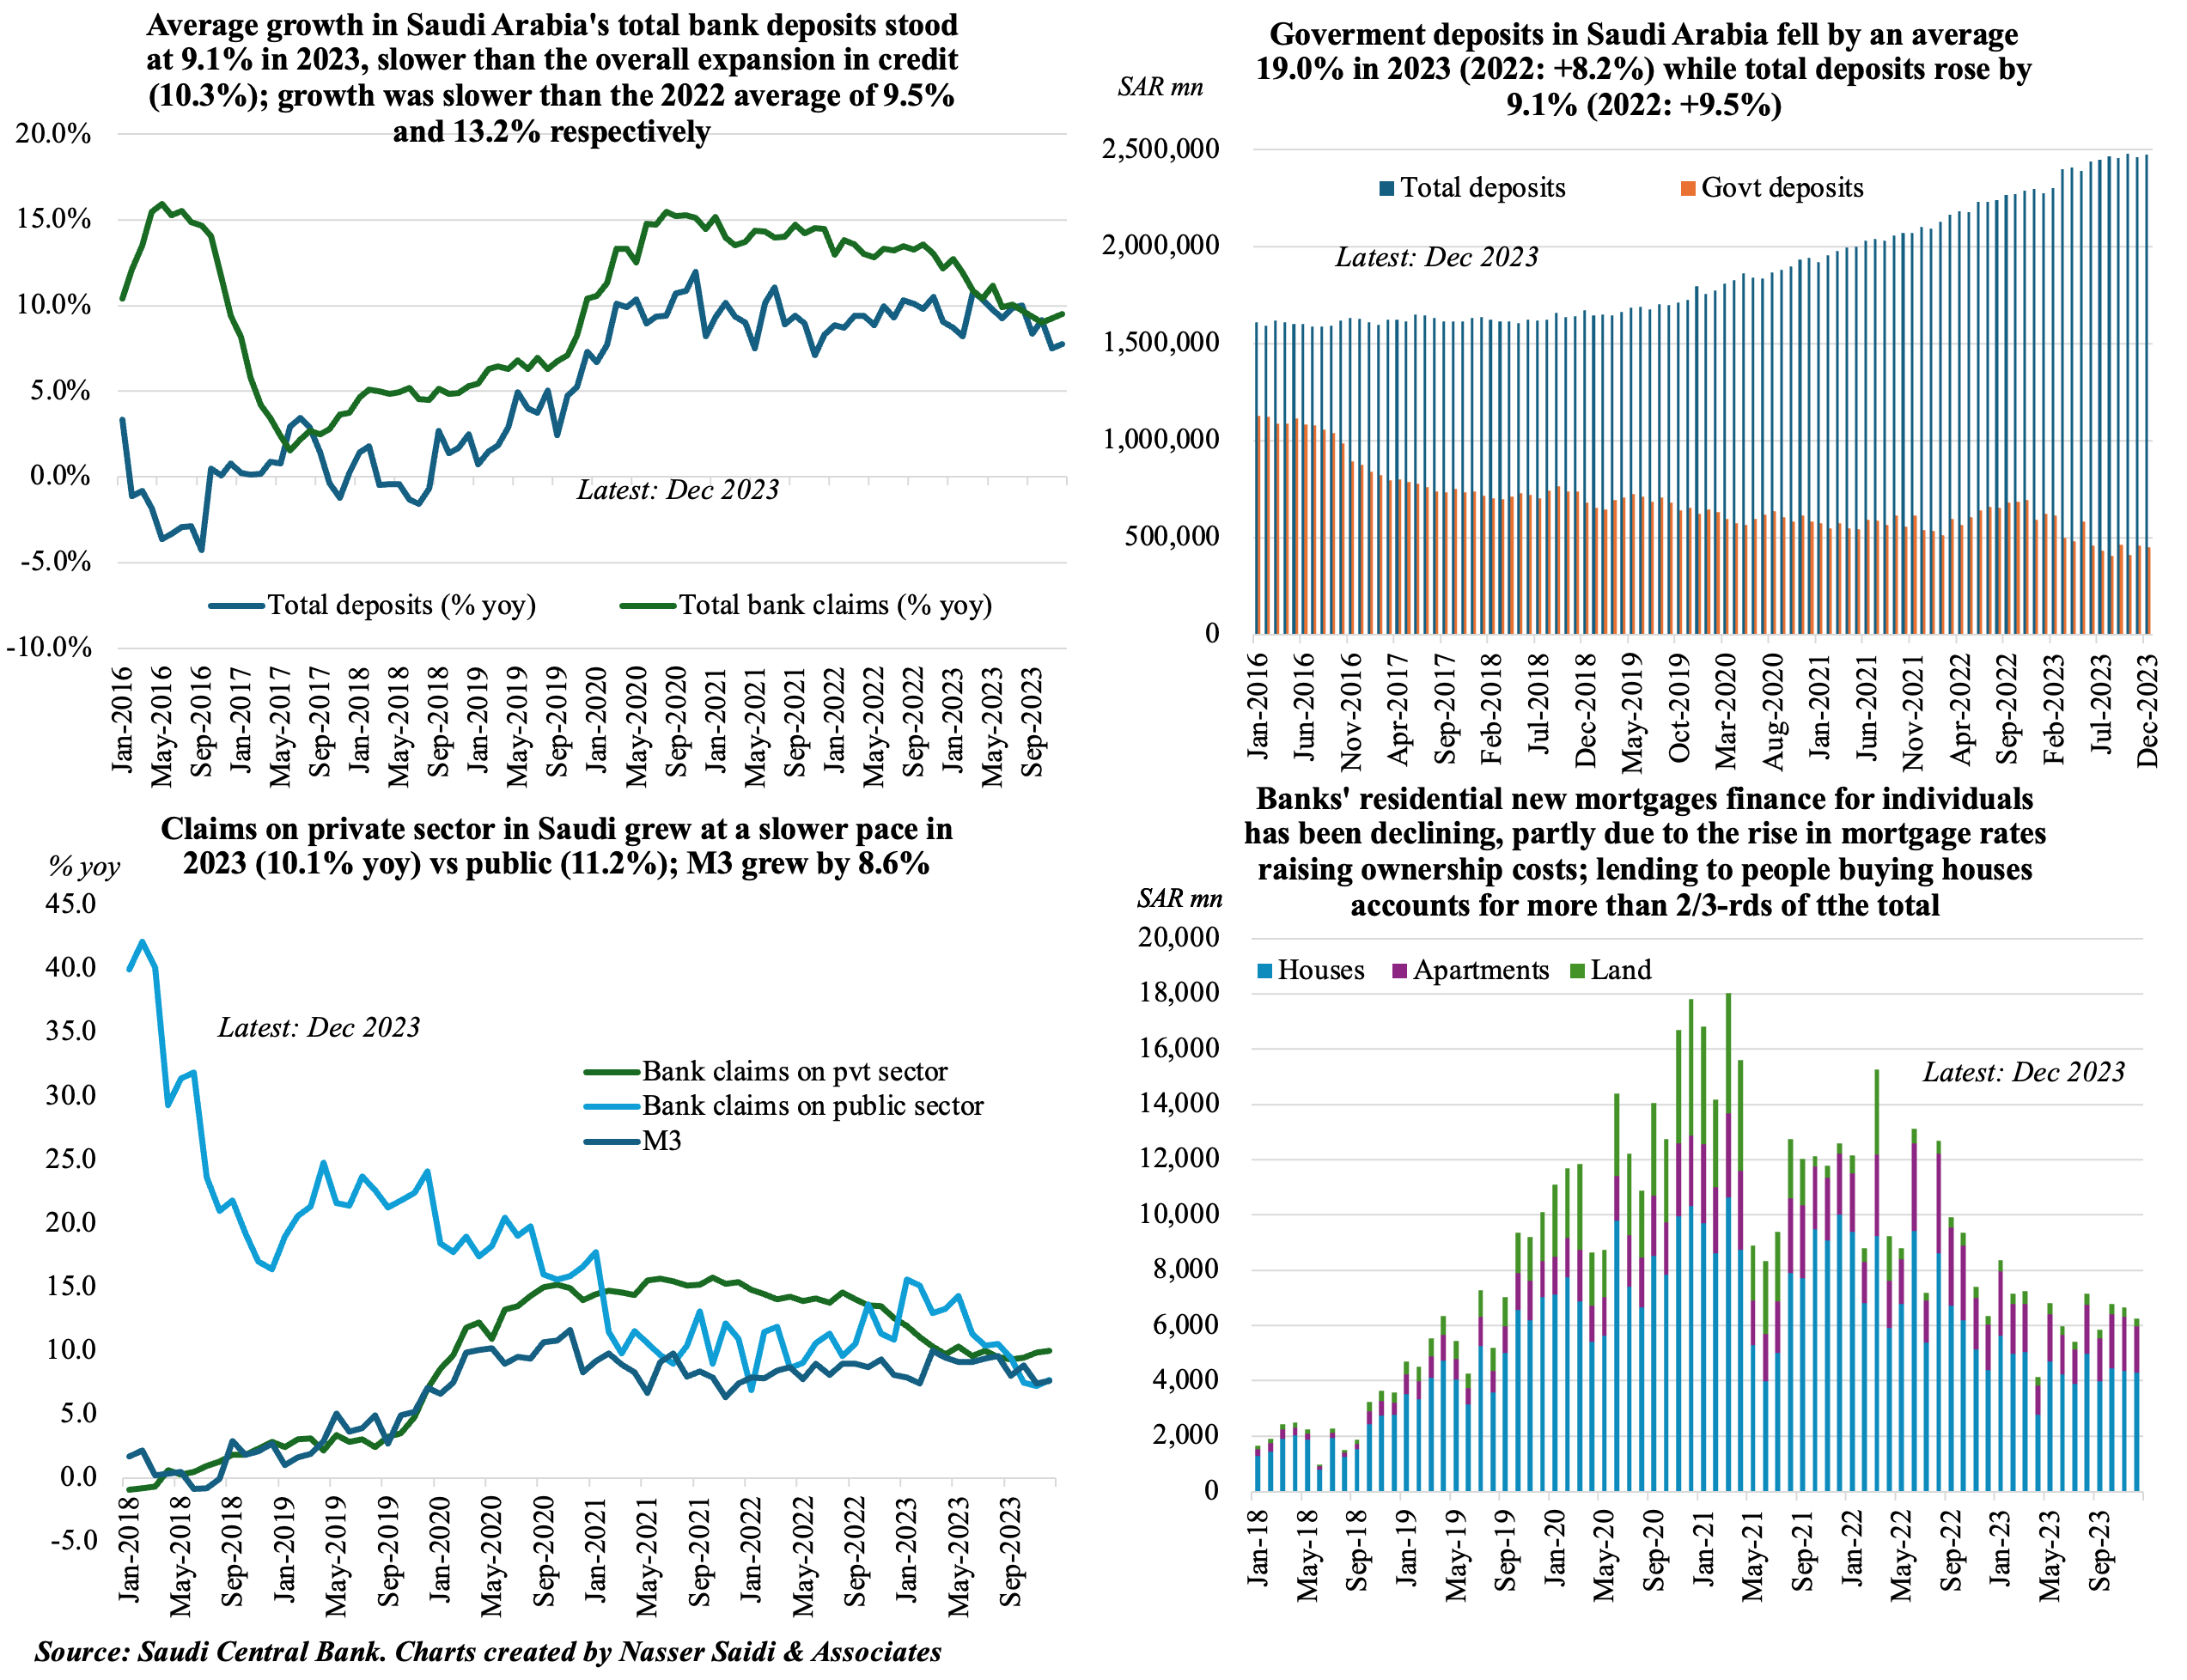
3. Pace of deposits & credit growth in Saudi Arabia eased slightly in 2023; govt deposits fell by an average 19% in 2023 vs 2022’s 8.2% gain; rising ownership costs reflected in a decline in banks’ mortgage finance
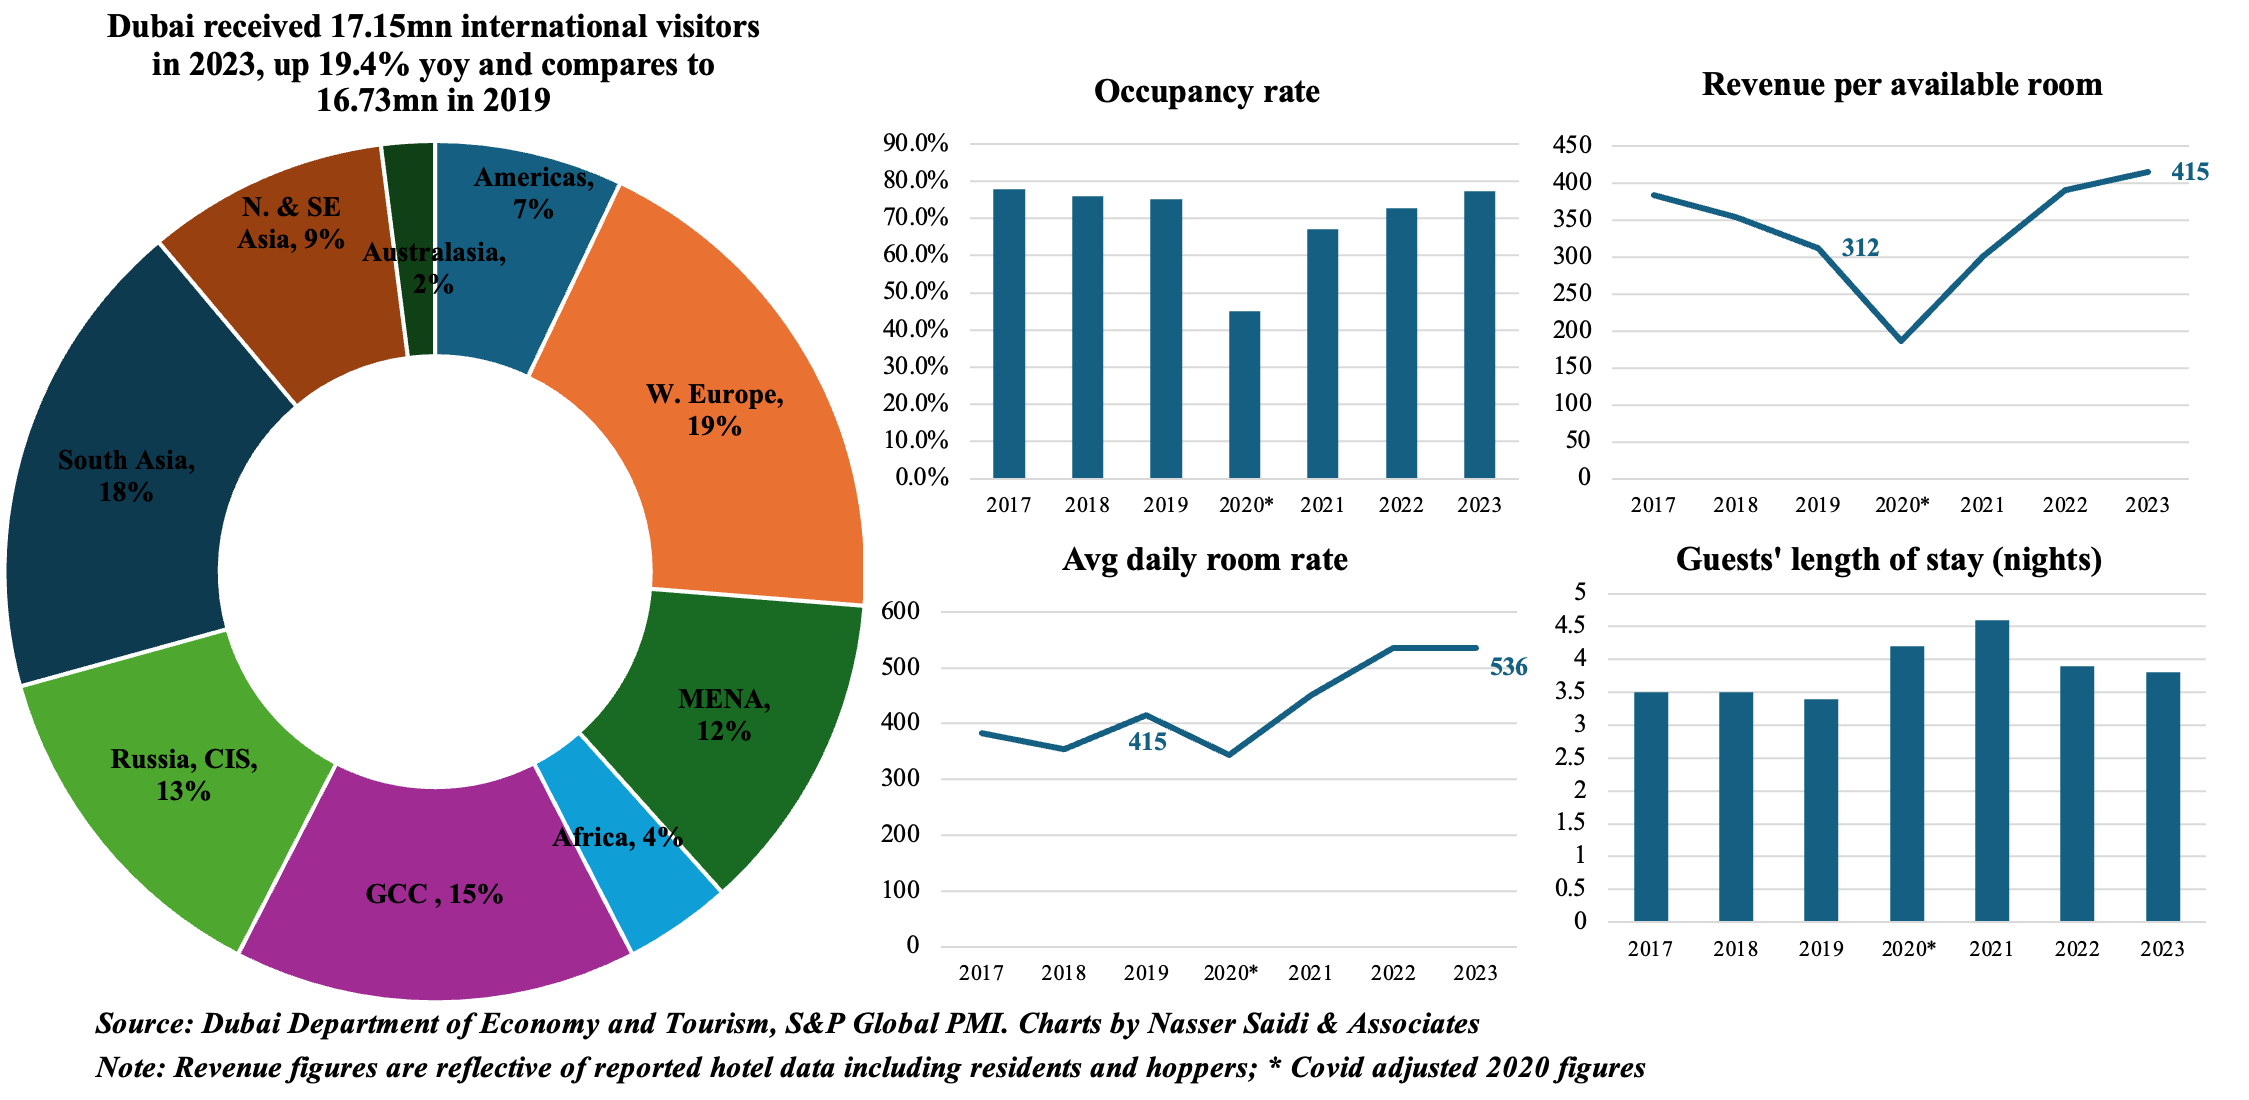
4. International visitors to Dubai grew to a record-high 17.15mn in 2023, up 19.4% yoy & 2.5% higher than previous record-high in 2019 (16.73mn)
- Dubai touched a record-high 17.15mn international visitors 2023: this was up 19.4% yoy & 2.5% higher compared to 2019.
- Regional composition of tourists broadly unchanged: GCC & MENA regions together accounted for 27% of visitors in 2023 (similar to 2019) while Western Europe and South Asia accounted for the largest shares at 19% and 18% respectively.
- At end-Dec 2023, there were 150,291 hotel rooms (+3% yoy) across 821 establishments (+2% yoy) in Dubai. Hotel occupancy rate at 77% was higher than 2019’s 75%; revenue per available room remains high (AED 415 vs AED 312 pre-Covid) while room rates have remained stable (at AED 536) while length of stay has inched slightly lower (-4% yoy to 3.8, though higher than 3.4 in 2019). Furthermore, occupied room nights jumped by 11% yoy to 41.7mn in 2023 & up 30% from pre-pandemic figure of 32.11mn.
- This will translate into a positive contribution in Dubai’s GDP data for Q4. In the first 9 months of 2023, which saw accommodation and food services activities posting a 11% growth (contributing 3.4% to GDP).
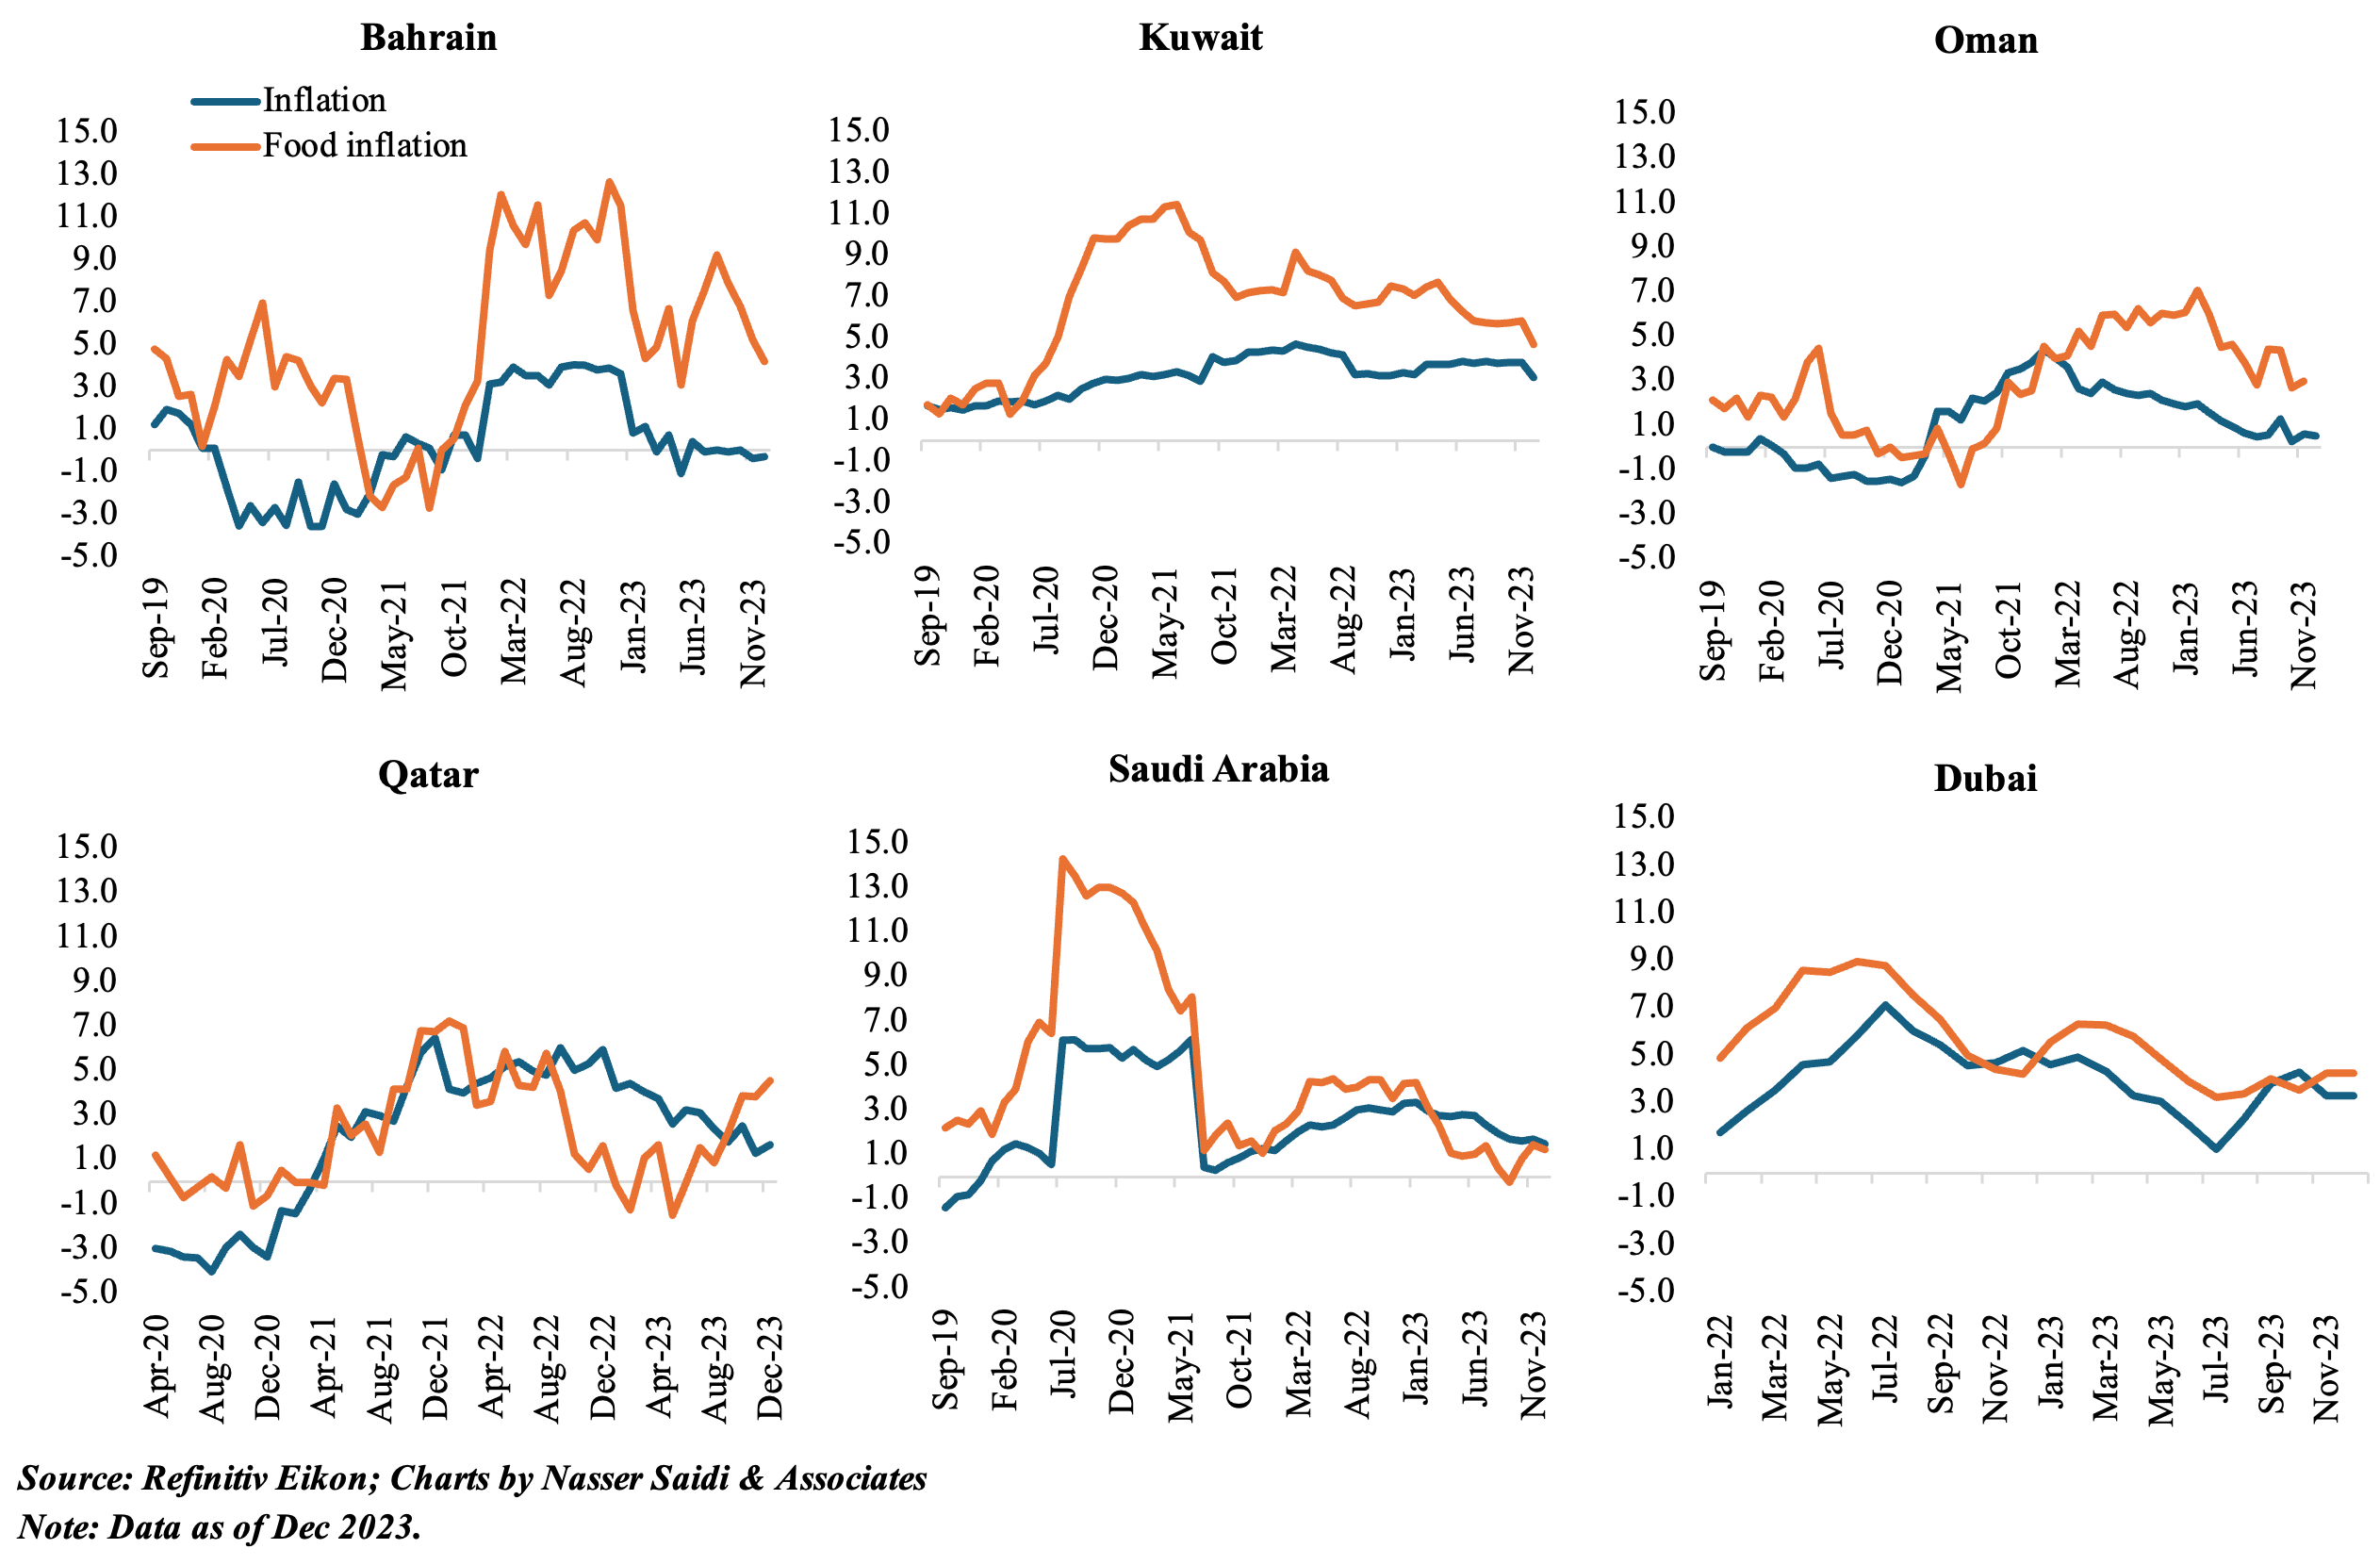
5. GCC inflation is easing. Housing costs driving force in Dubai & Saudi. Recent PMI reports have businesses citing shipping delays & rising input costs: some firms are opting to pass the costs to consumers, which could see price nudge up slightly in the coming months (unlikely to reach Covid-highs unless there’s an escalation)
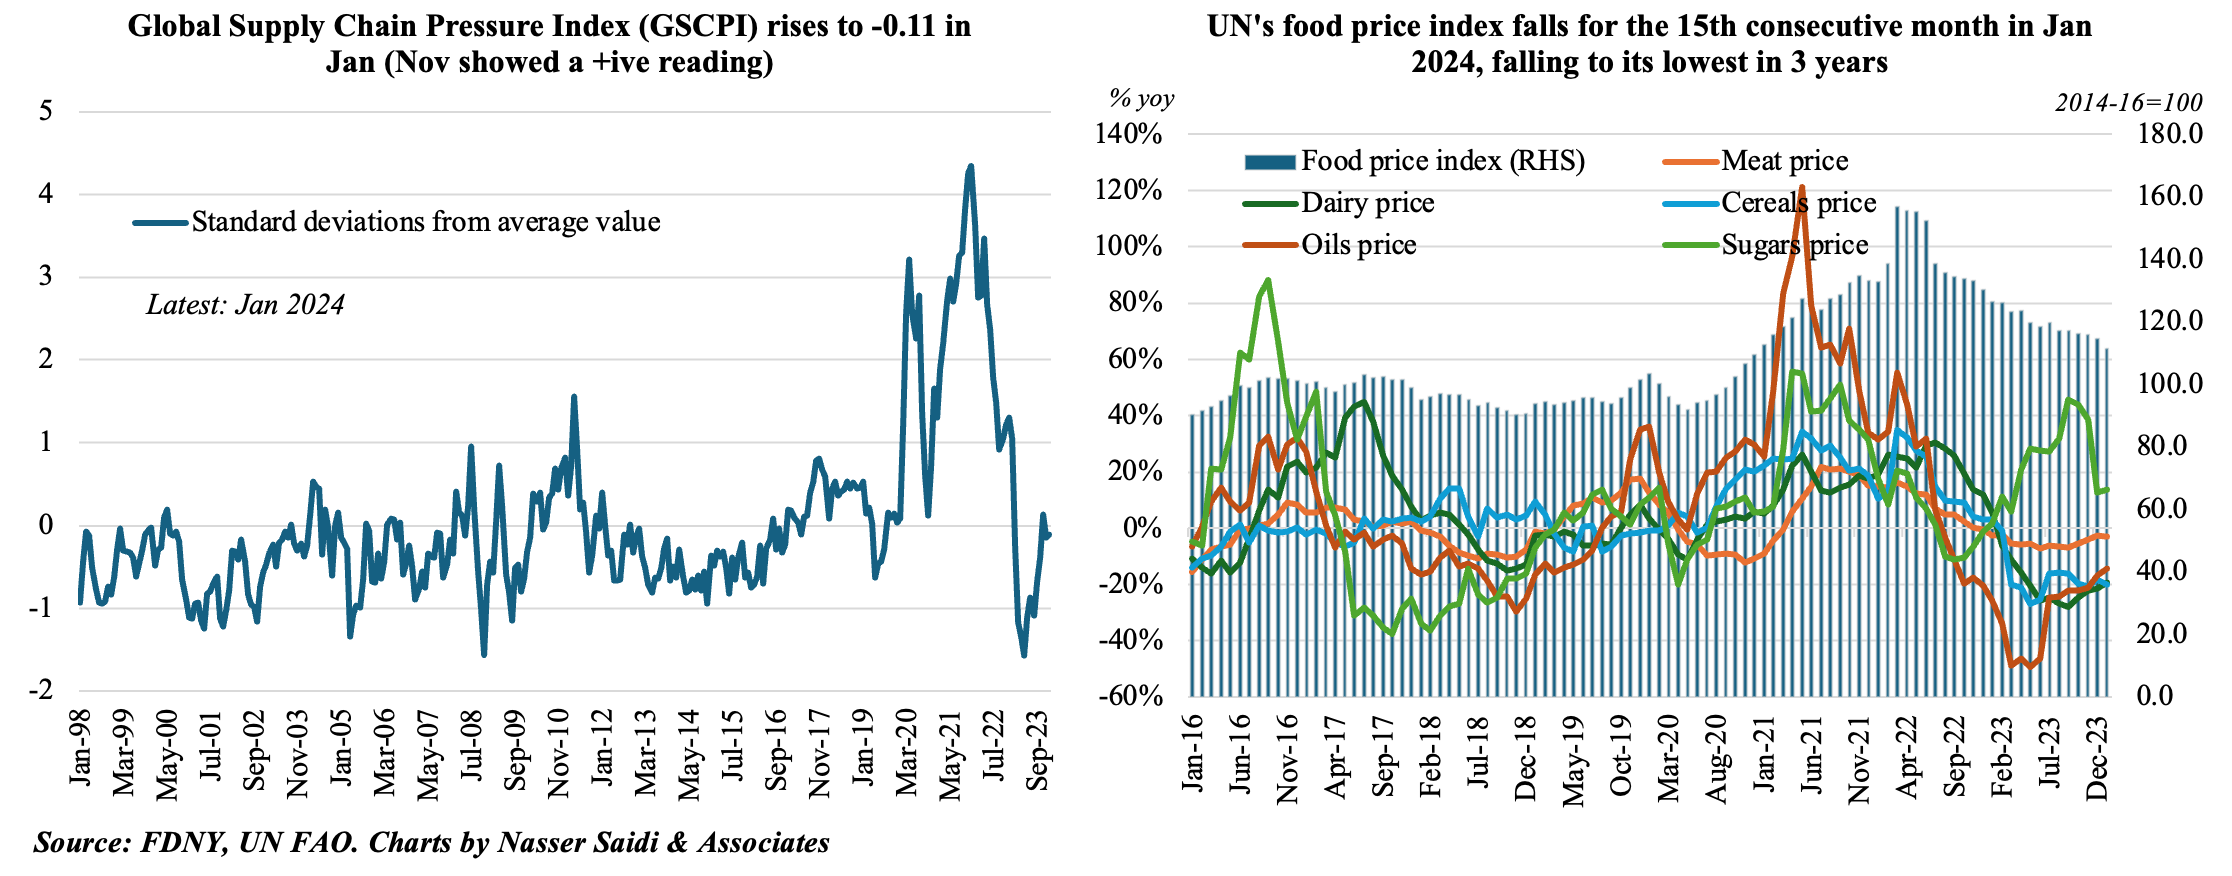
6. Global supply chain pressures rose in Jan; no jumps in global food prices despite rise in shipping costs & delays
- UN’s food price index fell to 111.5 points in Jan 2024, for the 15th month in a row, and the lowest since Jan 2021, driven by declines across all categories. Sugar prices declined the least in month-on-month terms, down by 1% in Jan.
- The Fed’s Global Supply Chain Pressures Index (GSCPI) rose to -0.11 in Jan, following Dec’s -0.15 and Nov’s positive reading of 0.13. Remaining in negative territory means less than normal supply chain pressures, but the ongoing military action in the Red Sea (& shipping disruption) is causing shipping delays and adding costs.
- Re-routing is in progress: The IMF’s PortWatch platform showed shipping volume through the Suez Canal were down by 43% yoy in Jan 2024 while, to avoid the Red Sea, transit volume at the Cape of Good Hope rose by 60%.
- Container rates in some sectors have increased: Container spot rates per twenty-foot equivalent unit from Shanghai to Rotterdam are more than 3.5X higher in early-Feb vs early-Dec.
- Ahead of the Chinese Lunar New Year, and given shipping delays, global air freight rates (the Baltic Air Freight Index) had climbed for the first time in seven weeks at end-Jan. But, it remains to be seen if this continues post-Chinese New Year: air cargo is still much more expensive than increased shipping costs.
Powered by:
![]()