

Saudi inflation. UAE monetary statistics. Dubai tourism. MENA remittances. Conflicts & spillovers in the Middle East.
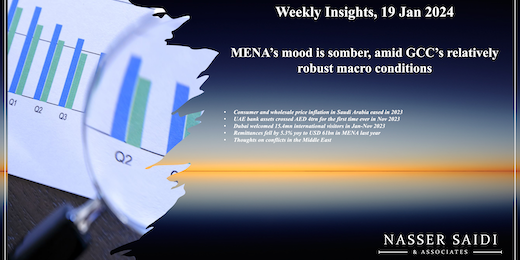
Weekly Insights 19 Jan 2024: MENA’s mood is somber, amid GCC’s relatively robust macro conditions
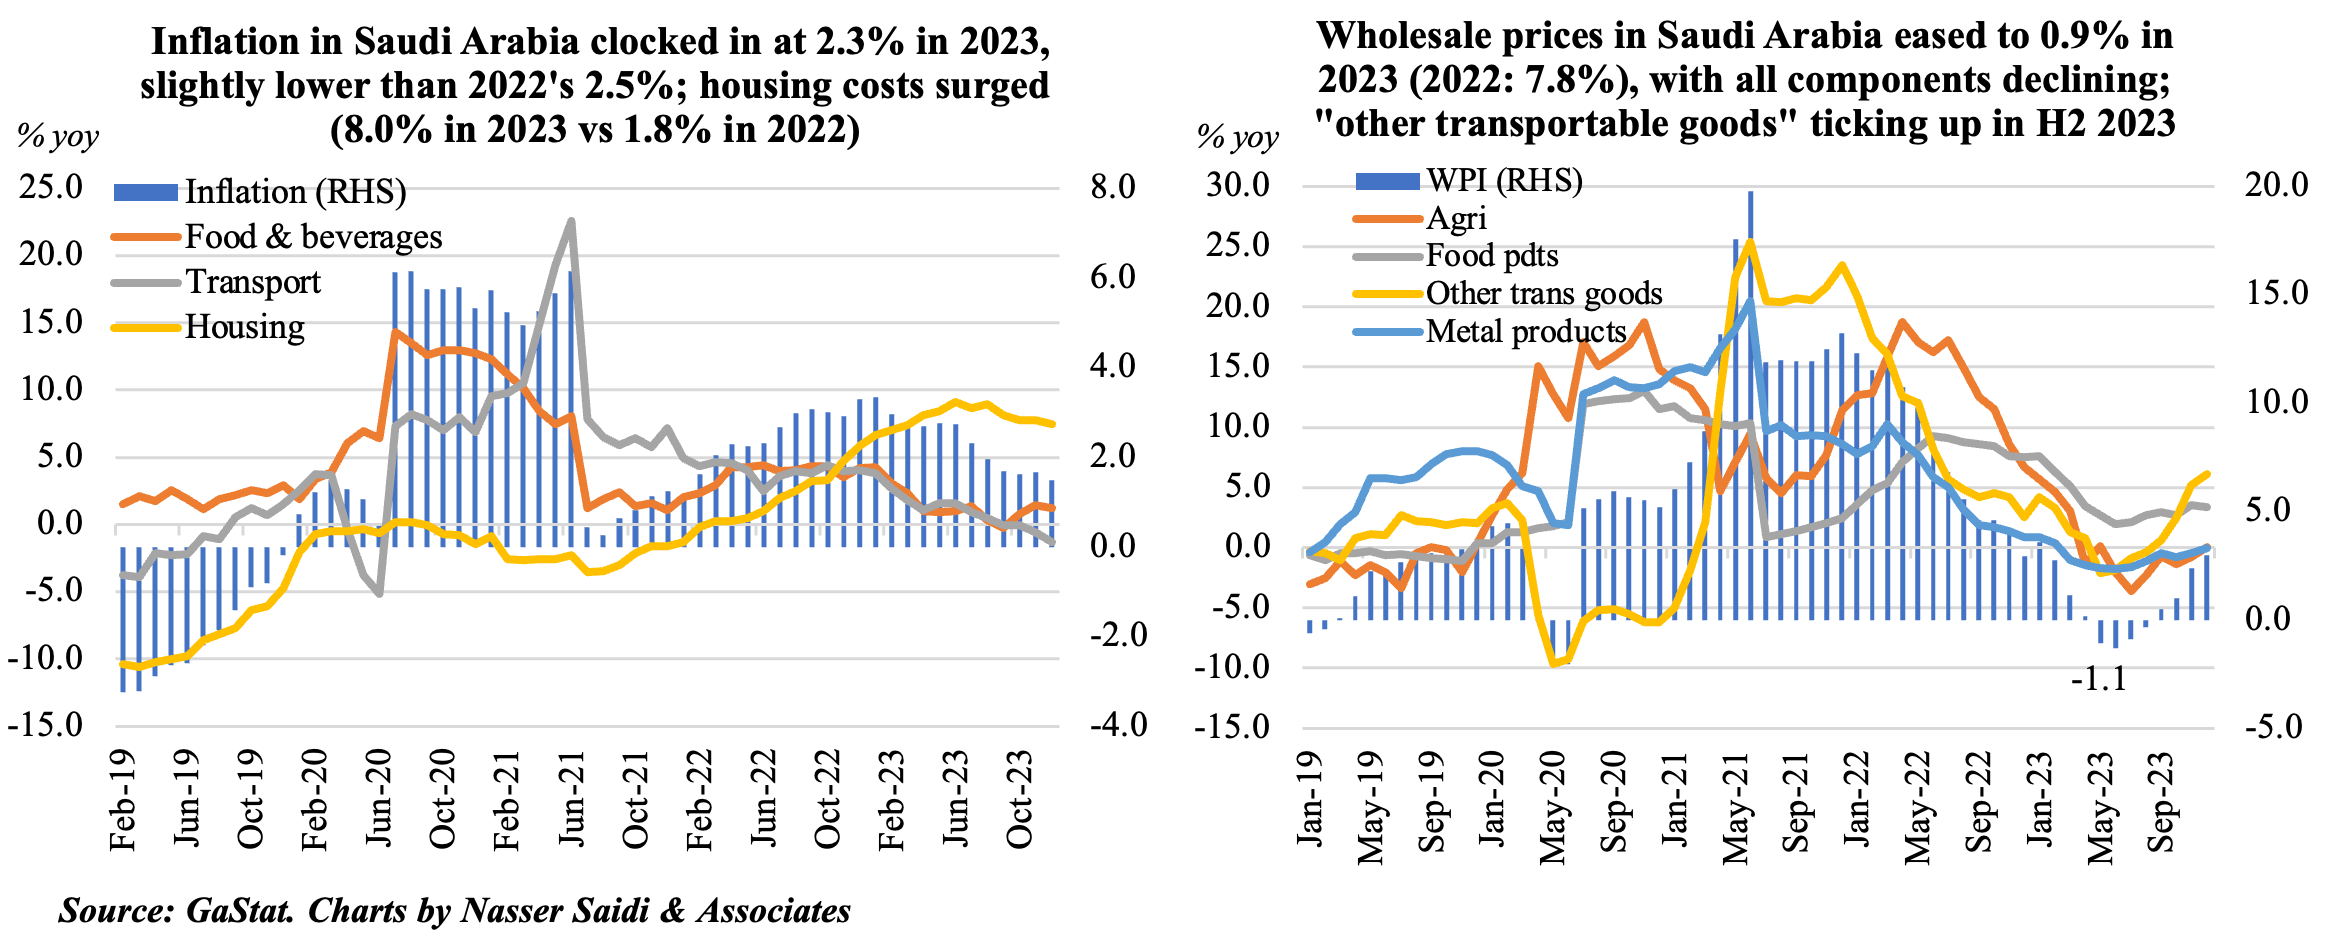
1. Consumer and wholesale price inflation in Saudi Arabia eased in 2023
- Consumer price inflation in Saudi Arabia fell to 1.5% yoy in Dec, the lowest since Jan 2022. as both housing and food costs slowed to 7.5% and 1.2% respectively (Nov: 7.8% and 1.4%) while gains were recorded in services-related restaurants & hotels (2.5% from 2.3%) and recreation & culture (1% from 0.5%).
- For the full year 2023, consumer inflation averaged 2.3%, lower than the government’s estimate of 2.6%, slower than the 2.5% recorded in 2022. Declines were posted across all categories except housing (surged to an average 7.95% from 1.8% in 2022) and health (edged up to 0.45% from 0.43%). Multiple categories saw costs fall by more than half including food & non-alcoholic beverages (1.5% from 3.7%), transport (1.0% from 4.1%) and recreation & culture costs (1.5% from 3.5%). Subsidies and price caps on specific products have supported in keeping inflation relatively low in Saudi Arabia.
- Wholesale prices in Saudi Arabia rose to 2.96% in Dec (Nov: 2.37%), the highest reading since Jan, largely driven by the jump in prices of “other transportable goods” which rose to 6.13% (Nov: 5.16%). WPI eased to 0.9% in 2023, from the 7.8% jump a year ago, with declines across all categories. However, if 2023 is split into 2 halves, “other transportable goods” costs rose to 2.19% in H2 (H1 2023: 0.92%), in contrast to all other groups.
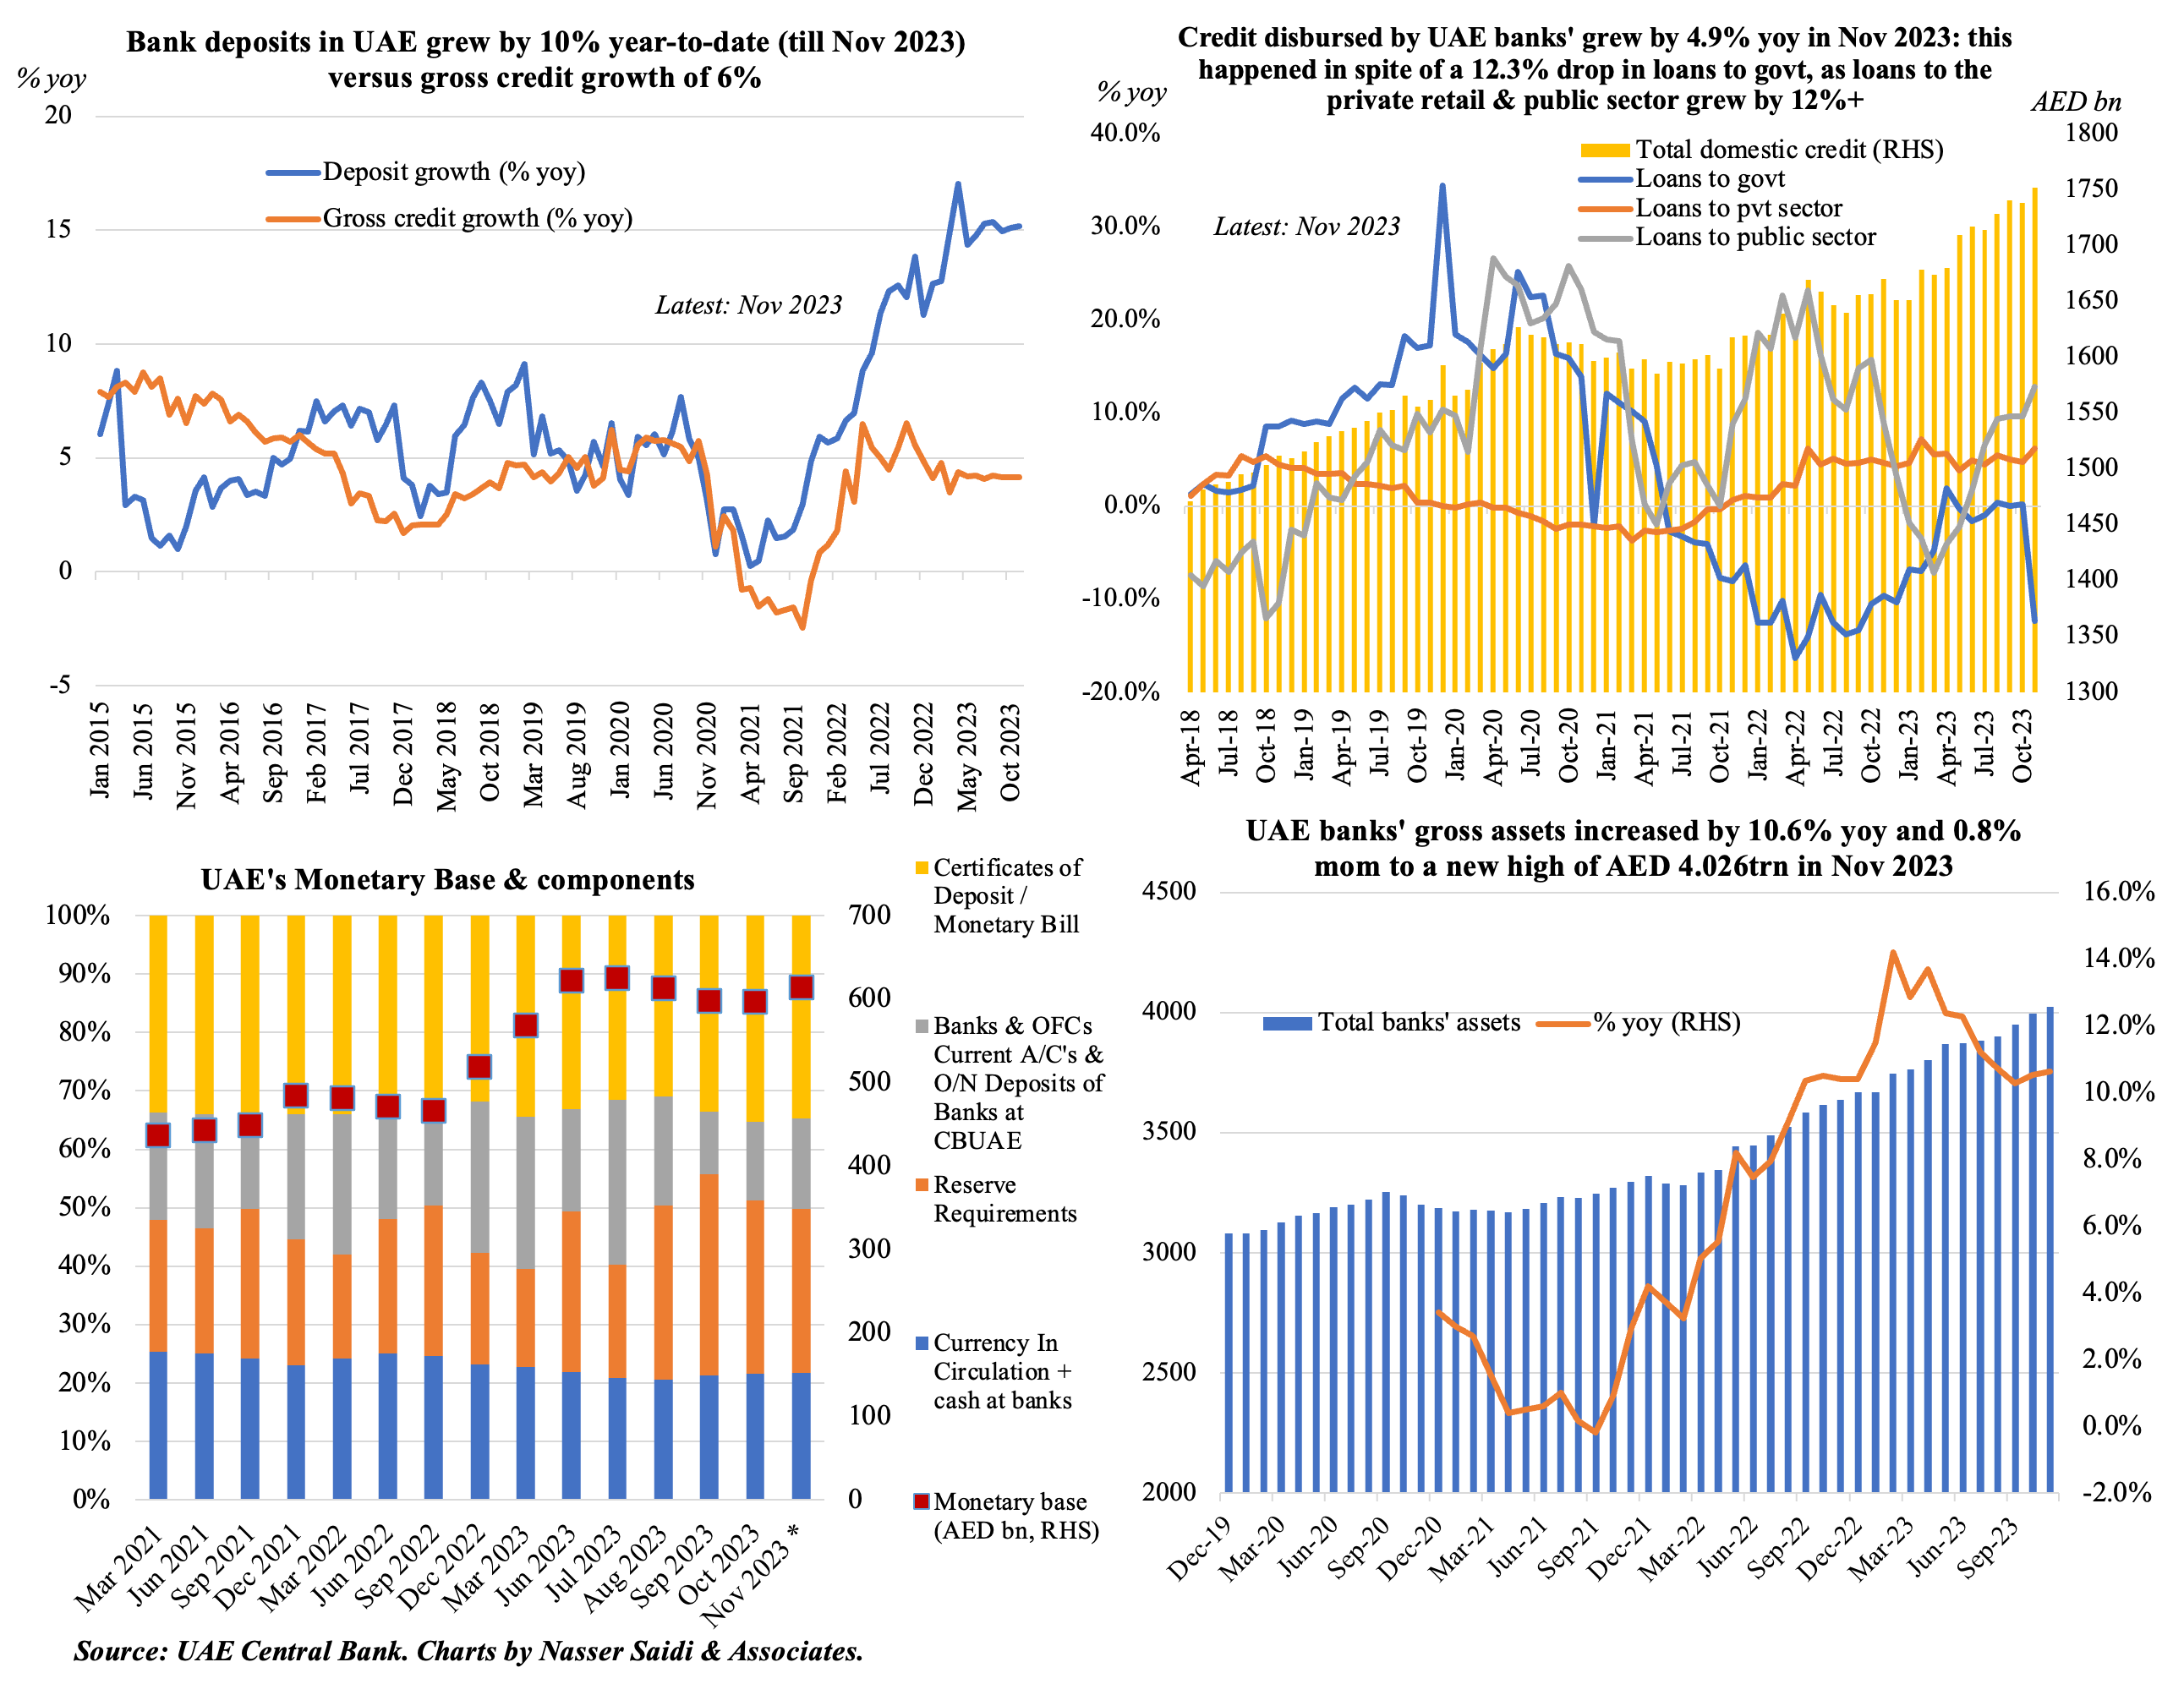
2. UAE bank assets crossed AED 4trn for the first time ever in Nov 2023. Monetary base inched up by 2.9% mom to AED 613.9bn, ticking up after 3 months of easing. Credit to the government plunged by 12.3% ytd to AED 185.7bn while business & industrial credit inched up by 4.8% to AED 836.5bn. Deposits grew 10% ytd, supported by a 15.9% rise in resident private sector deposits
3. Dubai welcomed 15.4mn international visitors in Jan-Nov 2023
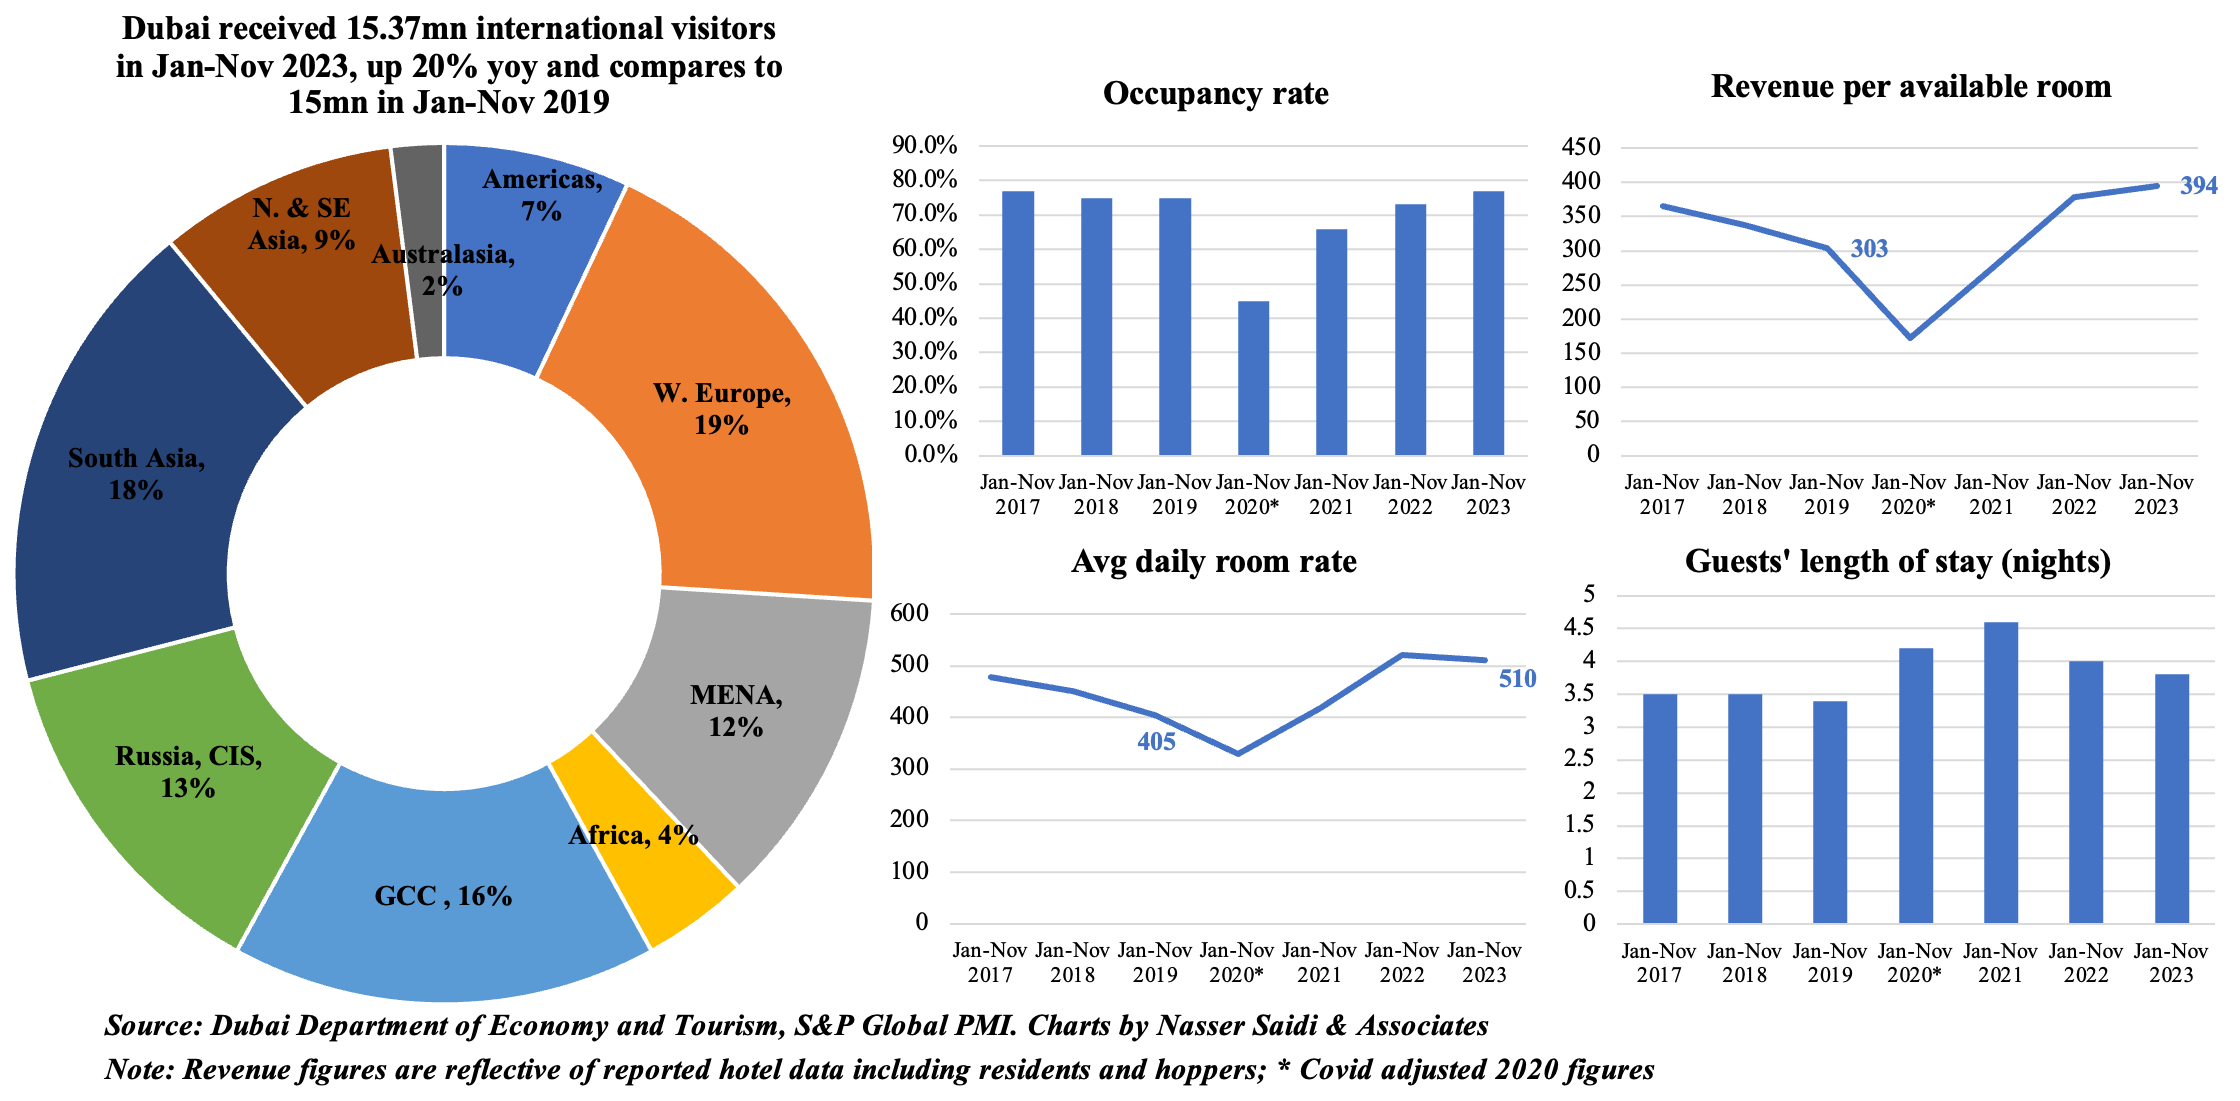
- Dubai recorded 15.4mn international visitors in Jan-Nov 2023: this was up 20% yoy & 2.5% higher compared to Jan-Nov 2019
- Regional composition of tourists remained broadly unchanged: GCC & MENA region accounted for 28% of visitors in Jan-Nov 2023.
- At end-Nov 2023, there were 149,680 hotel rooms across 820 establishments in Dubai. Hotel occupancy rate at 77% was higher than 2019’s 75%; revenue per available room remains high (AED 394 vs AED 203 pre-Covid) while room rates have fallen (-2.1% yoy to AED 510) & so has length of stay (3.8 from 4.0).
- Going by the latest Dubai PMI numbers and recent marketing campaigns by the emirate, tourism numbers are likely to pick up further in Dec-Jan. To give an example, the “world’s coolest winter” tourism campaign was launched this month: tourists numbers had risen by 8% to 1.4mn during this campaign’s previous edition.
4. Remittances fell by 5.3% yoy to USD 61bn in Middle East & North Africa last year; forecast to grow to USD 62bn in 2024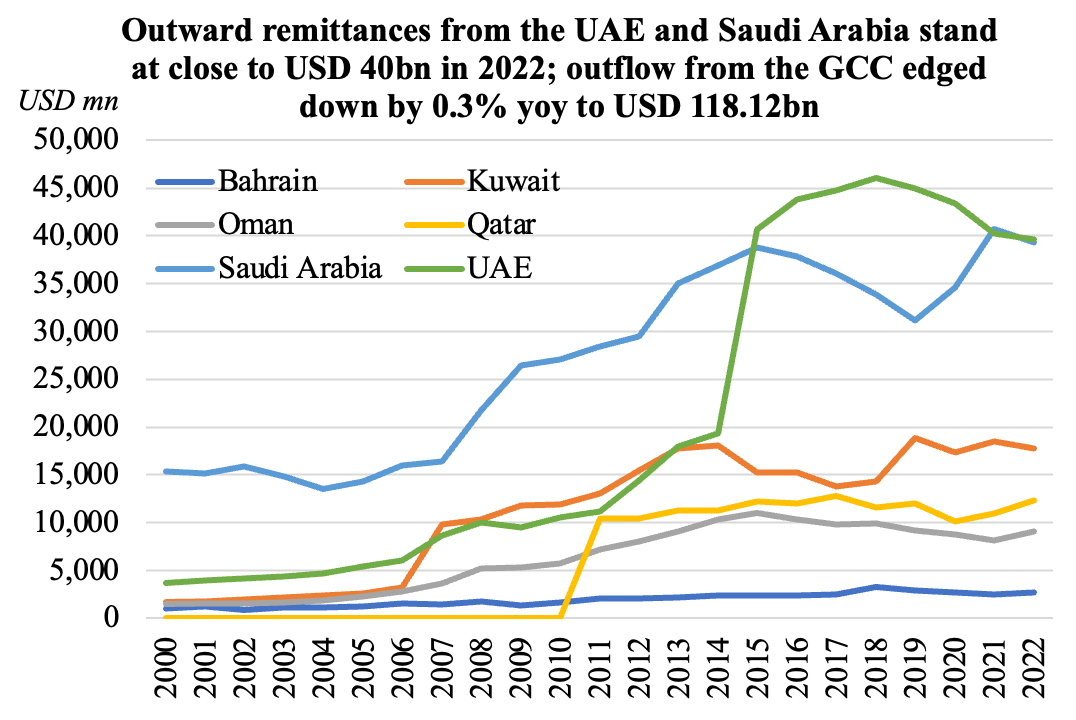
- Remittances inflows into MENA declined by 5.3% yoy in 2023 (compares to a 3% uptick globally). The widening gap between the official & black market exchange rates in some countries (Egypt, Lebanon) led to a shift to flows via unofficial channels.
- In 2024, MENA remittance inflows are forecast to edge up by 2.1%, but the outlook depends on geopolitical uncertainty, exposure to higher energy/ food prices, fiscal and external financial difficulties.
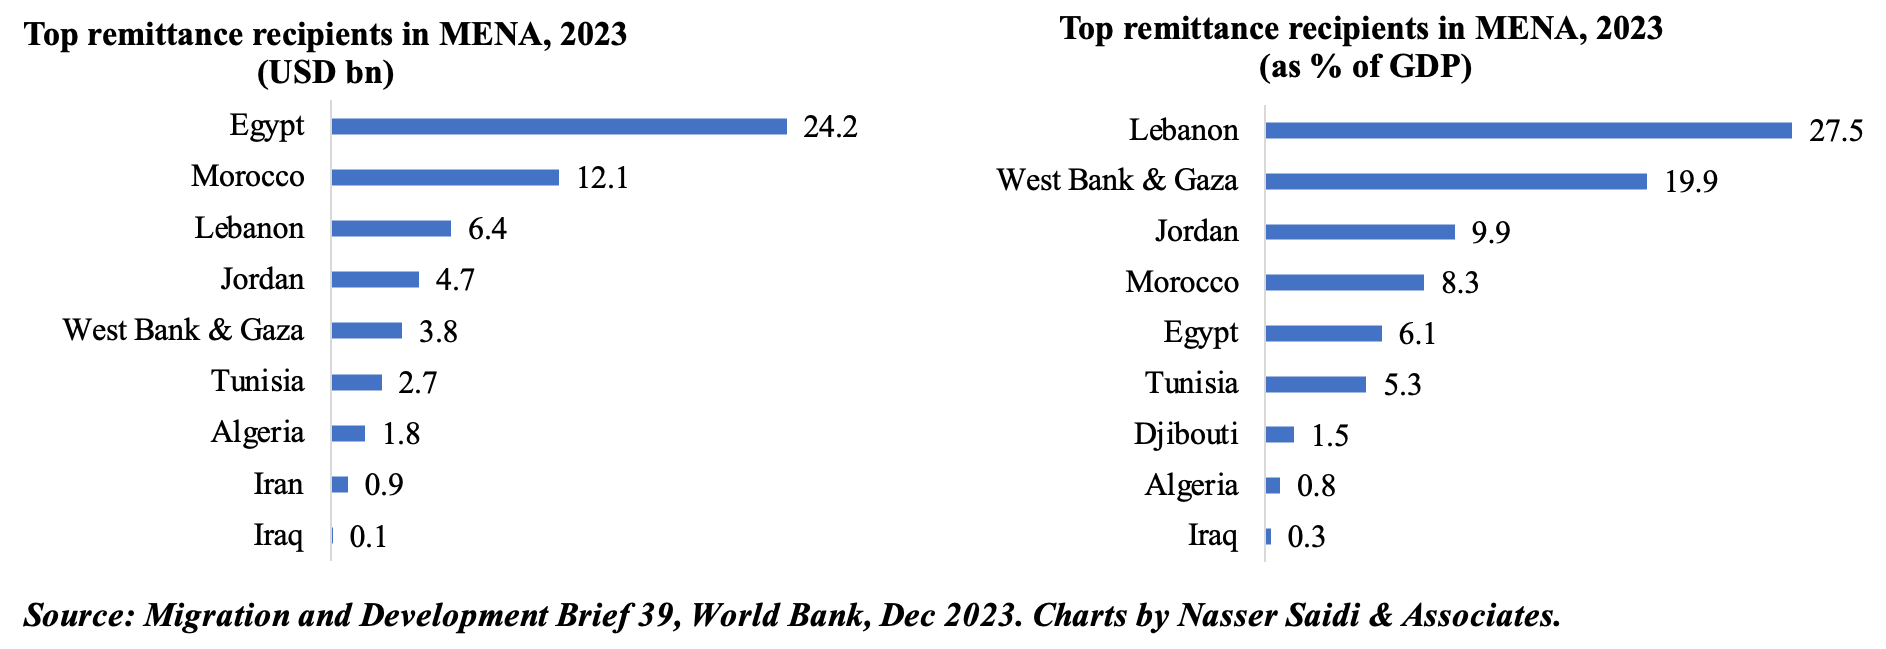
- Egypt is still the largest remittance recipient in MENA, but it declined by an estimated 14.5% last year (following a 10% drop in 2022).
- While US remained the largest source of remittances, UAE, Saudi Arabia, Switzerland and China were among the top 5. However, the latest report issued a word of caution that a few nations like the UAE and Switzerland (among others) are offshore financial centres (that could overstate size of outflows).
- Lebanon and West Bank & Gaza were the most dependent on remittances in 2023: 27.5% and 19.9% of GDP respectively.
5. Conflicts & Spillovers in the Middle East
- Potential spillovers: risks are high. In addition to Israel-Hamas war, there have been US & UK air strikes on Houthis in Yemen, Iran strikes on Iraq, Pakistan and Syria.
- So far, there has been only a modest effect on oil prices. Why? No loss of supply + growing non-OPEC supply (to balance OPEC+ cuts) + modest demand. While an oil price shock now may hit the global economy differently than before (thanks to declining energy intensity, increased supply of renewables etc), it could still be substantial on a global basis.
- Conflict is impacting markets: capital outflows, lower FDI inflows + greater financial uncertainty.
- Tourism, hospitality, construction/real estateare sectors most vulnerable to conflict risks and spillover effects. Steep declines in tourist bookings in Q1 2024 reported in Egypt & Jordan. Cruise companies (e.g., MSC Cruises, Silversea Cruises) are canceling stops and trips scheduled via the Middle East (through the Red Sea).
- Trade disruption has spread => potential impact on energy + food prices.
- Companies operating container ships have already been diverted away. More ships including dry bulk carriers are beginning to change course from the Red Sea route.
- What does this mean? Longer routes translate into higher shipping costs and delays in receiving shipments – raising concerns of inflation. Separately, it will eat into Egypt’s Suez Canal revenues (in 2023, it collected USD 9.4bn) and raise already high macroeconomic risks.
Bottomline: the longer the Israel-Palestine war and with growing spill-over risks, the higher the chances of slower growth & record-high public debt levels evolving into crisis modes. There will be rising inflationary pressure, which in turn will affect central bank’s monetary easing plans and hence growth. For now, data including shipping rates, delays and supply chain pressure index are showing a much smaller impact than seen during the pandemic.
Powered by:
![]()