

GCC PMIs. Bahrain & Saudi Arabia’s GDP, Saudi & UAE monetary stats, Saudi unemployment.
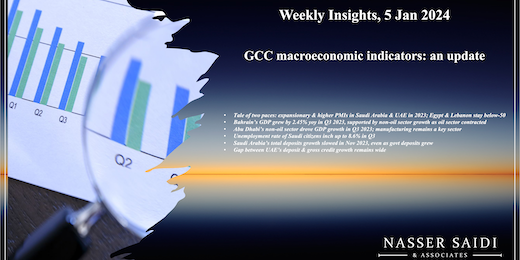
Weekly Insights 5 Jan 2024: GCC macroeconomic indicators – an update
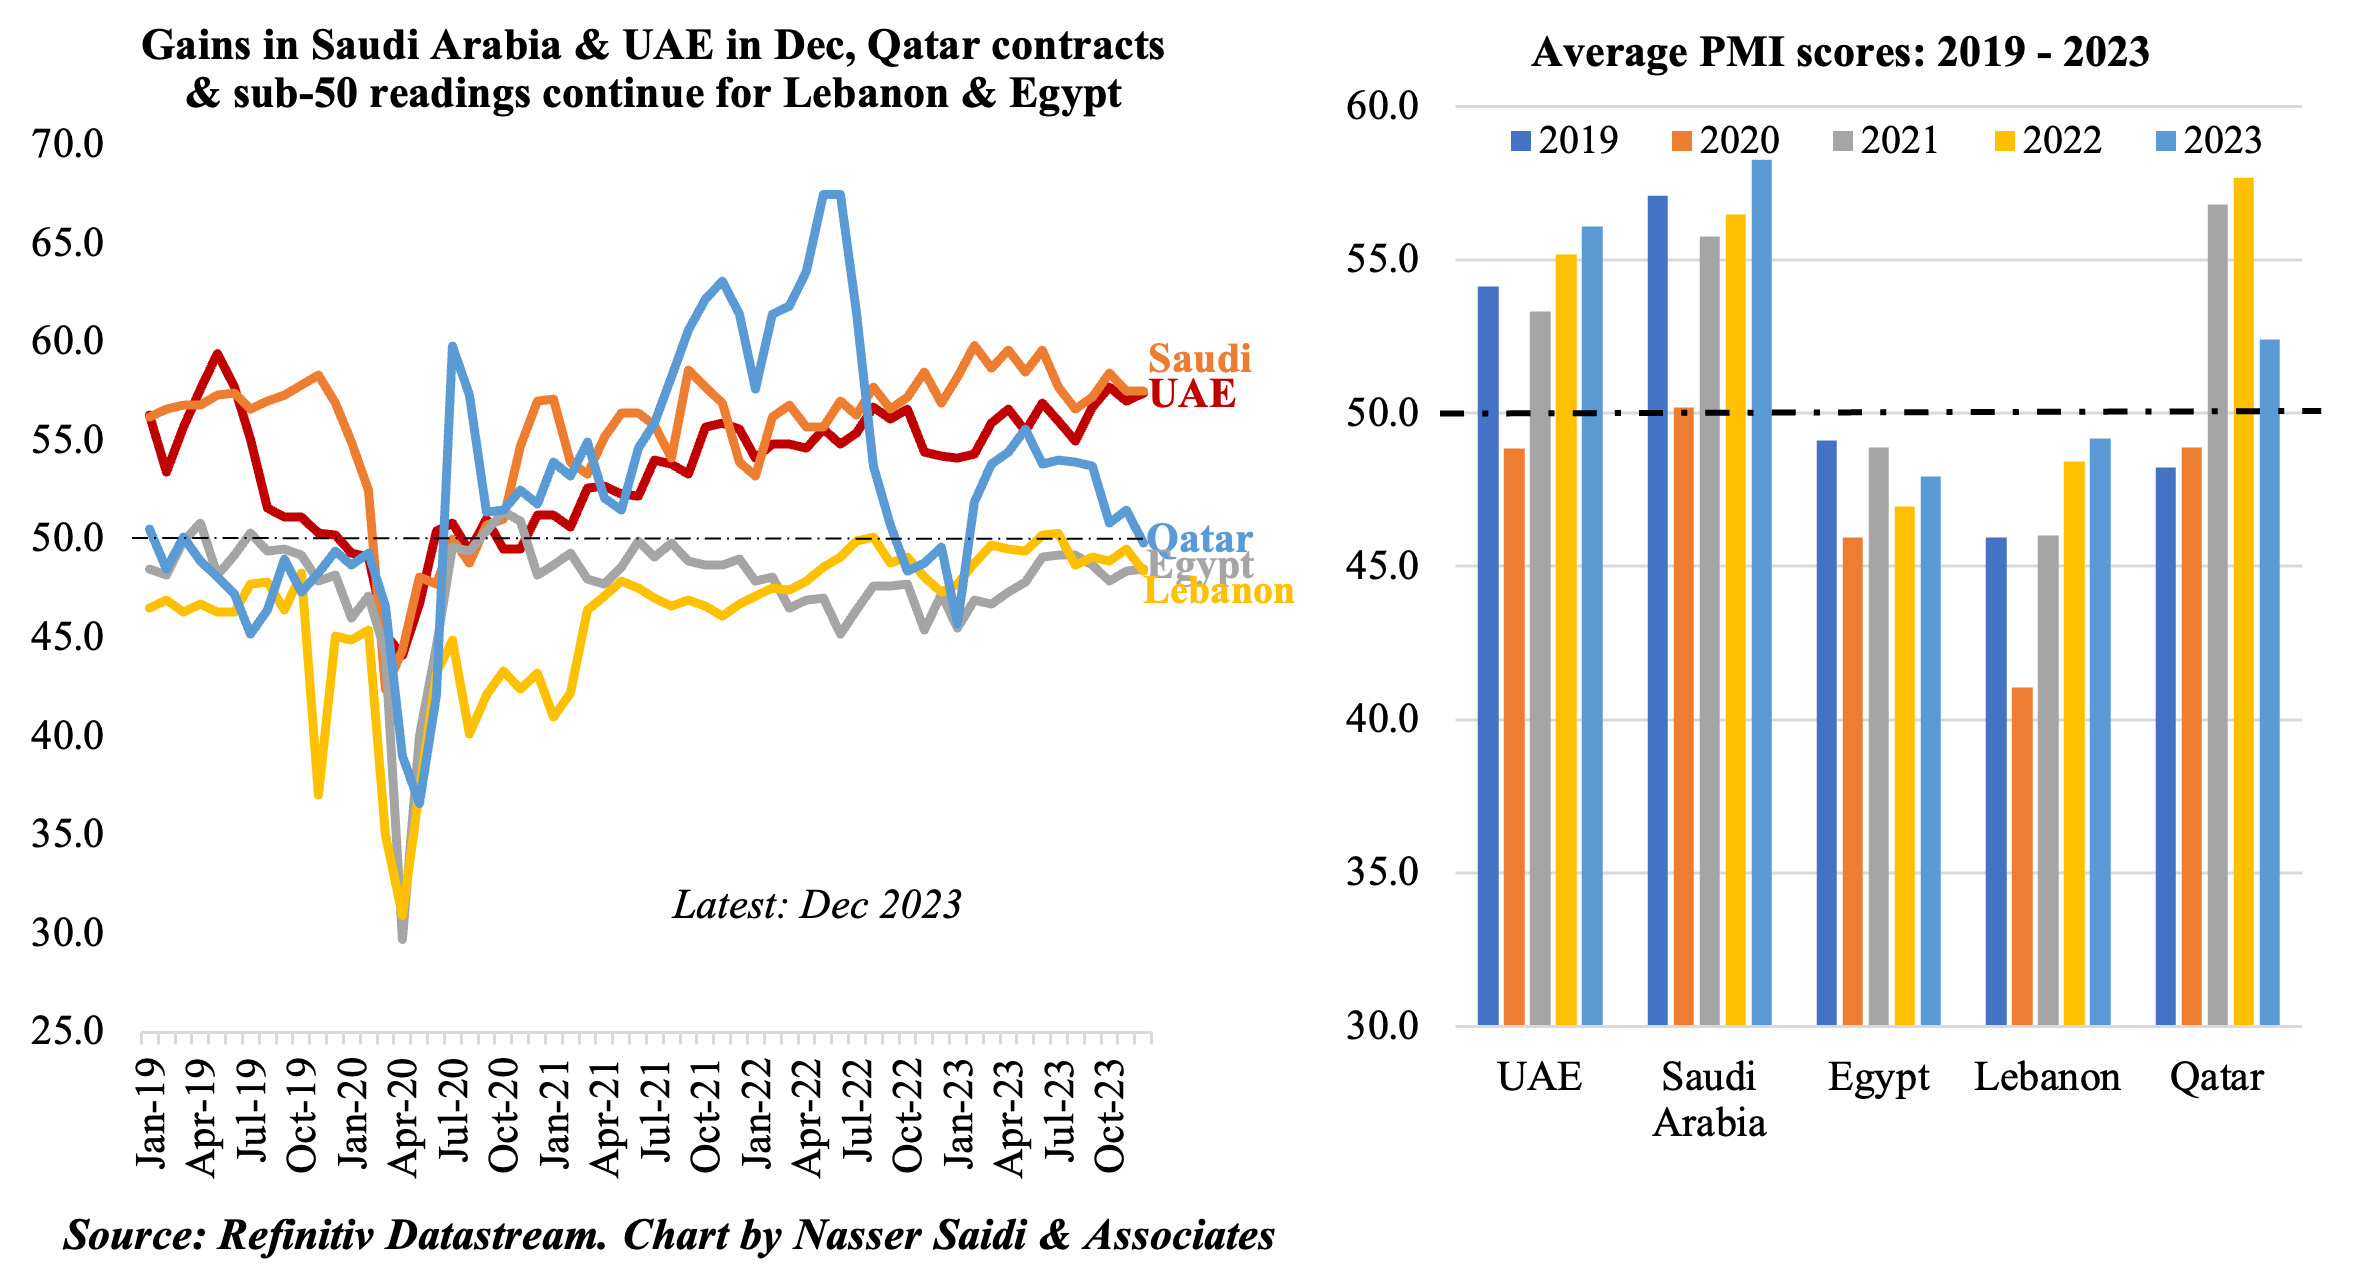
1. Tale of two paces: expansionary & higher PMIs in Saudi and UAE in 2023; contractionary in Egypt & Lebanon
- When comparing PMI readings, all Middle East countries except Qatar post gains in 2023 (vs 2022), with KSA gaining the most (1.8 points). Even Egypt and Lebanon gain (1.0 and 0.8 points respectively) despite the readings remaining in contraction territory.
- UAE and KSA reported increases in output and new orders in Dec, with Saudi also witnessing foreign sales gaining the most since Jul. In contrasting patterns, UAE selling prices dropped (at the fastest pace since Jul) as firms offered discounts to remain competitive while Saudi firms passed on its rising input costs (from material prices and staff costs) with customers. Additionally, while output expectations strengthened for UAE firms (given robust sales pipelines), sentiment weakened in Saudi.
- Qatar PMI fell below-50 in Dec, after 10 months of remaining expansionary, as activity and new orders eased. In 2023, average PMI stood at 50.7 (2022: 53.9).
- Egypt’s PMI stayed under-50 for the 37th consecutive month in Dec, as firms were dragged down by worsening economic conditions (exchange rate weakness, high inflation levels in spite of recent softening, supply shortages, decline in consumer demand…). Lebanon’s decline in Dec was partly given the impact from the Israel-Hamas (e.g., tourism during the year-end holidays) and sharp declines in output & new orders.
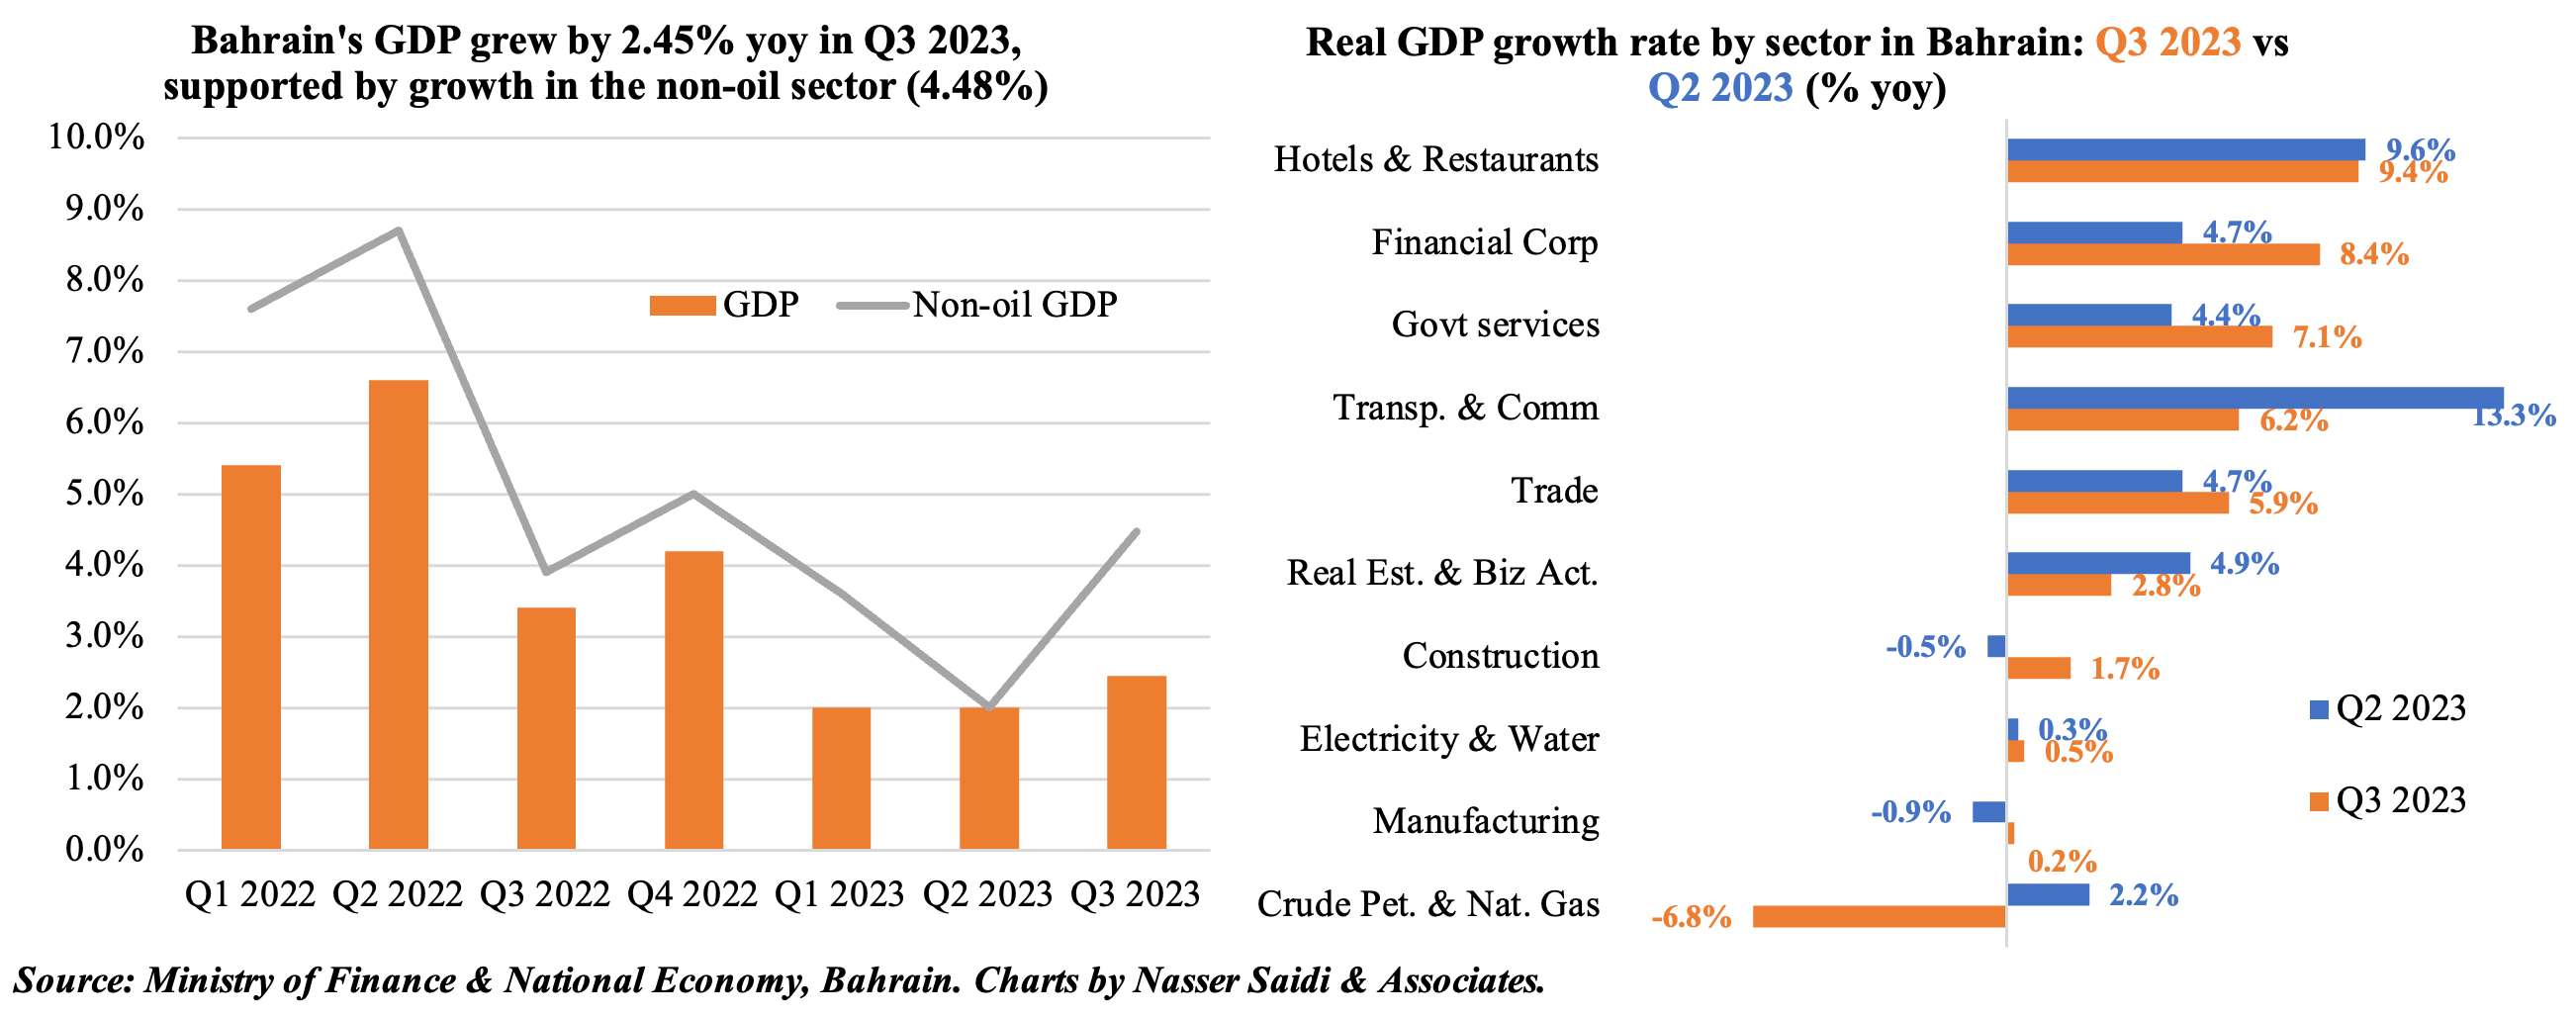
2. Bahrain’s GDP grew by 2.45% yoy in Q3 2023, supported by non-oil sector growth (Q3: 4.48%) as oil sector contracted (Q3: -6.77%)
- Real GDP in Bahrain grew by 2.5% yoy to BHD 3.39mn in Q2 2023 (Q1: 2%), with non-oil sector growing by 4.48% while oil sector contracted by 6.8%. The Ministry of Finance and National Economy projects an annual real GDP growth of 2.6% and 3.5% in 2023 and 2024 respectively, driven primarily by the non-oil sector (+3.4% and 3.9% in 2023 and 2024).
- Non-oil sector accounted for 83.6% of real GDP in Q3. Financial corporations were one of the largest non-oil sectors in Q3, contributing the most to GDP (18.08%), followed closely by manufacturing (13.85%).
- In yoy terms, growth was highest in hotels & restaurants in Q3 (9.36%), followed by financial corporations (8.36%) and transport & communication (6.2%) – underscoring the strength of the financial sector as well as tourism & hospitality sectors. Trade and real estate & business activities grew by 5.6% and 2.8% respectively.
- According to the Information and eGovernment Authority, FDI flows exceeded BHD 1.2bn during Q3 2023, while FDI stock reached BHD 15.9bn (+19.4% yoy).
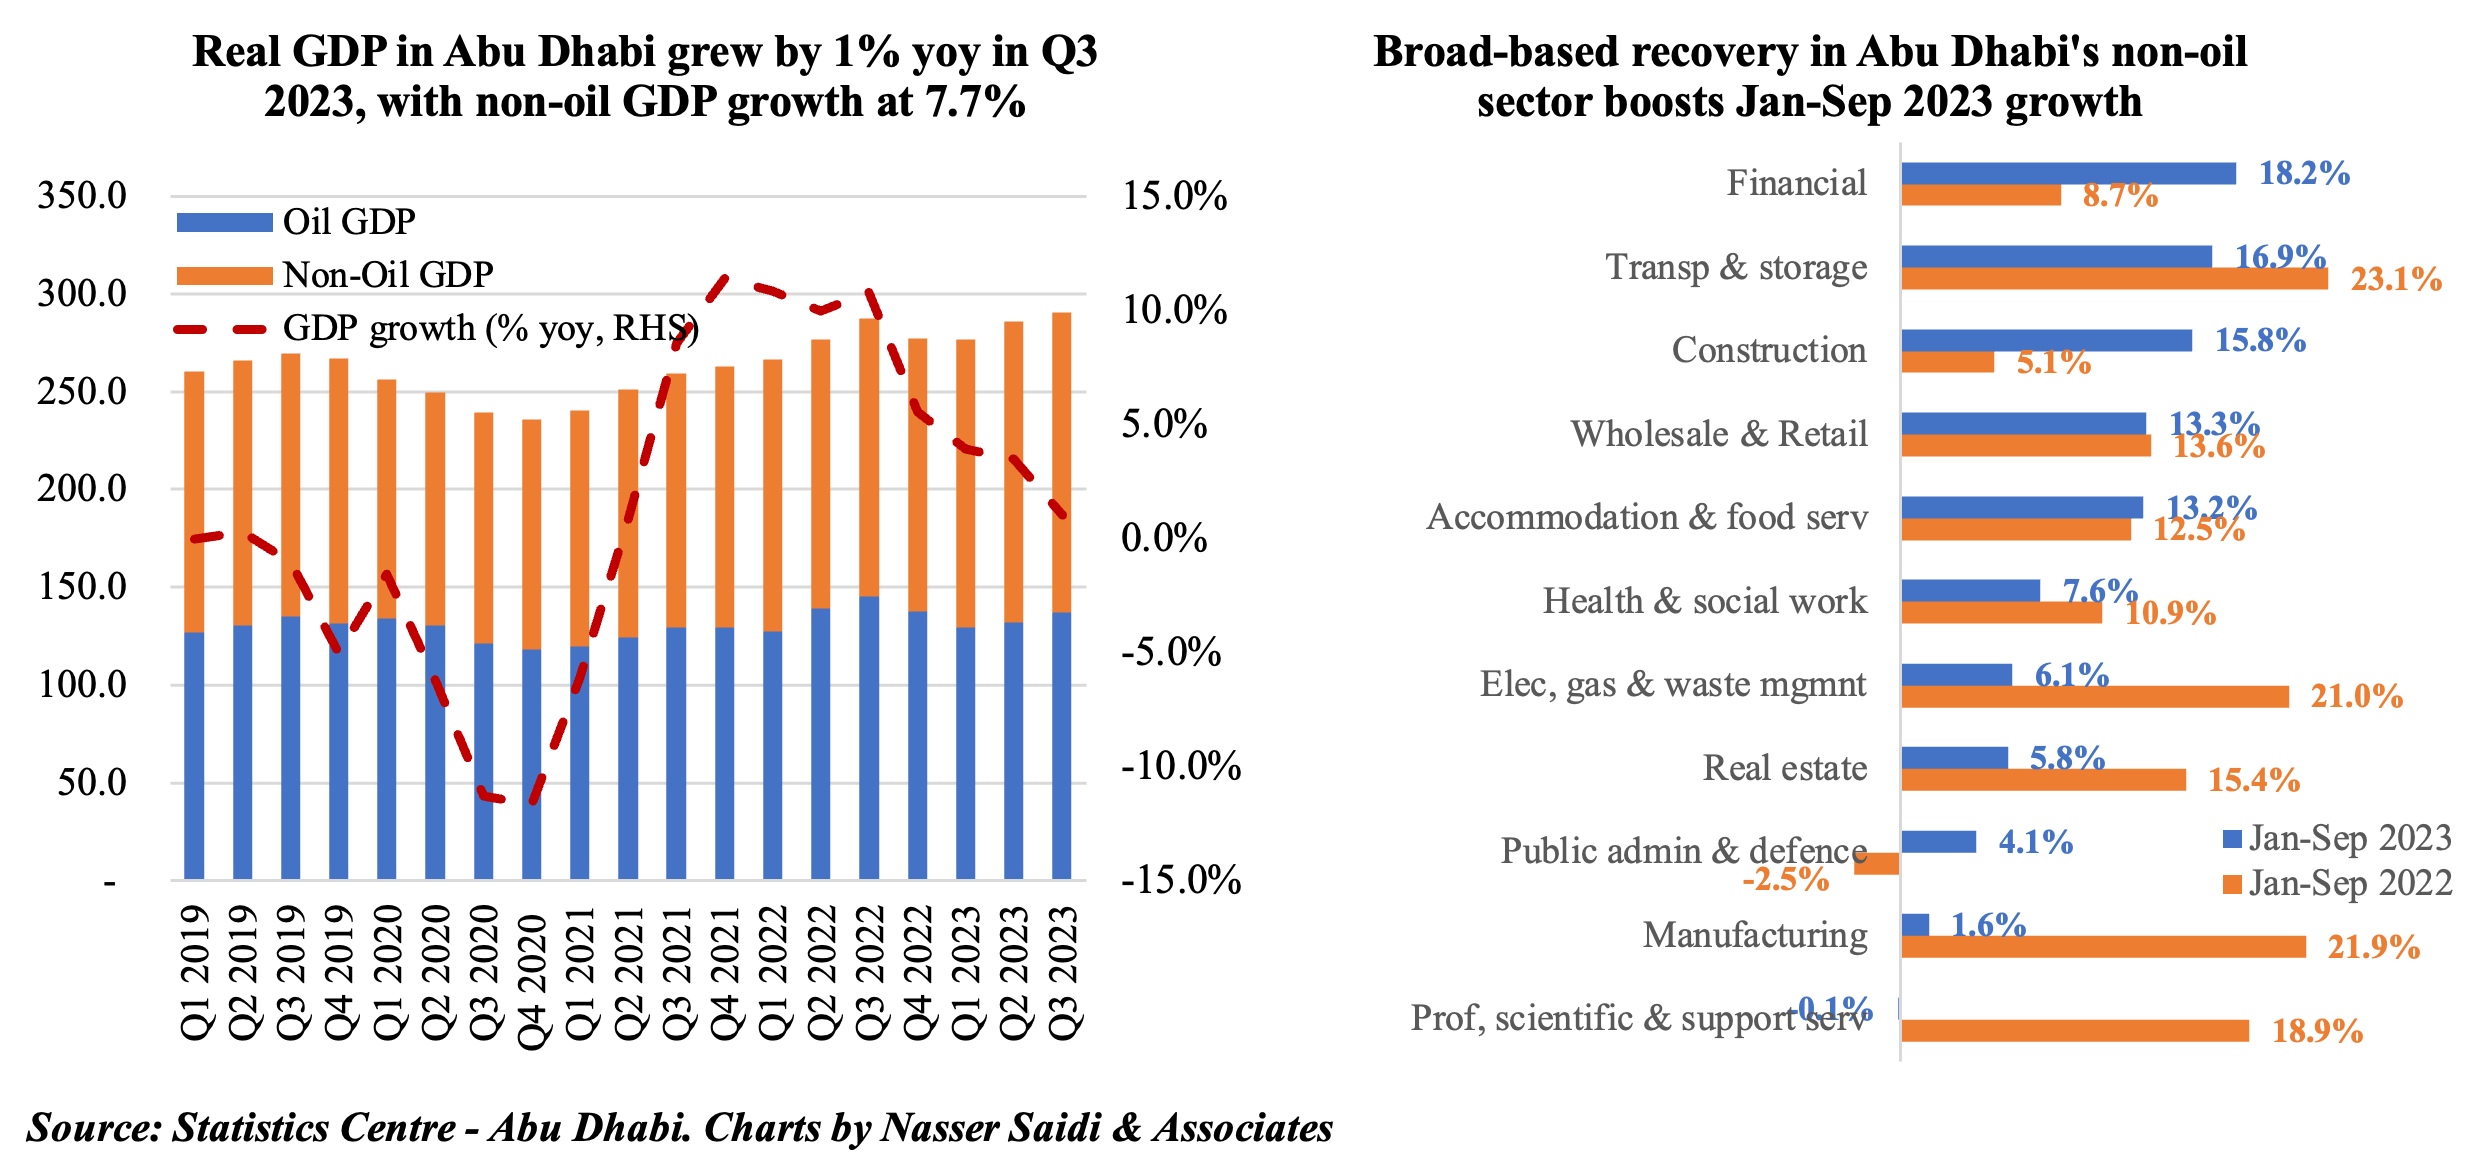
3. Abu Dhabi’s non-oil sector drove GDP growth in Q3 2023; manufacturing remains a key sector
- Real GDP in Abu Dhabi grew by 1% yoy in Q3 (Q2: 3.5%), bringing growth till Sep this year to 3.7% (Jan-Sep 2022: 10.5%). The non-oil sector grew by 7.75% yoy to AED 153.4bn in Q3, clocking in growth at 8.7% for the 9-month period Jan-Sep.
- Non-oil growth accounted for 52.8% of overall GDP; meanwhile, oil GDP fell sharply by 5.6% yoy to AED 137.2bn in Q3 from lower prices and production cuts.
- Manufacturing is a key non-oil sector in terms of economic activity: contributing 17% to non-oil GDP in Q3 & 9% to overall GDP – in line with Abu Dhabi’s Industrial Strategy (launched in Jun 2022) & goal to more than double the sector’s size to AED 172bn by 2031.
- In terms of growth by sector, transportation & storage grew the most in Q3 (20.0% yoy), followed by the financial sector (14.4%), followed by construction (14.3%) and wholesale and retail trade (12.7%).
- A breakdown of activity by sector for Jan-Sep 2023 shows that the biggest gains were recorded in financial sector (18.2% yoy), transport & storage (16.9%), construction (15.8%), wholesale and retail trade (13.3%) and accommodation & food services (13.2%).
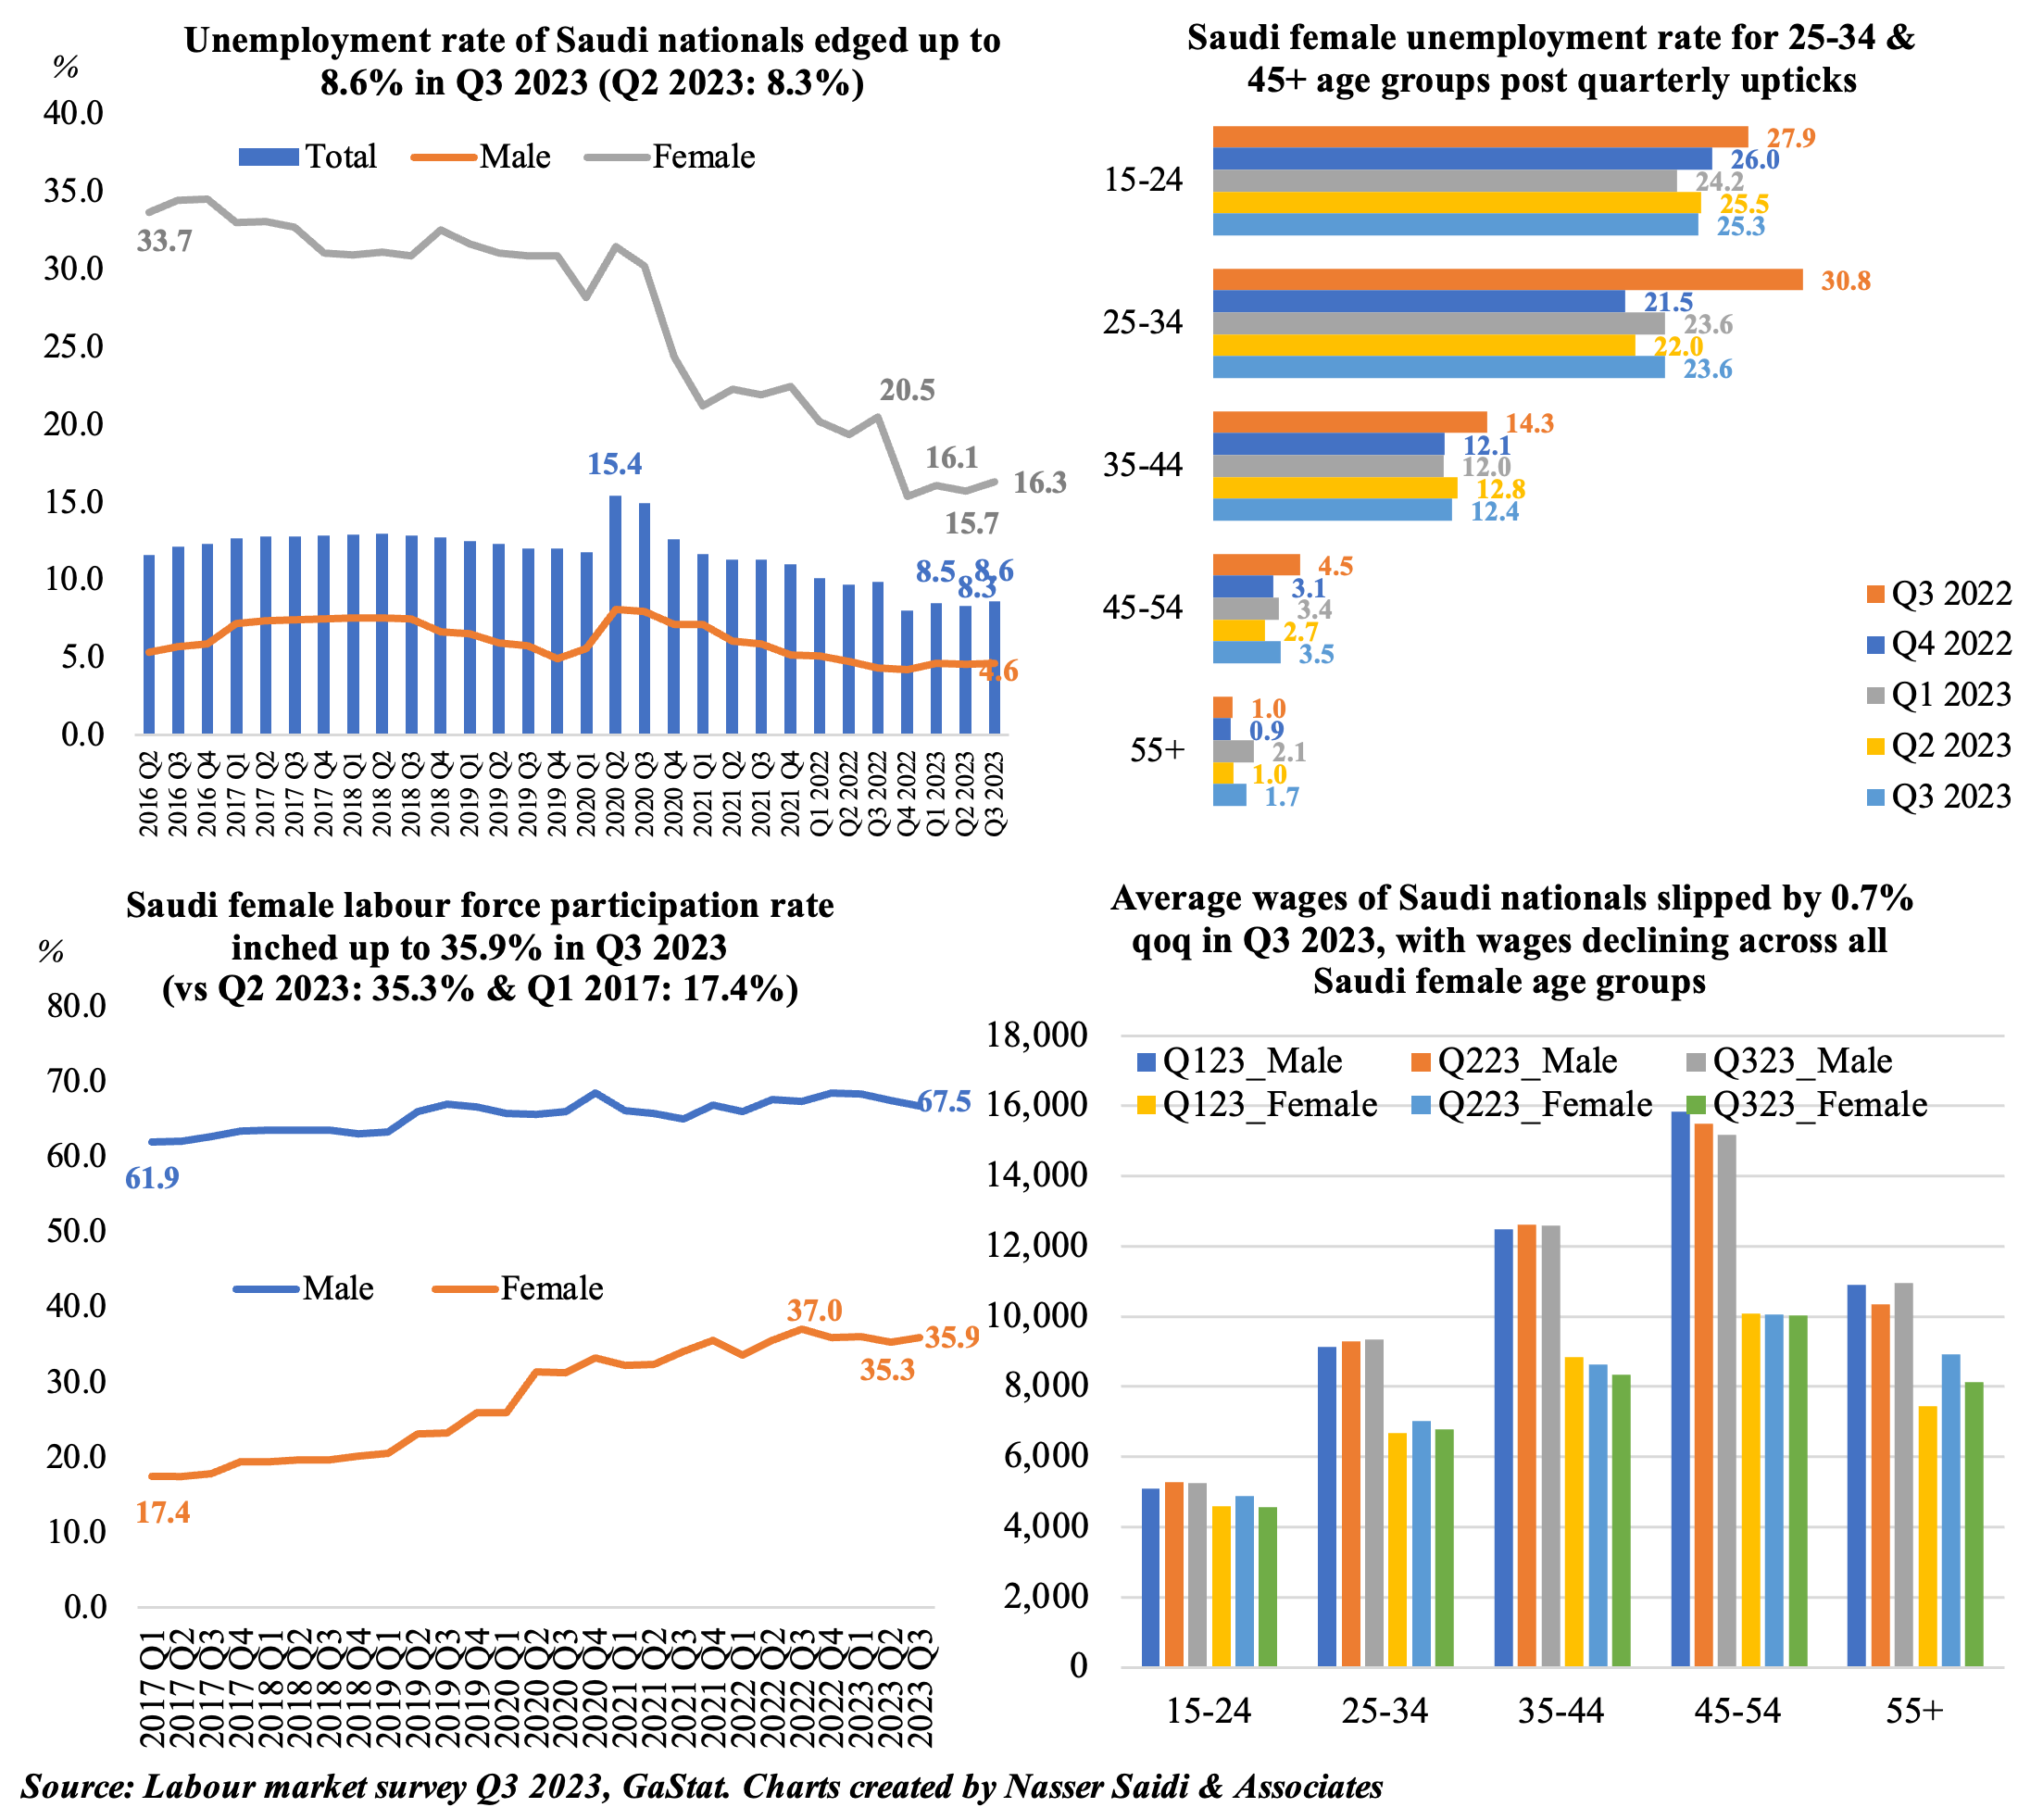
4. Unemployment rate of Saudi citizens inches up to 8.6% in Q3
- Unemployment rate in KSA (inclusive of expats) also rose in Q3, to 5.1% (Q2: 4.9%). Saudi citizens unemployment rate also rose to 8.6% (prev. quarter: 8.3%).
- Saudi female U rate climbed to 16.3% in Q3 (Q2: 15.7%); the 25-34, 45-55 and 55+ age groups saw quarterly upticks in rates.
- Saudi female labour force participation edged up slightly to 35.9% (Q2: 35.3%).
- Females’ wages (for citizens) fell by 3.1% qoq to SAR 7,613 in Q3, with wages of 55+ plunging by 9% qoq to SAR 8,127. However, the male-female wage gap remains highest in 35-54 age groups: when men earn 1.5X vs women.
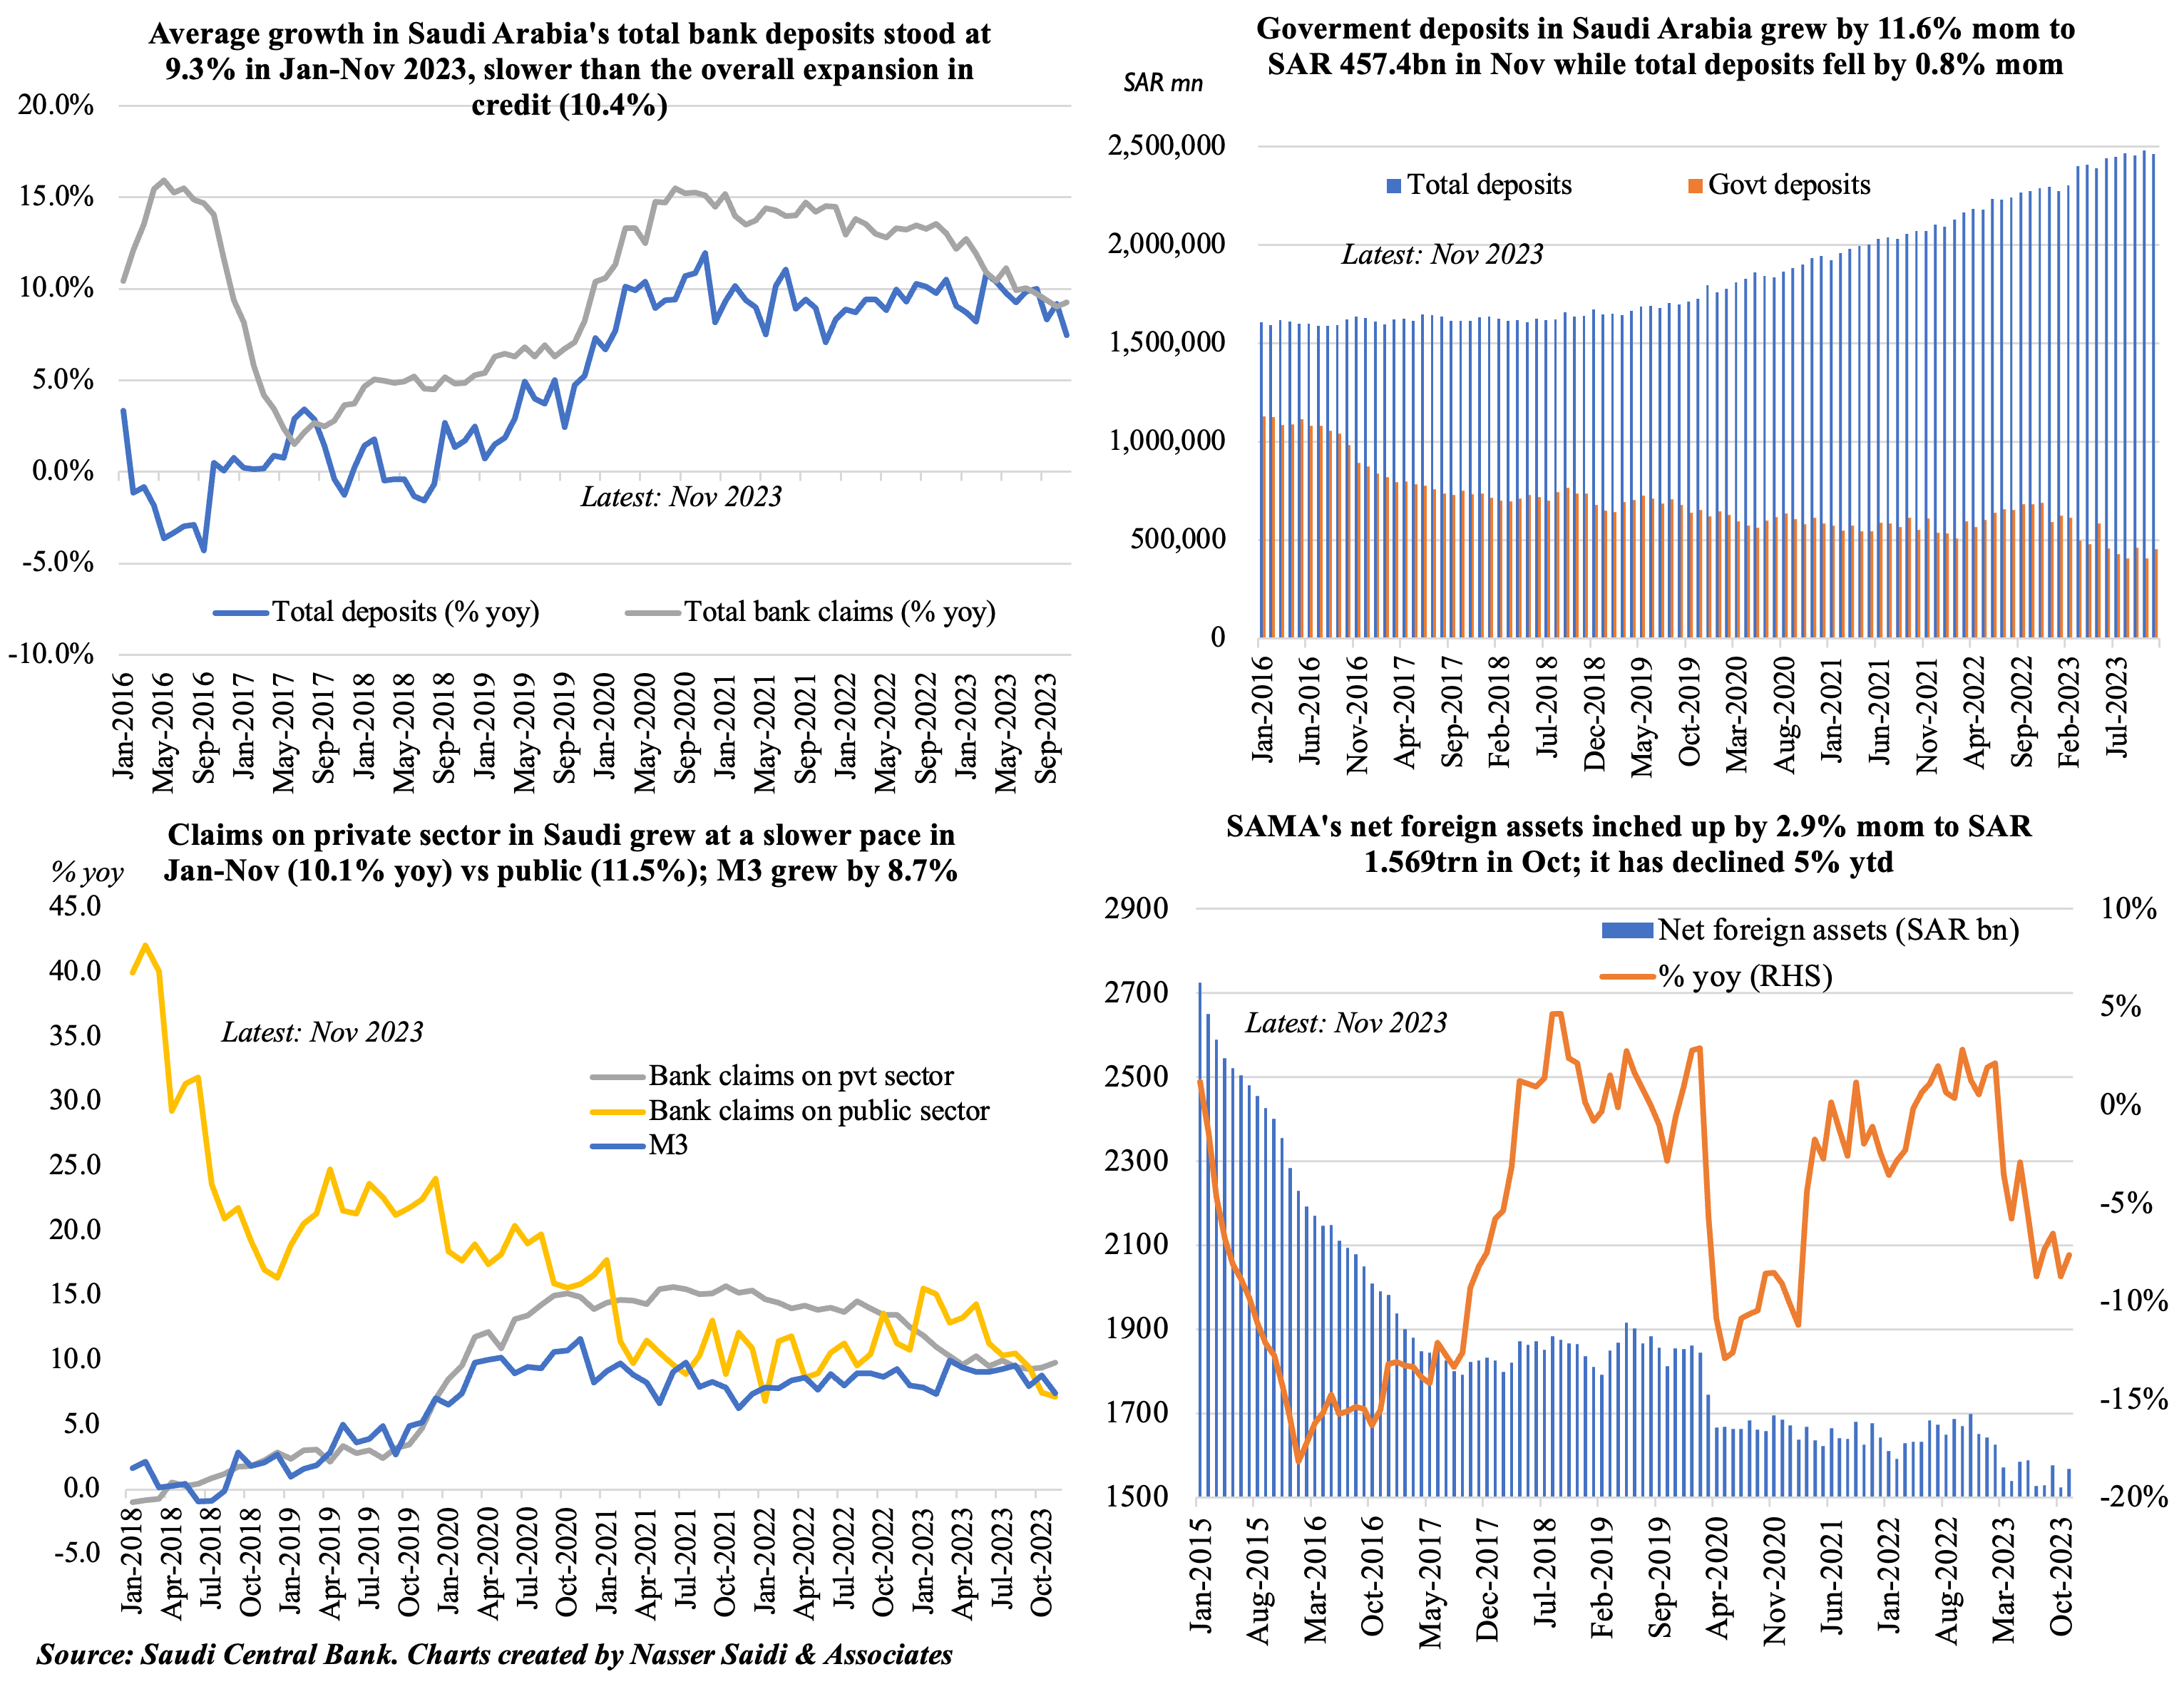
5. Saudi Arabia’s total deposits growth slowed in Nov 2023 (7.5% from Oct’s 9.2%), even as gov’t deposits grew (+11.6% mom); net foreign assets fell 5% year-to-date; claims on public sector outpace private
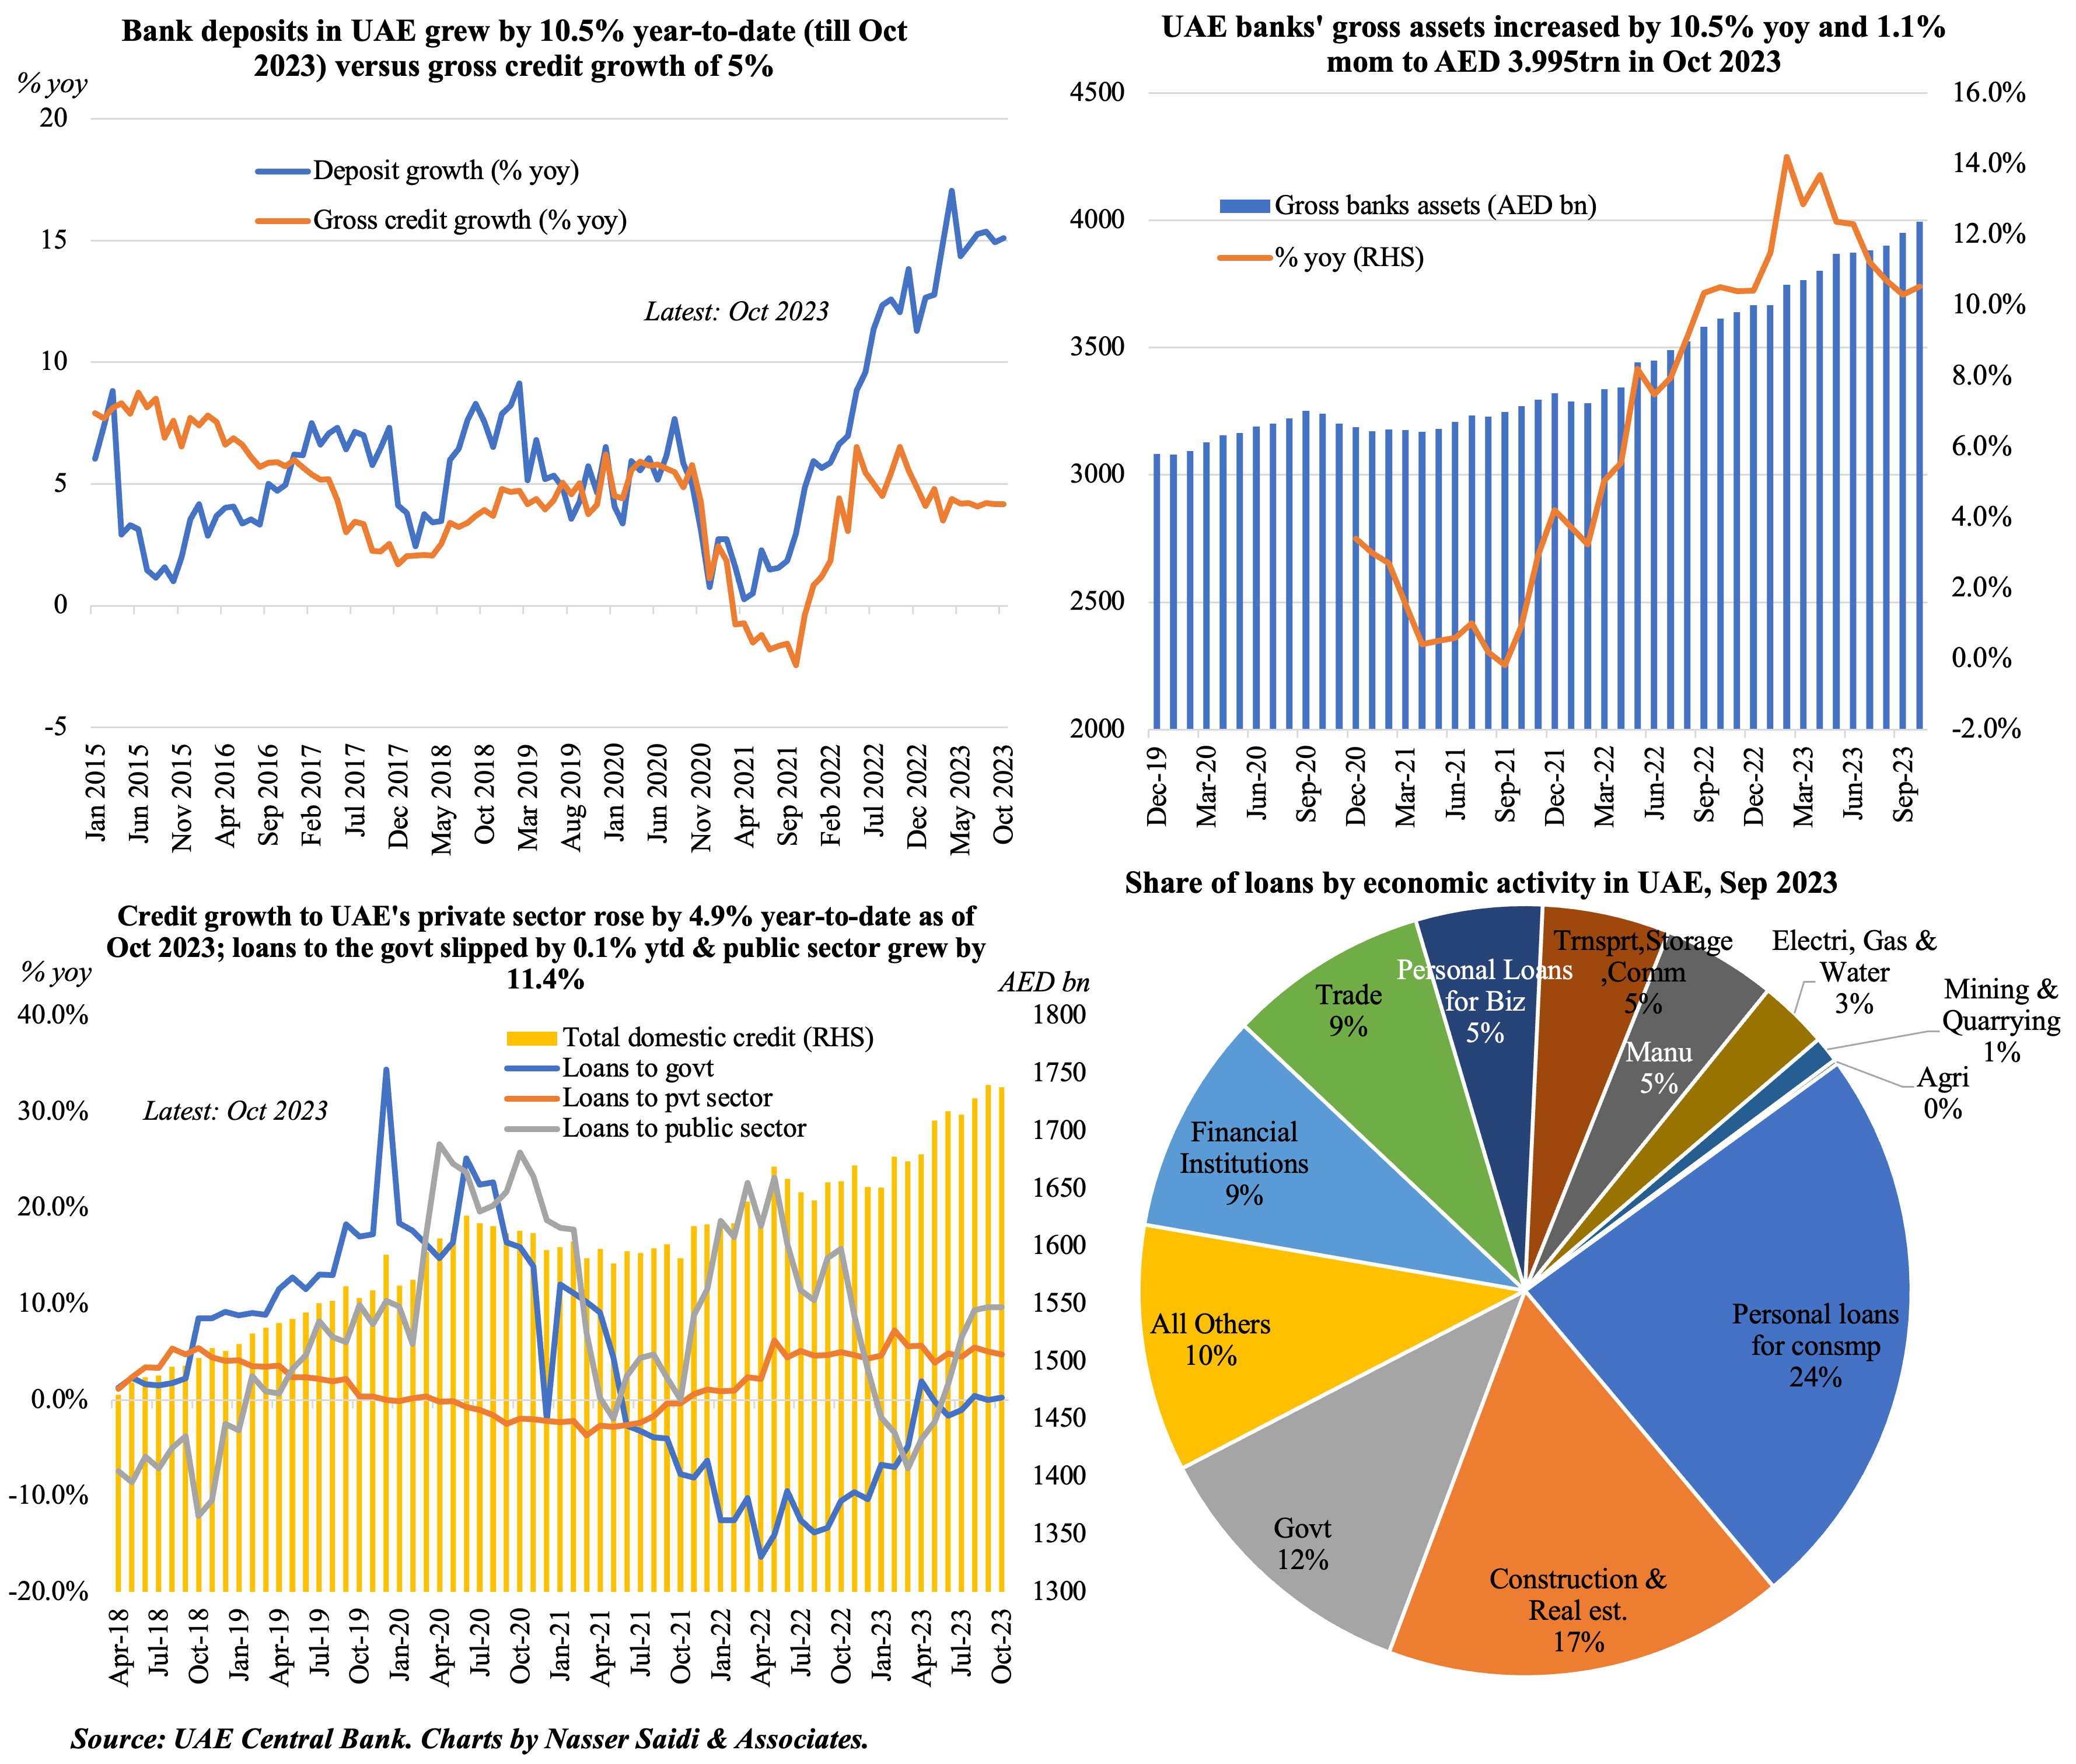
6. Gap between UAE’s deposit & gross credit growth remains wide; credit to public sector grew 11.4% ytd (as of Oct 2023) vs business & industrial credit (2.8%); loans to construction & real estate sector stood at 17% of total (as of Sep)
Powered by:
![]()