

Markets
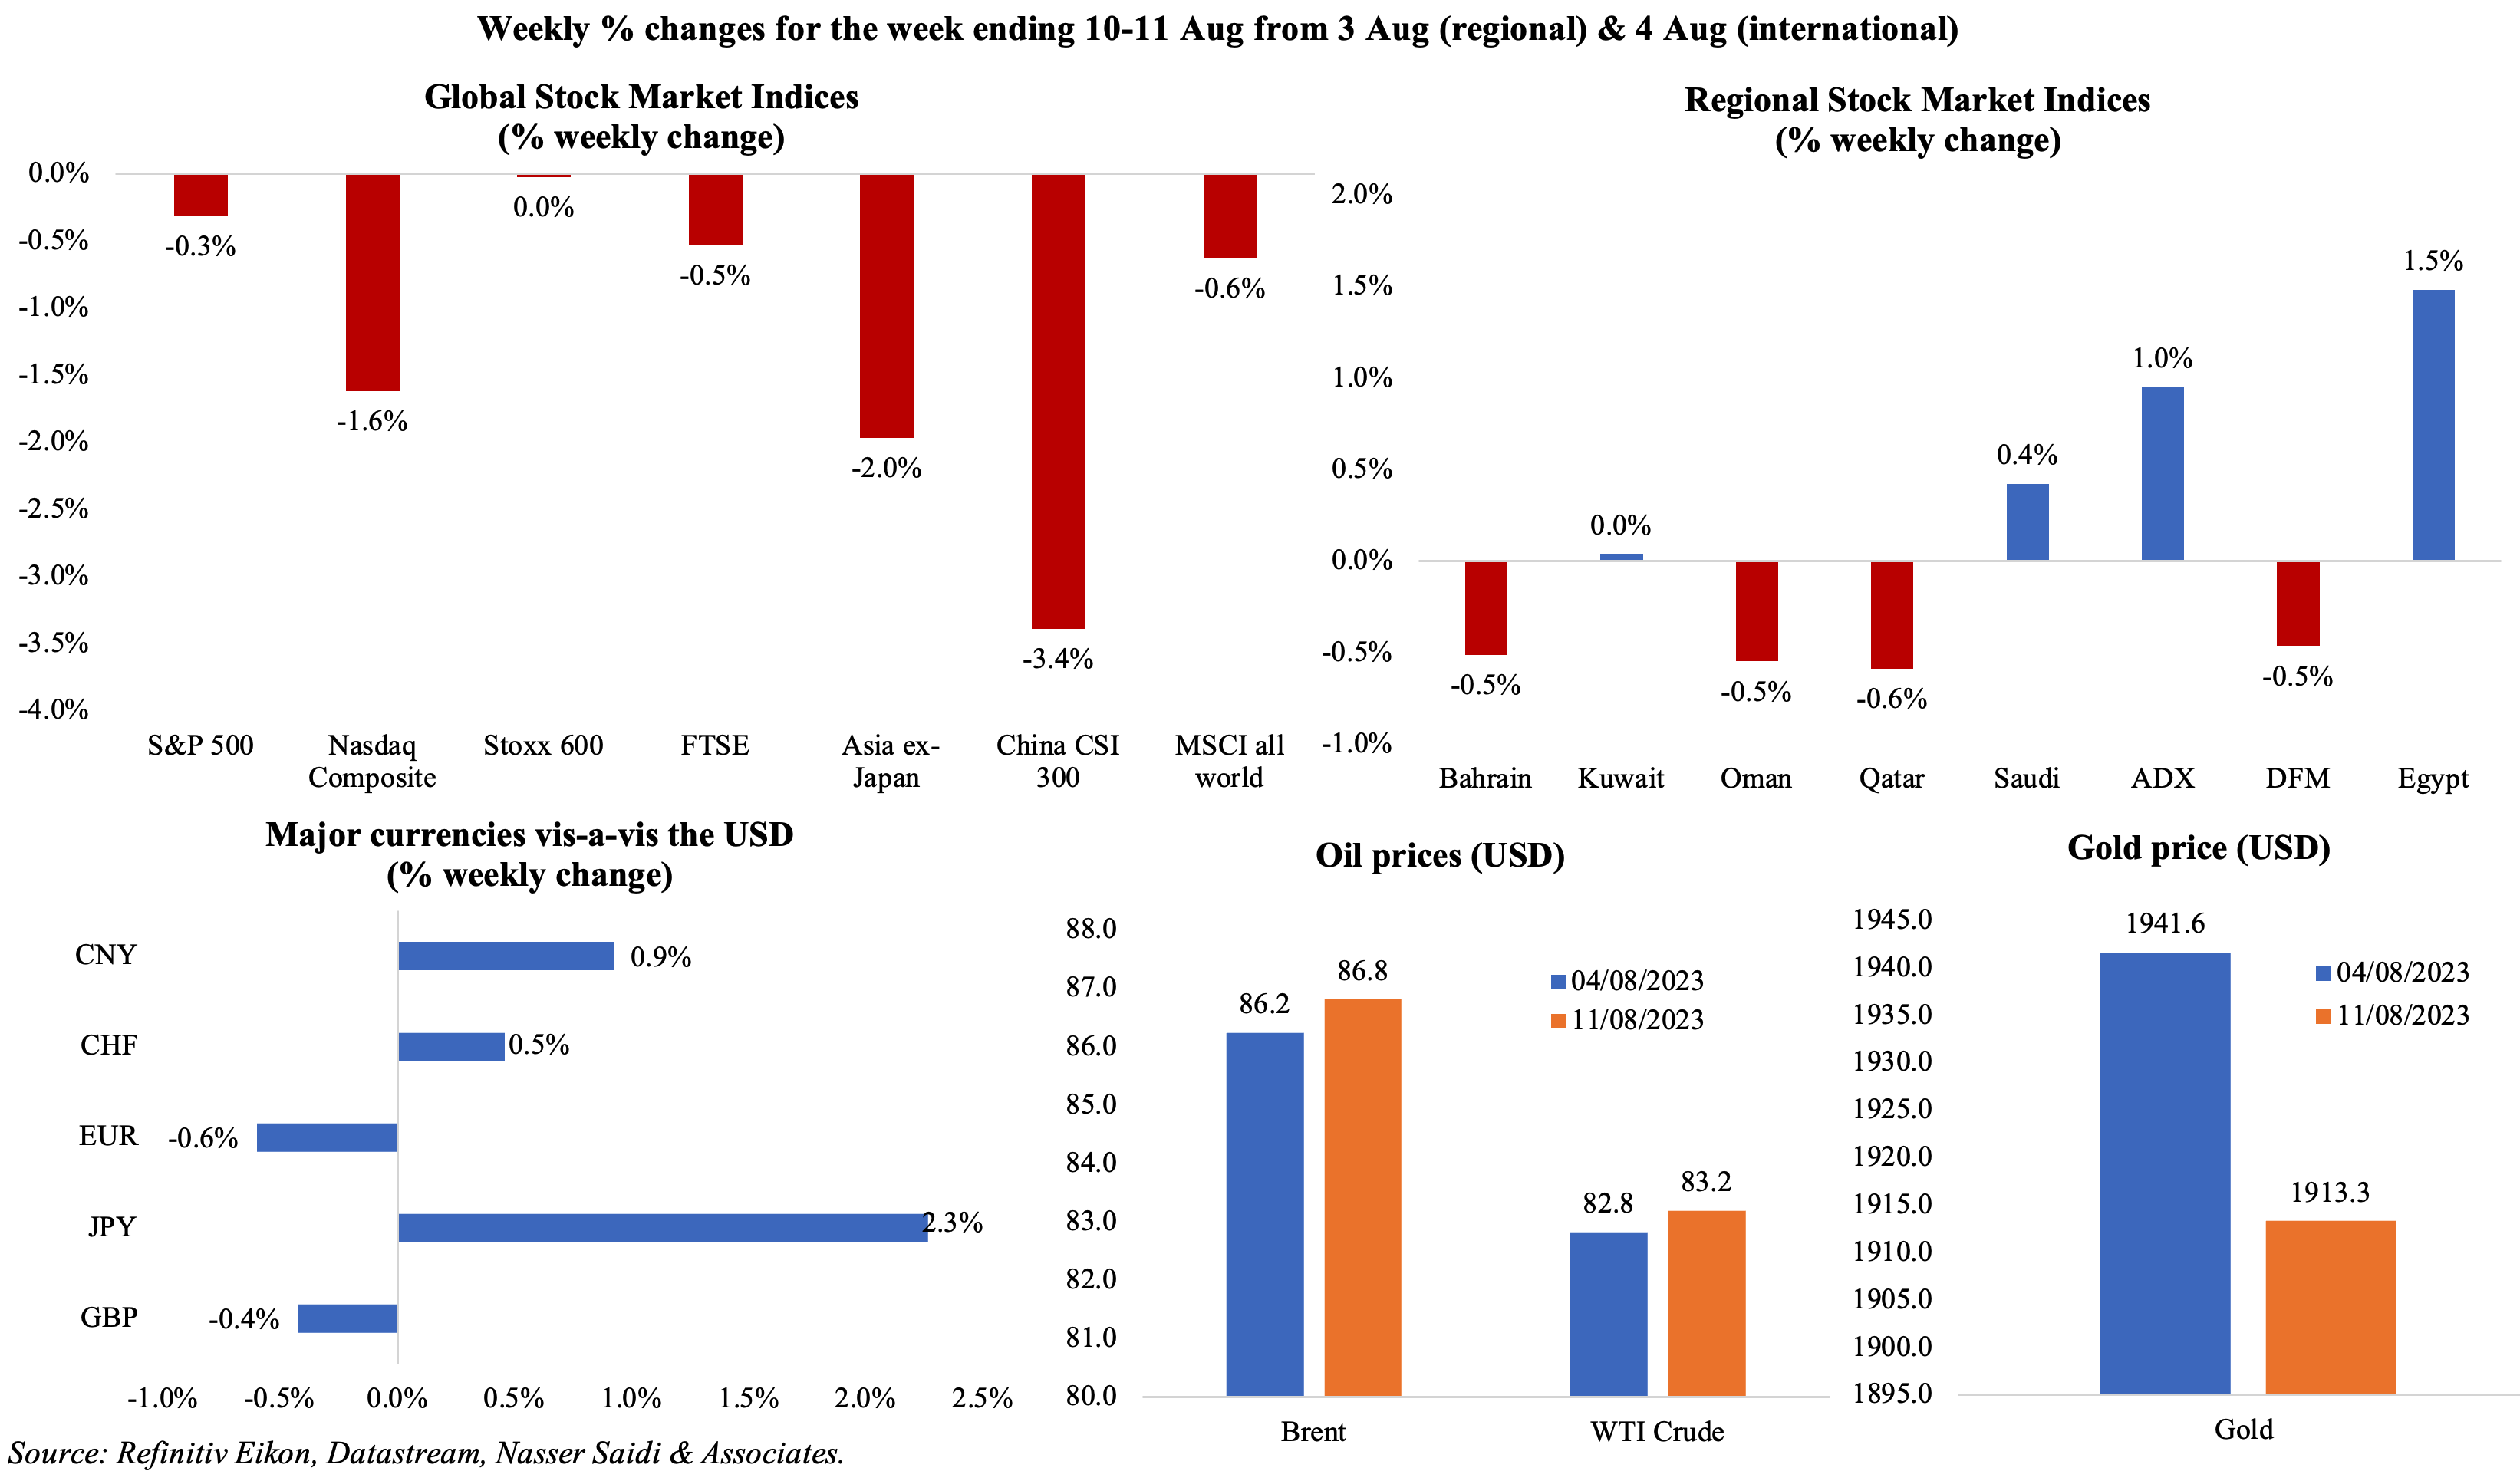
Markets continue to be dominated by news about inflation and the resulting monetary stance. US inflation inching up led to concerns that rates may be kept higher for longer, having a negative impact on global equities markets: both S&P and Nasdaq Composite fell for two weeks in a row (for the first time this year) while the MSCI all world index also posted its second consecutive weekly loss. Regional markets were mixed: Saudi gained on strong corporate earnings while UAE’s two indices moved in opposite directions. Among currencies, the Japanese Yen was prominent, with the dollar touching 145.00, its highest since June 30th. Oil prices inched up slightly after IEA’s forecast of tighter supplies alongside relatively upbeat global demand growth (also from the OPEC): this is the seventh week of gains, the longest such since 2022; gold price slipped.
Global Developments
US/Americas:
- Inflation in the US inched up to 3.2% yoy in Jul (Jun: 3%), the first uptick after 12 months of declines due to base effects. Transportation services were up 9% yoy while inflation slowed for food (4.9% vs 5.7% in Jun) and shelter (7.7% from 7.8%) and new vehicles (3.5% from 4.1%). Core inflation edged down to 4.7% in Jul (Jun: 4.8%), the lowest level since Oct 2021.
- Producer price index rose by 0.3% mom and 0.8% yoy in Jul as services costs and rebounded (+0.5%, the largest uptick since Aug 2022) while cost of food also rebounded (0.5%) alongside a flat energy price reading. Excluding food and energy, PPI gained by 0.2%.
- Michigan consumer sentiment index edged lower to 71.2 in Aug (Jul: 71.6, the highest reading since Oct 2021) as the expectations sub-index weakened (67.3 from 68.3); the gauge for current conditions rose to 77.4, the highest since Oct 2021. The 5-year and 1-year ahead inflation expectation slowed to 2.9% and 3.3% respectively in Aug (Jul: 3% & 3.4%).
- US goods trade deficit widened to USD 88.2bn in Jun (May: USD 87.8bn), as imports dropped by 1.2% and exports by 0.1%. Goods and services deficit narrowed to USD 65.5bn (May: USD 68.3bn), with imports falling to the lowest level since Nov 2021. Deficit with China fell by USD 2.1bn to USD 22.8bn, with imports plunging by USD 2.3bn.
- Initial jobless claims increased by 21k to 248k in the week ended Aug 4th, the highest level in a month, and the 4-week average fell by 2.75k to 231k. Continuing jobless claims fell by 8k to 1.64mn in the week ended Jul 28th, down from a high of 1.86mn in mid-Apr.
Europe:
- Sentix investor confidence in the EU improved to -18.9 in Aug (Jul: -22.5) after 3 months of worsening sentiment, with economic expectations gauge rising 7.3 points to -17.2. Germany’s index fell for a 4th consecutive month, to -30.7.
- Industrial production in Germany fell by 1.5% mom in Jun (May: -0.1%), the third decline this year, dragged down by automotive industry (-3.5%) and construction (-2.8%). While capital goods production fell by 3.9%, consumer and intermediate goods production were up by 1.8% and 0.4% respectively. In yoy terms, IP contracted by 1.7% (May: flat).
- Current account surplus in Germany widened to EUR 29.6bn in Jun (May: EUR 8.2bn).
- Q2 GDP in the UK expanded by 0.2% qoq and 0.4% yoy (Q1: 0.1% qoq and 0.2% yoy). The production sector grew by 0.7% qoq, while services output and construction were up by 0.1% qoq and 0.3%. But the level of quarterly GDP in Q2 remains 0.2% below its pre-Covid level in Q4 2019.
- UK like-for-like retail sales grew by 1.8% yoy in Jul (Jun: 4.2%), the lowest gain in 9 months, largely affected by wet weather and high inflation. In like-for-like terms, clothing and retailers saw a sales drop leading to a 0.8% fall in non-food sales, while food and drink sales grew 8.7% (the slowest pace since winter).
Asia Pacific:
- China’s exports fell by 14.5% yoy in Jul, the sharpest fall since Feb 2020, while imports declined by 12.4%. Trade surplus widened USD 80.6bn in Jul (Jun: USD 70.62bn). Exports to the US and EU fell by 23.1% and 20.6% respectively.
- China fell into deflation in Jul, with prices down by 0.3% yoy in Jul (Jun: 0%), the first decline since Feb 2021. Food costs fell 1.7%, after gaining in the 15 previous months. Core CPI rose to 0.8% yoy (Jun: 0.4%), the most since Jan. Producer price index fell by 4.4% yoy in Jul (Jun: -5.4%, the steepest fall since Dec 2015). The deflation is reflecting a weak recovery following the lifting of Covid restrictions. Expect policy responses in the coming weeks.
- Money supply in China grew by 10.7% yoy in Jul (Jun: 11.3%), the slowest pace since Apr 2022. New loans plunged by 89% mom to CNY 345.9bn (USD 47.8bn) in Jul, the lowest since late-2009. Outstanding yuan loans grew by 11.1% yoy in Jul, the lowest gain this year.
- Japan’s leading economic index declined to 108.9 in Jun (May: 109.1), largely due to declines in new orders and output; services sector growth stood at a 4-month low. The coincident index rose to 115.2 in Jun (May: 114.3), the highest reading since Aug 2022.
- Overall household spending in Japan fell by 4.2% yoy in Jun (May: -4%), the fourth straight month of decline. Spending on many components fell: food (-3.9% from -2.7%), clothing & footwear (-4.3% from -4.8%) and housing (-2.9% from -4.2%) among others.
- Japan’s current account surplus narrowed to JPY 1509bn in Jun (May: JPY 1862.4bn), bringing the surplus up to JPY 8.01trn in H1 2023 (+11.1% yoy). Trade moved into a surplus JPY 328.7bn in Jun from May’s deficit of JPY 1186.7bn; smaller trade deficit in H1 and record foreign investment led to the larger current account surplus.
- The Reserve Bank of India left policy rates unchanged: repo rate at 6.5% and reverse repo at 3.35%. The repo rate has been left unchanged for three times so far. CPI projection was revised to 5.4% for the financial year 2023-24 (from the previous estimate of 5.1%.
- Industrial output in India grew by 3.7% yoy in Jun, slower than May’s 5.3% gain; manufacturing production increased by 3.1% (May: 5.8%).
- Singapore’s GDP expanded by 0.1% qoq and 0.5% yoy in Q2 (Q1: -0.4% qoq & 0.4% yoy). This was slower than the advance estimate of 0.3% growth. Given a weak external demand outlook, the GDP growth forecast was revised down to 0.5% to 1.5% (from 0.5% to 2.5%) for this year, down from 3.6% in 2022.
Bottom line: This week’s data will be key – from EU’s GDP estimate to China’s updates on industrial production to retail sales and housing sector and Fed minutes – to understand the magnitude of weakness in recovery. For now, growth in developing markets have been resilient compared to a slowdown in the developed nations (struggling with inflation pressures and rising borrowing costs). The world prepares for a scenario of high rates for longer amidst still-high levels of inflation despite months of monetary policy tightening. Last week’s executive order from the US President puts further strains in US-China relations – this order would block and regulate high-tech US investments into China (covering advanced computer chips, AI etc.), potentially stemming from security concerns, but resulting in an augmentation of the trade and tech war.
Regional Developments
- Urban inflation in Egypt touched a record-high 36.5% yoy in Jul (Jun: 35.7%). Core inflation was at a much higher 40.7% (though slower than Jun’s 41% gain) & annual food inflation was up 68.4% (Jun: 65.9%).
- The weakening Egyptian Pound led to an increase in the value of government debt by EGP 1.3trn and raised Egypt’sdebt-to-GDP ratio to 95.6% in 2022-23.
- Egypt posted a primary surplus of EGP 164.3bn or 1.63% of GDP in the fiscal year 2022-23: revenues and tax revenues grew by 15.5% and 27.2% respectively while overall spending jumped by 18.9%. Fiscal deficit stood at 6%, down from 6.1% the previous year.
- Non-oil exports from Egypt fell by 17% yoy to USD 16bn in H1 of 2023, disclosed a government official to Asharq Business. Separately, CAPMAS data showed trade deficit widened by 4.3% yoy to USD 3.74bn in May 2023, as exports fell by 20.9% (to USD 3.38bn) while imports fell by 9.4% (to USD 7.12bn).
- Egypt’s gold reserves increased to USD 7.97bn in Jul (Jun: USD 7.738bn). The nation’s net international reserves inched up to USD 34.879bn (Jun: USD 34.806bn).
- JODI data revealed that Egypt’s natural gas production fell by 9% yoy to a three-year low in Jan-May 2023. This is partly due to the decline in production at the Zohr field: it stands at 2.3bn cubic feet per day (cfd) now vs 2.7bn cfd in 2019.
- The audit of Lebanon’s central bank found evidence of “illegitimate commissions” of USD 111mn from 2015 to 2020. Also called into question were BDL’s “non-traditional” accounting standards that allowed it to conceal its losses: the report finds that the BDL moved from a foreign currency surplus of LBP 10.7trn (USD 7.2bn) in 2015 to a deficit of LBP 76.4trn (USD 50.7bn) at end-2020.
- Oman posted a budget surplus of OMR 656mn (USD 1.7bn) at end-H1 2023: revenues declined by 6% to OMR 6.34bn. The government had repaid more than OMR 507mn to the private sector and also reduced public debt to OMR 16.3bn.
- Oman Air approved a restructuring program to reduce its losses by 15% during this year, raise revenues by 236% this year (vs 2020) and aim for a break-even point by 2026.
- Value of real estate transactions in Oman increased by 18.9% yoy to OMR 1.4bn at end-Jun, resulting in an increase in fees collected (10.3% to OMR 33.4mn).
- Qatar’s PMI inched up to 54 in Jul (Jun: 53.8), the second highest reading in 2023: employment rose at the fastest rate since Jul 2022 while price pressures eased in Jul.
- Qatar Central Bank’s foreign reserves increased by 14.3% yoy to QAR 241.572bn in Jul. Gold reserves grew by QAR 7.191bn to QAR 22.131bn.
- Qatar Investment Authority acquired a 2.7% stake in Adani Green Energy Ltd, worth about INR 39.2bn (USD 474mn).
- GCC state-owned investors deployed around USD 83bn of fresh capital during 2022, according to a report from S&P Global, citing Global SWF data. Five of the world’s 10 largest investments on behalf of state-owned investors in 2022 were from GCC sovereign investors: 62% from the UAE, 28% from Saudi Arabia, and 10% from Qatar.
- Ernst & Young, in its MENA IPO Eye report, disclosed that 13 IPOs raised a total USD 1.8bn in proceeds in Q2 2023. The number of listings, up 44% yoy, was dominated by Saudi Arabia (11 of the 13, with 4 on Tadawul and 7 on Nomu) and one each in Dubai and Abu Dhabi.
- The number of Indians working in the GCC stand at a total of 7.932mn currently, according to India’s minister of state for external affairs. Of this, UAE accounted for 3.554mn (up from 3.419mn in 2022).
Saudi Arabia Focus
- The framework for a Saudi Arabia-Israel normalisation deal has not yet been agreed, disclosed the White House, following reports from the Wall Street Journal that the broad terms of a deal was already agreed. While such discussions continue to happen, Saudi appointed its first ever ambassador to the Palestinians (a non-resident ambassador, a role to be managed by the Saudi ambassador to Jordan).
- The Saudi Cabinet reaffirmed its support for OPEC+ precautionary measures to stabilise the oil market.
- Industrial production (IP) in Saudi Arabia fell by 1.6% yoy in Jun 2023, the second consecutive month of decline (May: -1.2%). This brings H1 2023 IP growth to 2.9%, a fraction of the 21.6% surge recorded in H1 2022 (thanks to oil production). In mom terms, industrial output grew by 0.5% in Jun, reversing May’s fall of 3.1% (the steepest since Feb 2021). Mining and quarrying sector growth has fallen into negative territory in May-Jun, while manufacturing climbed by 10.1% in Jun.
- Saudi Aramco’s net profit dropped by 38% yoy to SAR 112.81bn (USD 30.07bn) in Q2 and announced that it will maintain its quarterly base dividend payment at USD 19.5bn; furthermore, the firm will make an additional performance-linked dividend payment to shareholders of USD 9.9bn in Q3. The government holds 90.19%, PIF another 4% and Sanabil (a PIF subsidiary) another 4%.
- Saudi Central Bank issued a new license to fintech company Loan to provide consumer microfinance solutions, becoming the 6th authorised firm to offer such solutions.
- Saudi Arabia’s Ministry of Industry and Mineral Resources issued 32 new mining licenses in Jun; of this, 17 was for exploration and 11 for quarrying building materials. This brings the total number of mining licenses to 2,363 at end-Jun. Separately, the ministry also issued 73 new licenses to production units in different sectors including 19 in food production, 7 in base metals and 5 in manufacturing among others.
- Saudi Arabia granted 34,926 certificates of origin in Jul, up from 32,250 in Jun: this brings the total such documents issued to over 230k since the beginning of the year.
- PIF launched a new facilities management company called the Saudi Facility Management Co. (or FMTECH) to offer services including utilities management, waste management, and housekeeping among others.
- Saudi Arabia’s Citizen Account Program has disbursed SAR 3.7bn (USD 986mn) to 11.2mn beneficiaries in Aug. It was disclosed that 76% of the beneficiaries received support this month, with average aid amounting to SAR 1827.
- The Social Development Bank in Saudi Arabia provided SAR 6.4bn in financing in H1 2023: a total of SAR 2.6bn was dedicated to support 5700 SMEs during the period.
UAE Focus![]()
- Dubai PMI declined to 55.7 in Jul, from Jun’s 10-month high of 56.9, as demand cooled across the 3 key sectors construction, wholesale & retail, and travel & tourism. The rate of job creation moderated slightly and was at a 3-month low.
- Dubai’s GDP increased by 2.8% yoy in Q1 2023, following a 3.7% gain in Q4 2022 and an overall gain of 4.4% in 2022. Non-oil sectors have been posting strong growth rates: in Q1, transportation and storage surpassed all others (10.3% yoy), followed by accommodation & food (5.6%), finance & insurance (3.2%), real estate activities (2.4%) and manufacturing (2.4%).
- Dubai tourism sector crossed pre-Covid levels, with the emirate welcoming a record-high 8.55mn international visitors in H1 2023, vs pre-Covid level (8.36mn). Occupancy rates also crossed pre-Covid days. Regional composition of tourists has remained the same, with GCC & MENA visitors accounting for 28% of the total in Jun 2023, with Western Europe and South Asia shares at 20% and 17% respectively.
- Property transactions in Dubai jumped by 44% yoy to 57,700 in H1 2023, according to Savills. The report showed that 50k residential units are up for completion by end-2023, with around 77% constituting apartments.
- Abu Dhabi reduced government fees applied to hotels, effective 1st September. The tourism fee issued to guests will be lowered to 4% (from 6%), a municipality fee of AED15 per room per night will be removed and the 6% tourism fee and 4% municipality fee applied to hotel restaurants will be dropped. The 4% municipality fees will continue.
- Dubai Chamber of Digital Economy disclosed it had attracted 69 emerging tech firms in H1 2023.
- Abu Dhabi’s ADNOC awarded a USD 3.6bn contract to expand its gas processing infrastructure in the UAE. ADNOC stated that over 70% of the contract’s value would “flow back into the UAE’s economy” under the In-Country Value program.
- DEWA selected Abu Dhabi’s Masdar to construct and manage the 1800 MW sixth phase of the Mohammed bin Rashid Al Maktoum Solar Park with an estimated cost of up to AED 5.51bn.
Media Review
The end of zero interest rates
https://www.project-syndicate.org/commentary/interest-rates-not-returning-to-zero-in-near-future-by-jeffrey-frankel-2023-08
Saudi Arabia is spending a fortune on sport
https://www.economist.com/briefing/2023/08/10/saudi-arabia-is-spending-a-fortune-on-sport
The Clean Energy Future is Arriving Faster than you think
https://www.nytimes.com/interactive/2023/08/12/climate/clean-energy-us-fossil-fuels.html
The Human Era is ending
https://www.newstatesman.com/ideas/2023/08/the-end-of-the-human-era
Powered by: