

Global food prices & supply chains. Inflation in Egypt & GCC. Dubai GDP & tourism. Saudi fiscal deficit & industrial production.
Download a PDF copy of this week’s insight piece here.
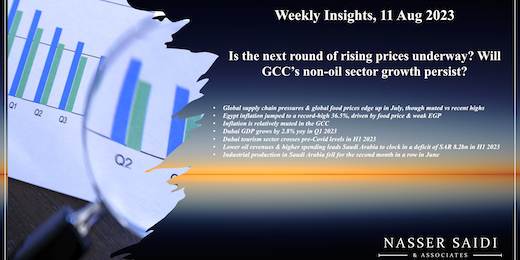
Weekly Insights 11 Aug 2023: Is the next round of rising prices underway? Will GCC’s non-oil sector growth persist?
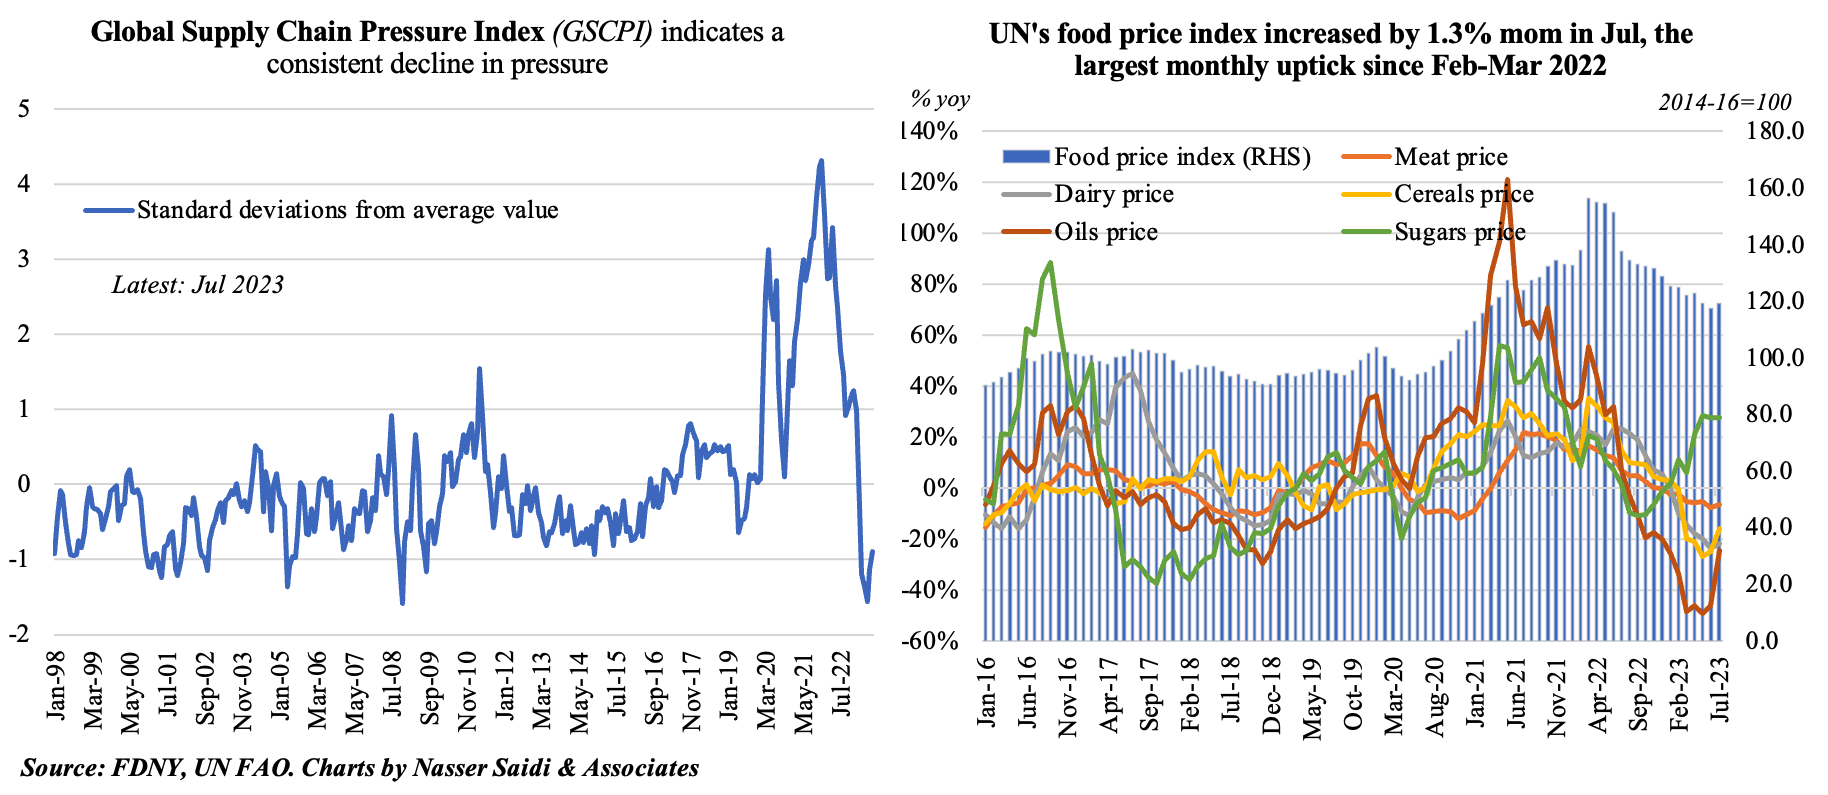
1. Global supply chain pressures & global food prices edge up in July, though muted compared to recent highs
- The Fed’s Global Supply Chain Pressures Index (GSCPI) readings have posted 2 consecutive months of increase in June and July 2023, despite staying negative from Feb 2023 onwards (i.e. standard deviations are below index’s historical average). These upward pressures have stemmed from backlogs in the UK and Euro area as well as delivery times in the US and Taiwan, according to the Fed.
- Global shipping costs are rising: The Drewry World Container Index composite increased by 1.6% to USD 1,790.6 per 40ft container this week (as of Aug 10): this is the fifth consecutive week of increase; last week’s rise (of 11.8% to USD 1761 was the largest week-on-week gain since Jun 2021. Shipping costs are rising for routes such as Shanghai-Los Angeles and Shanghai-Rotterdam.
- Oil production cuts are slowing the demand for crude tankers: daily earnings for Aframax tankers (which can hold 700k barrels of crude) crossing the Mediterranean this week fell to USD 5,905, the lowest since June 2022 , and from USD 30k+ a month ago. Earnings for Suezmax tankers (carrying 1mn barrels of crude) from the Black Sea to the Mediterranean have fallen to the lowest since Feb 2022.
- Separately, UN’s food price index rose by 1.3% mom in Jul, the most since the beginning of the war in Ukraine. Sugar posted a substantial increase in Jul (+30% yoy) while prices rose for wheat (+1.6% mom, first increase in 9 months, given Russia backing out from the Black Sea initiative) and rice (+2.8% mom to the highest since Sep 2011, a result of India’s ban on exports of rice excluding Basmati). However, the overall index is still 23.7% lower compared to the March 2022 peak. The recent uptick in cereals and sugar prices are showing up in importing nations’ inflation (e.g. Egypt).
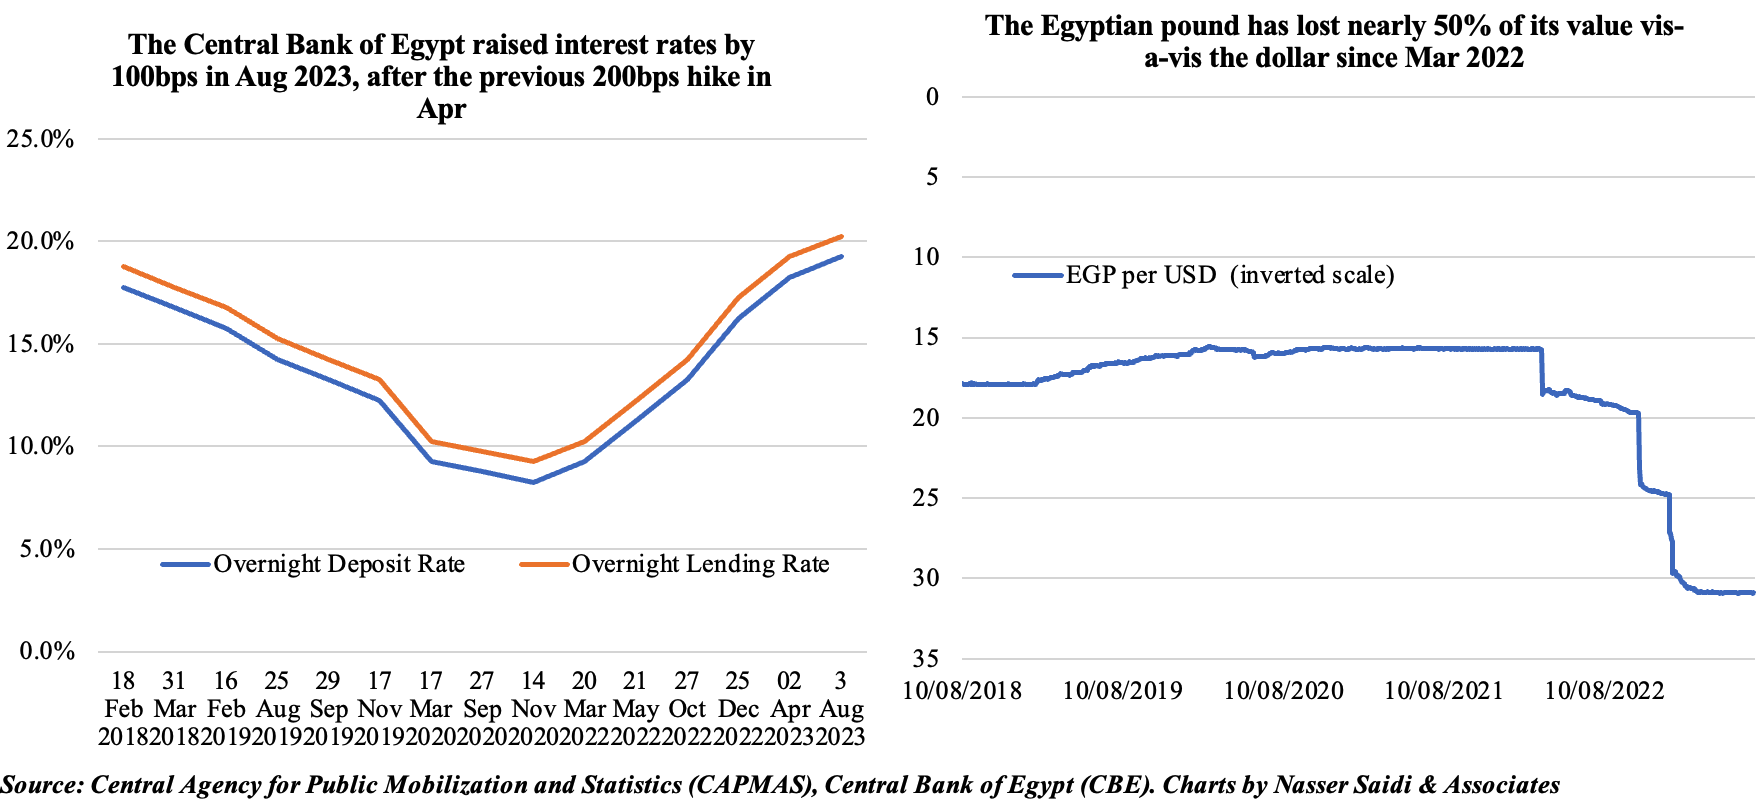
2. Egypt inflation jumped to a record-high 36.5%, driven by food price & weak EGP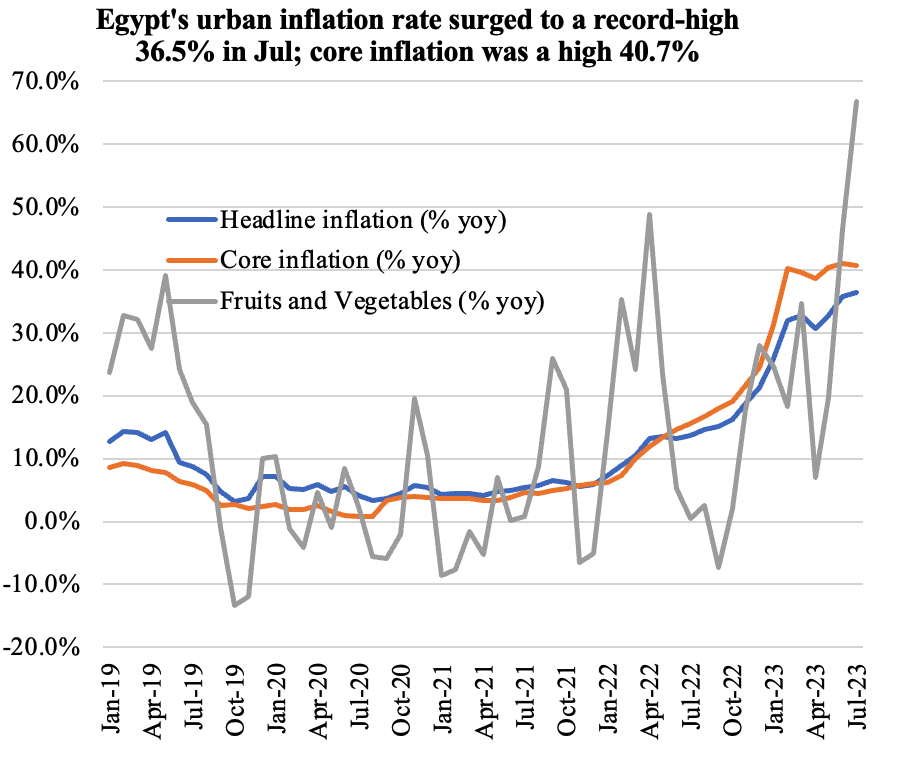
- Urban inflation in Egypt touched a record-high 36.5% yoy in Jul (Jun: 35.7%). Core inflation was at a much higher 40.7% (though slower than Jun’s 41% gain) & annual food inflation was up 68.4% (Jun: 65.9%).
- Russia pulling out of the Black Sea grain initiative and India’s restrictions on rice trade => uptick in grain prices. Persistent upticks will raise food prices. Egypt being the largest wheat importer, imports costs will rise & widen deficits and will also filter through & affect the poorest consumers most.
- Inflation is accelerating in Egypt also due to weakness of the Egyptian Pound. EGP has lost close to half its value since Mar 2022, benefitting the tourism sector & enabling lower import costs, but the weakening EGP has also raised debt-to-GDP ratio to 95.6% in 2022-23. Dollar scarcity could improve if the promised asset sales came through: but, wait & watch mode from investors add further pressure on EGP.
- Bottomline: there is increased pressure to devalue the Egyptian pound. EGP needs to move towards a flexible exchange rate – a key recommendation of the IMF that has failed to materialize.
- Domestic demand has been weak in this backdrop: non-oil sector PMI remained contractionary (below-50) for the 32nd consecutive month in July & forward-looking sentiment was still among the lowest on record.
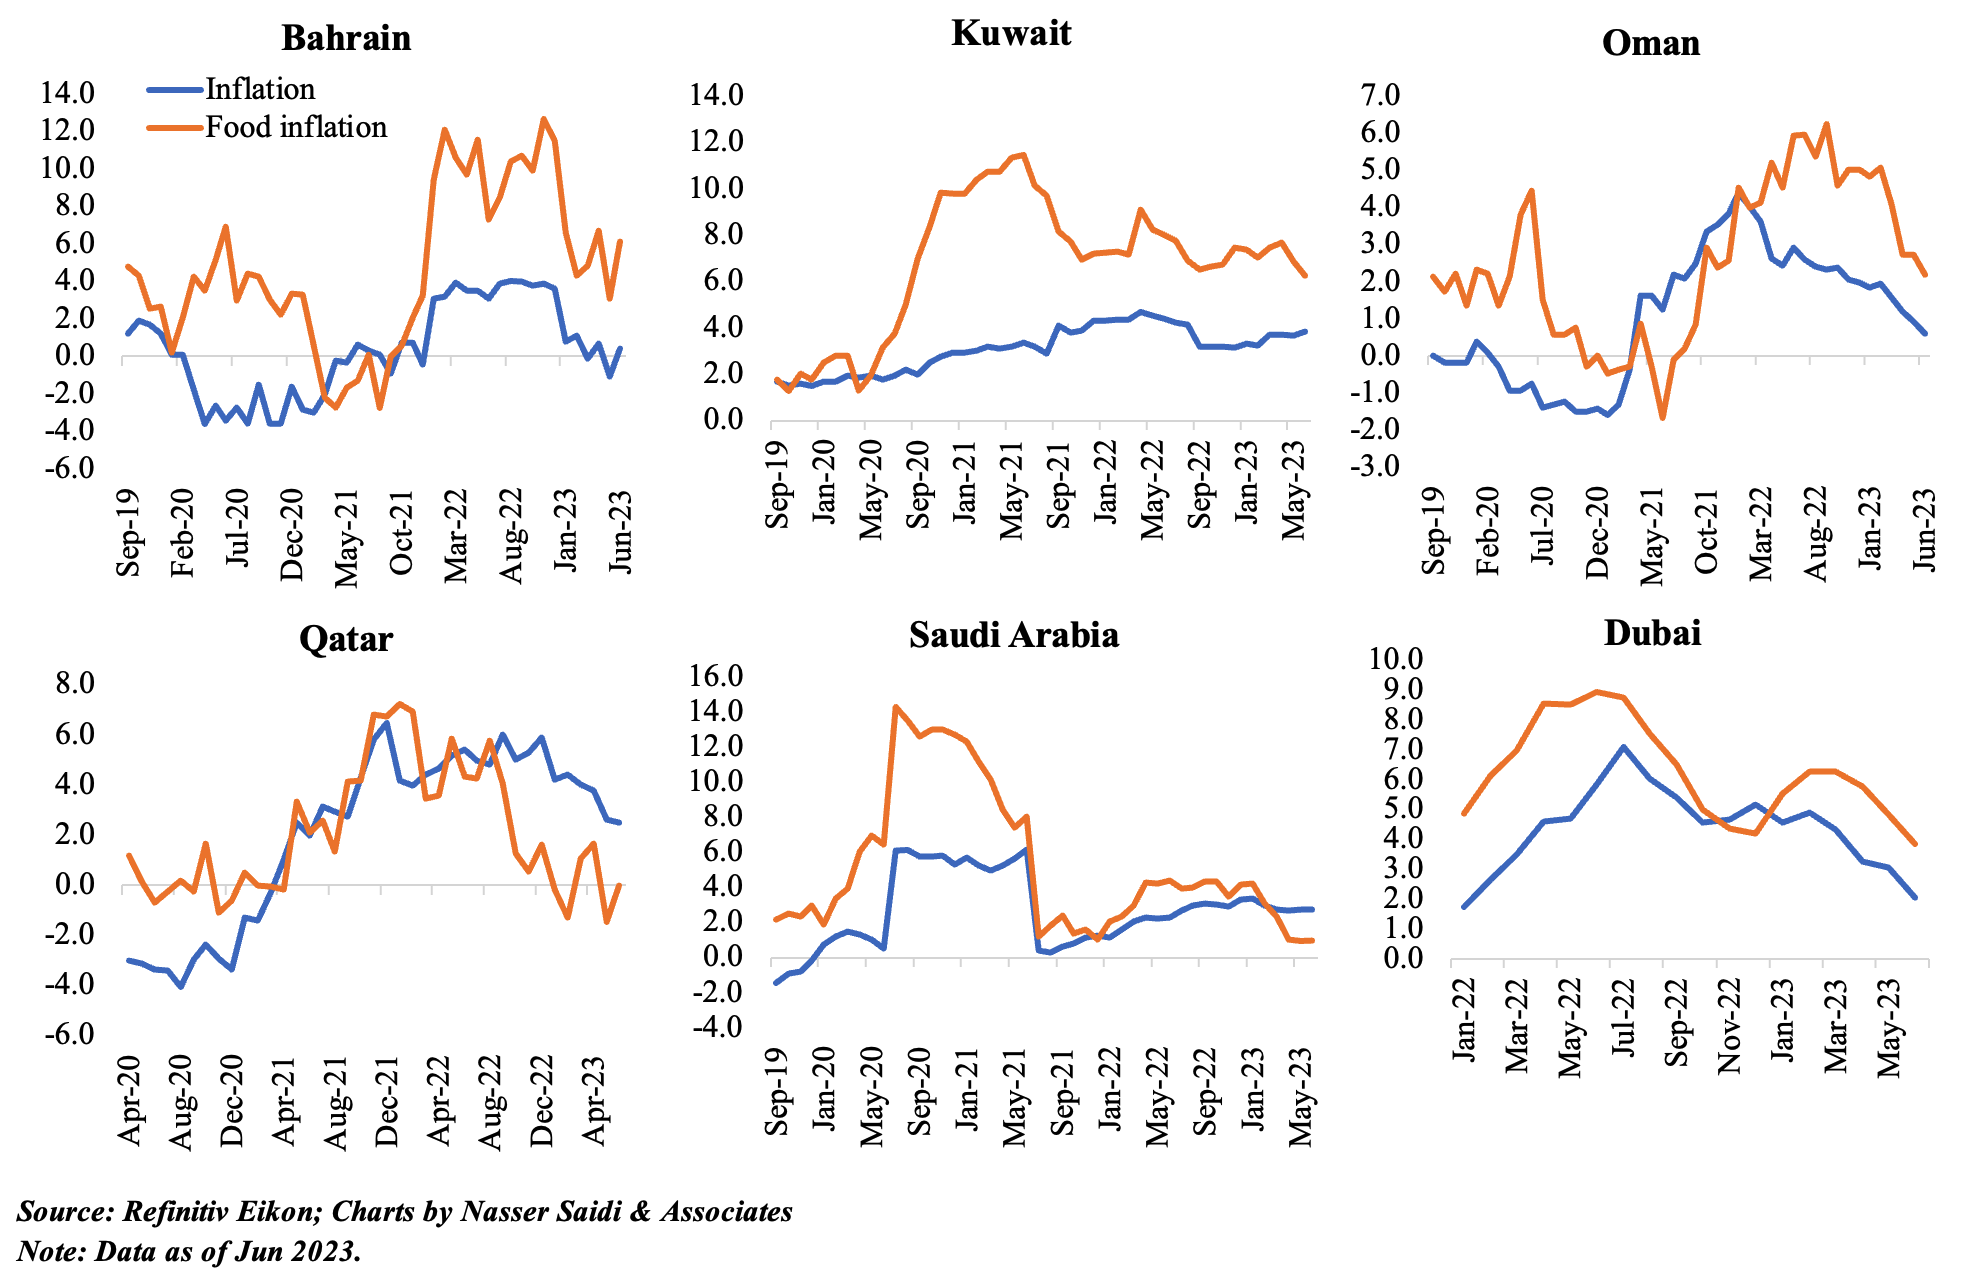
3. Inflation remains relatively muted in the GCC; even food prices are slowing given price controls for many basic commodities. Services & housing costs have been contributing to the upticks amid declines in transportation costs (especially in the UAE and Saudi Arabia)
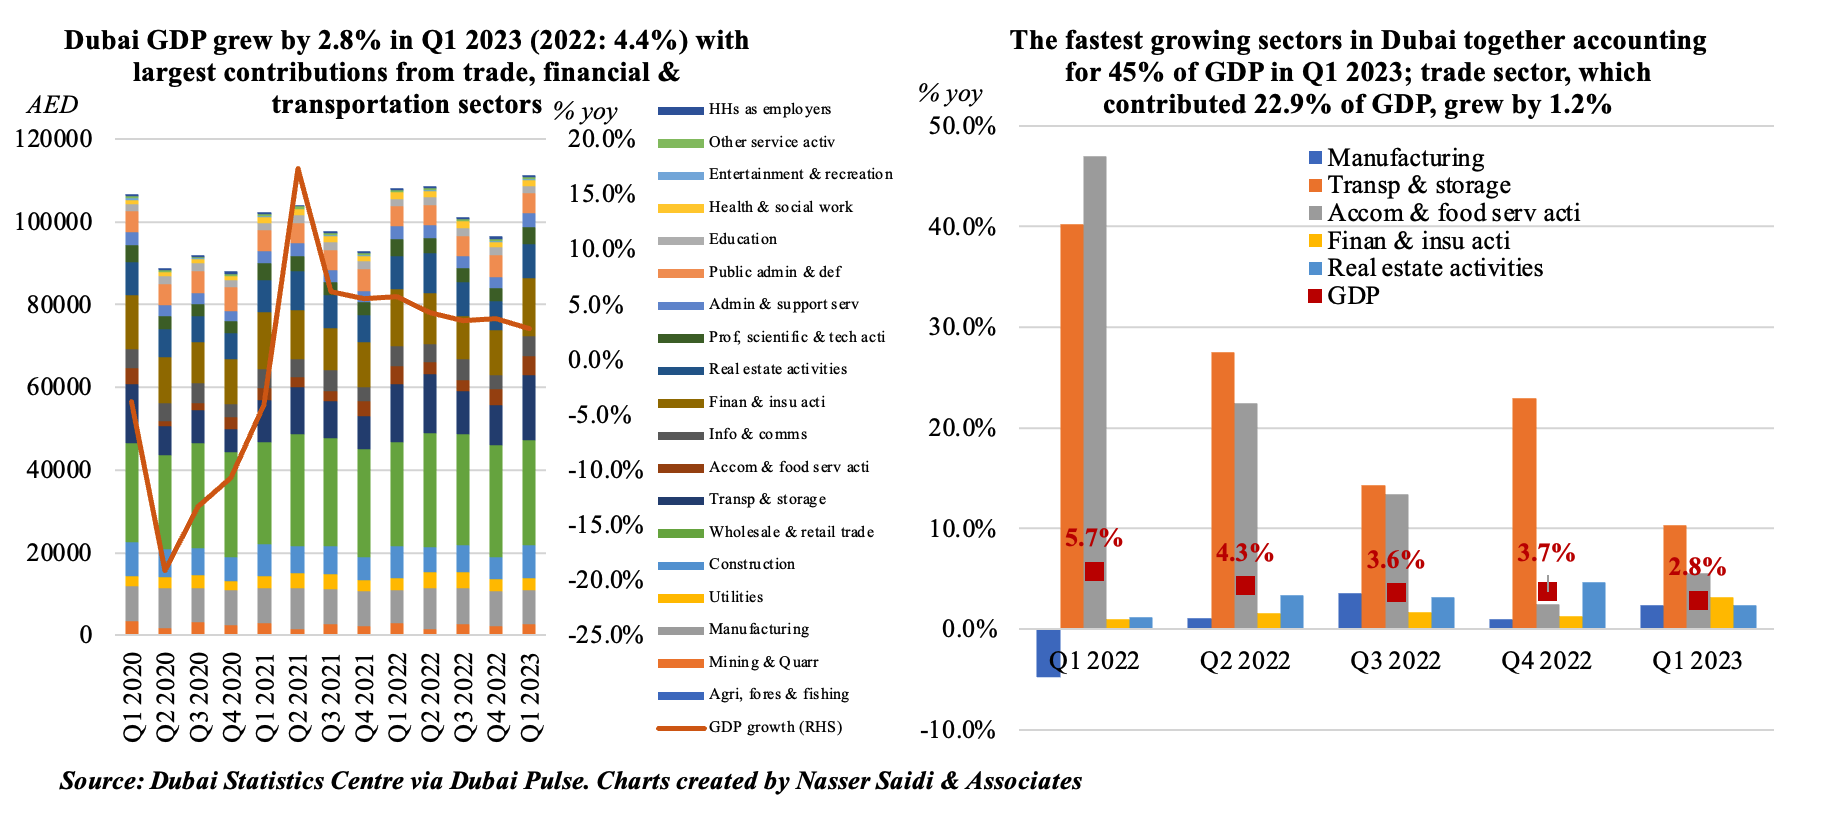
4. Dubai GDP grows by 2.8% yoy in Q1 2023
- Dubai GDP increased by 2.8% yoy in Q1 2023, following a 3.7% gain in Q4 2022 and an overall gain of 4.4% in 2022.
- In Q1 2023, the percentage contribution of the wholesale and retail trade sector was the highest(22.9%), followed by transportation & storage (14.1%), finance & insurance (12.7%), manufacturing (7.4%) and real estate activities (7.4%).
- Dubai’s non-oil sectors have been posting strong growth rates: in Q1, transportation and storage surpassed all others (10.3% yoy), followed by accommodation & food (5.6%), finance & insurance (3.2%), real estate activities (2.4%) and manufacturing (2.4%). This is in line with PMI data showing construction, wholesale & retail and travel & tourism sectors performing well in Q1 (average of 54.7).
- Real estate sector performance is coming to the forefront, given high growth rates (2.4%) and contribution (7.4%). This is largely thanks to the spate of structural reforms in the past 2 years (which is attracting global firms and a skilled workforce). However, a word of caution is necessary. Dubai recorded 38,700 real estate transactions (+80% yoy) worth AED 157bn (+49% yoy) in Q1 2023, and UAE accounts for roughly 1/5th of new project announcements in the GCC (Source: MEED Projects). While the ultra-luxury and luxury projects will continue to gain (given returns, openness and general attractiveness of Dubai as a destination), care needs to be taken not to price out the residents who are looking to invest stay for the long-term (especially given long-term residency) especially given higher interest rates.
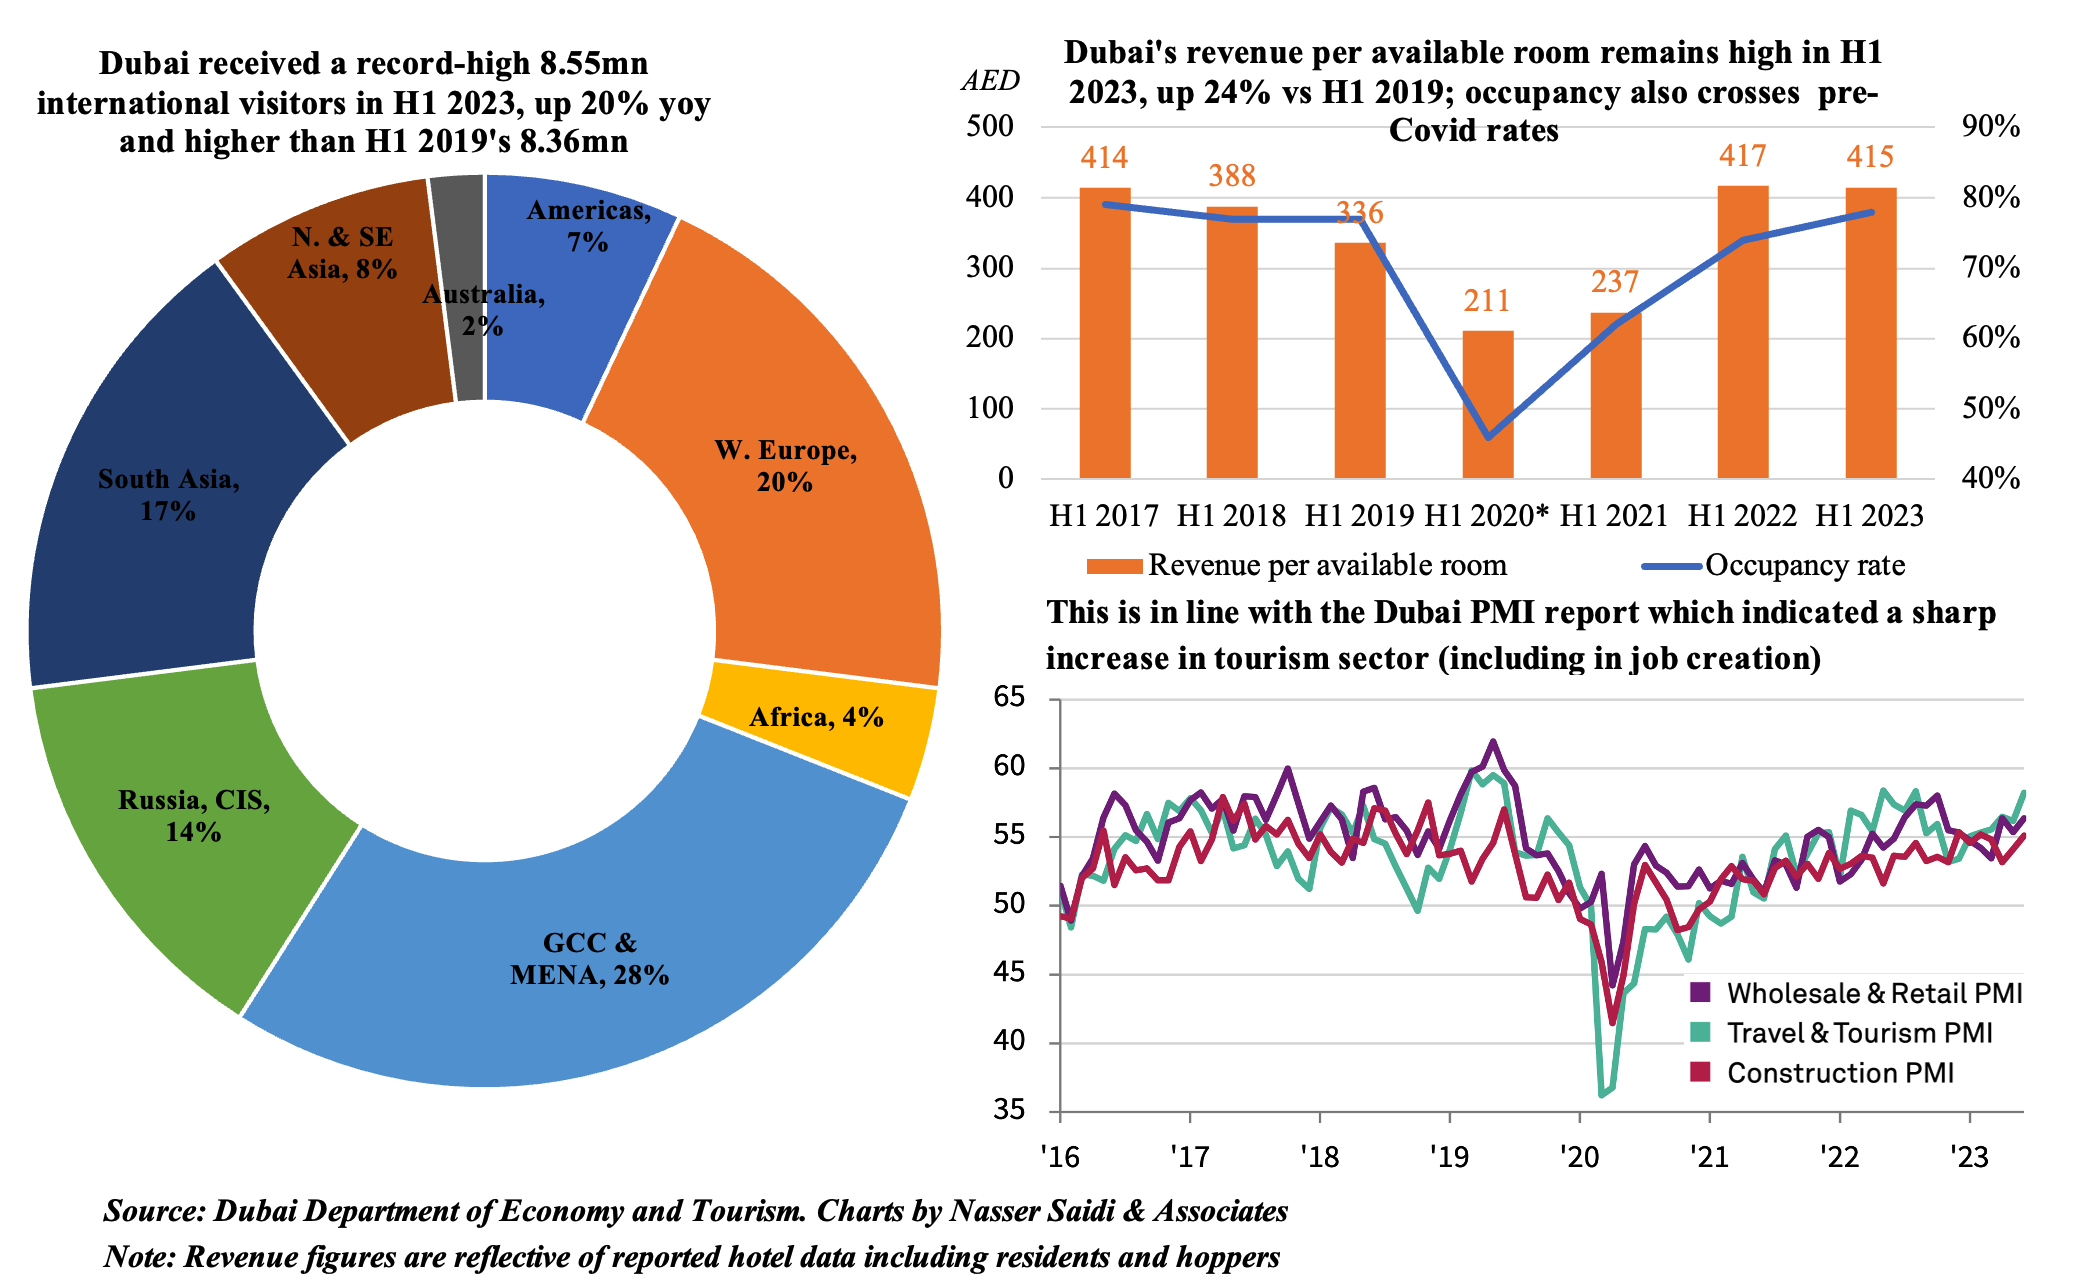
5. Dubai tourism sector crosses pre-Covid levels, with the emirate welcoming a record-high 8.55mn international visitors in H1 2023, vs pre-Covid level (8.36mn). Occupancy rates also crossed pre-Covid days.
Regional composition of tourists have remained the same, with GCC & MENA visitors accounting for 28% of the total in Jun 2023, with Western Europe and South Asia shares at 20% and 17% respectively. China permitting the resumption of group tourism will benefit Dubai in the coming months; the country is already part of the top 10 origin nations. Revenue per available room surged by 24% (to AED 534) vs H1 2019, and length of stay has increased to 3.9 from 3.5.
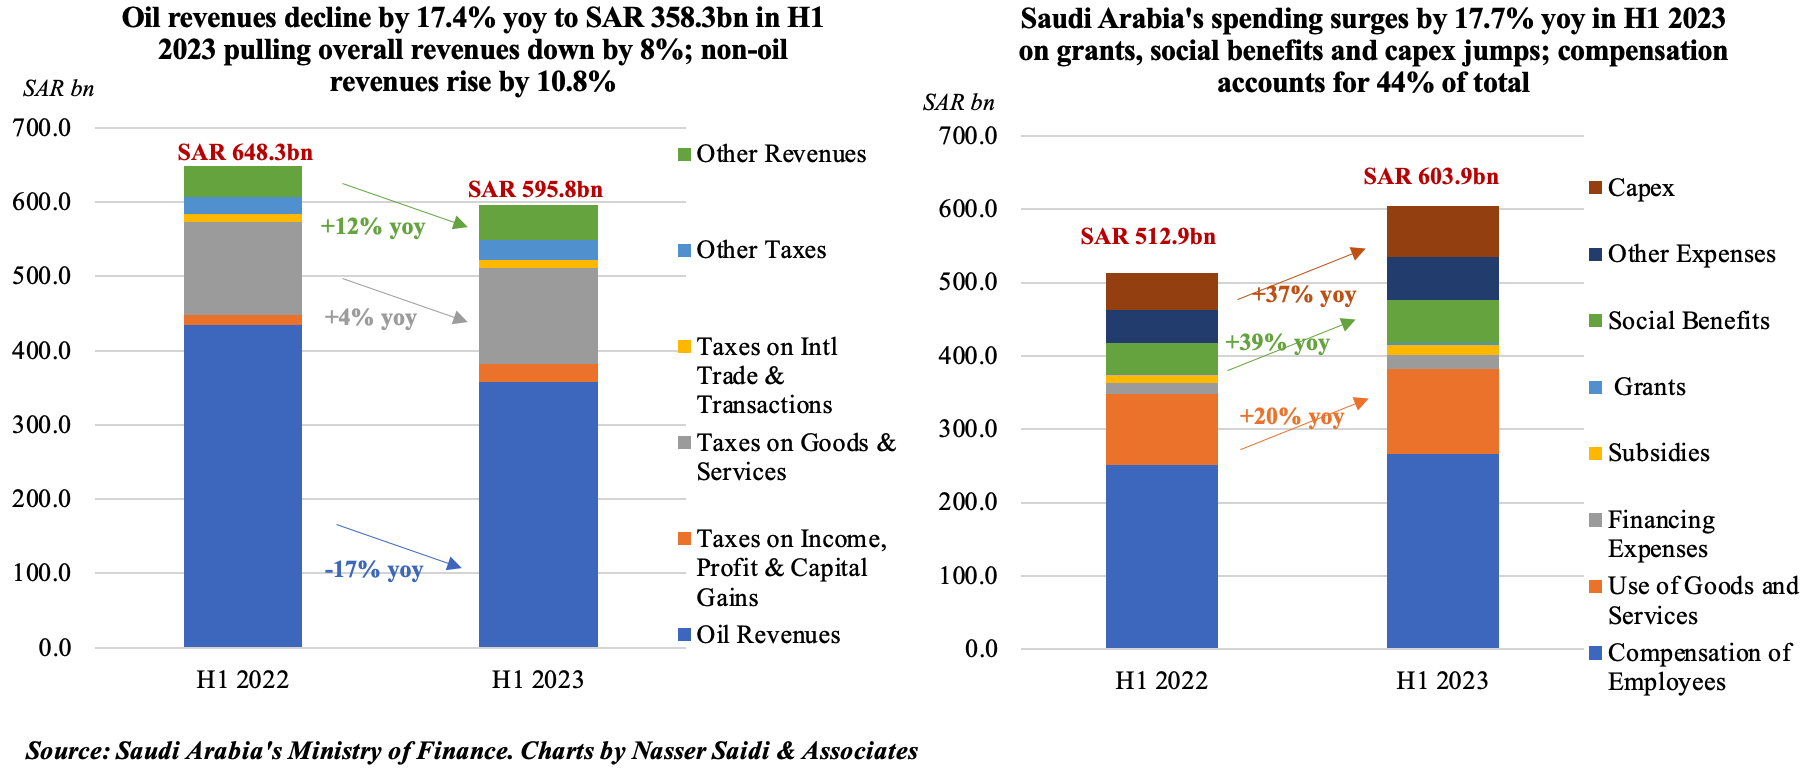
6. Lower oil revenues & higher spending leads Saudi Arabia to clock in a deficit of SAR 8.2bn in H1 2023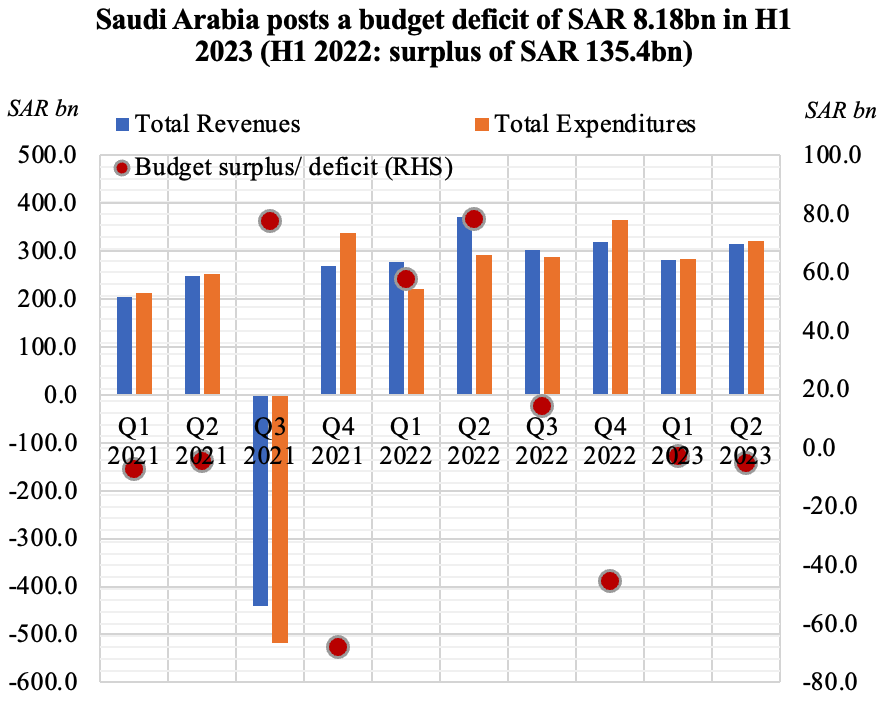
- Saudi posted a 28% yoy drop in oil revenues in Q2 2023, dragging down overall revenues (-15% in Q2) while non-oil revenues were up by 13%. Bulk of the non-oil revenues came from tax on goods & services (3% to to SAR 16.7bn in Q2), the largest gain was for taxes from income, profit and capital gains (63% yoy). In H1 2023, oil and overall revenues fell by 17% yoy and 8% respectively.
- Spending rose by 9% in yoy terms in Q2 2023, with all items other than use of goods & services posting gains; compensation of employees grew by only 5%. Compensation, which accounted for 44% of total spending in H1 2023, rose by 6% to SAR 265.9bn. Grants almost doubled to SAR 3.2bn in H1, while capex grew by 36.6% to SAR 69.5bn.
- Overall deficit fell to SAR 8.2bn in H1 2023; the announcement of Aramco’s dividends (USD 19.5bn to shareholders) will provide some relief to the government as its mega & giga-projects are well underway.
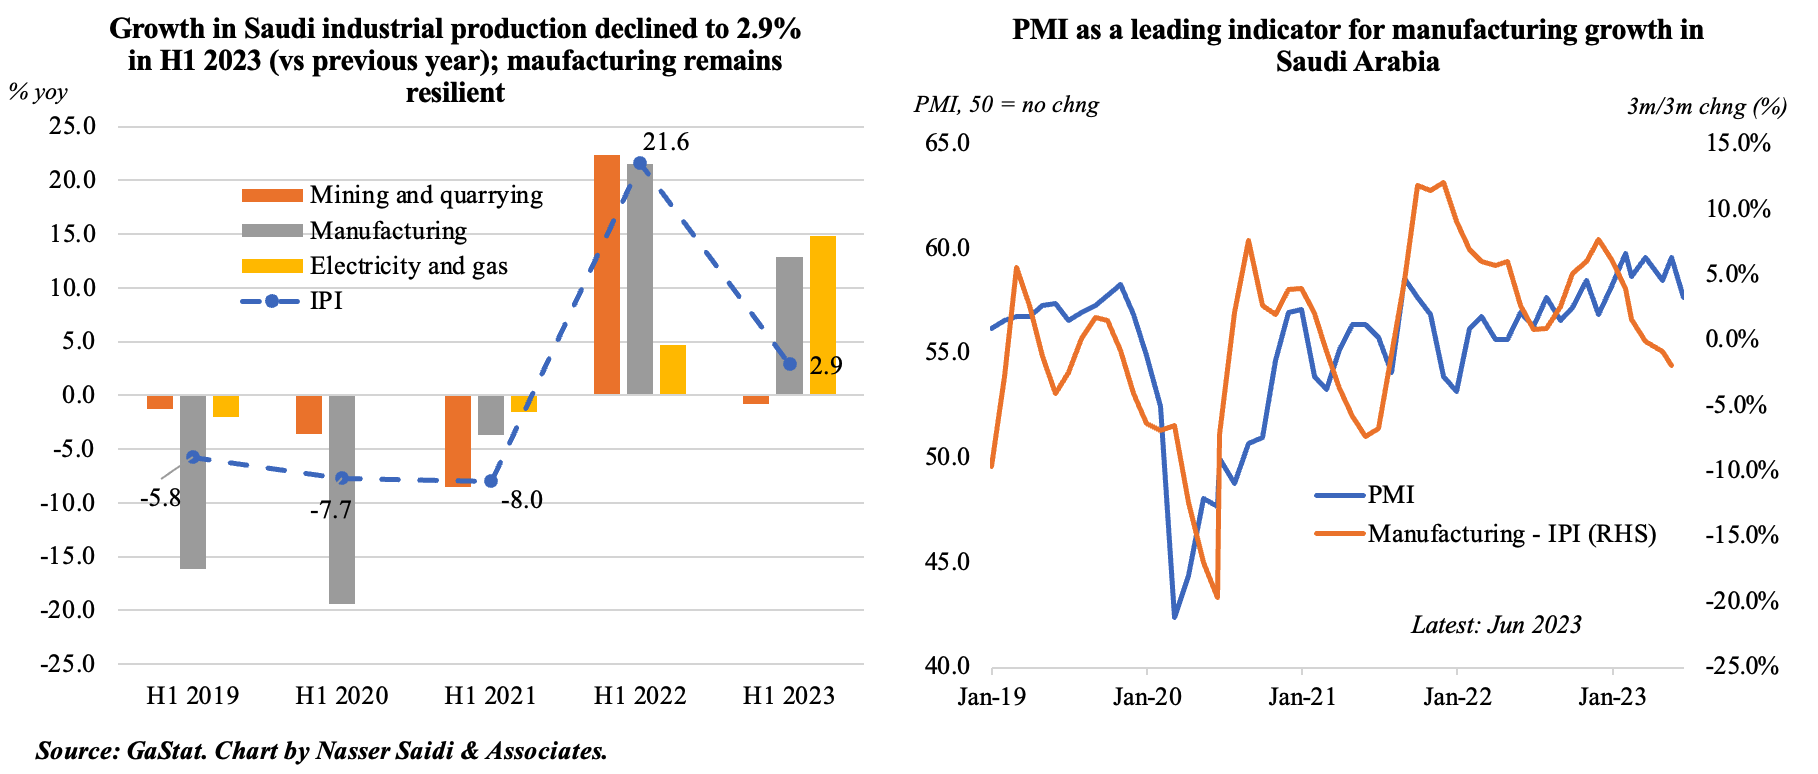
7. Industrial production in Saudi Arabia fell for the second month in a row in June
- Industrial production (IP) in Saudi Arabia fell by 1.6% yoy in Jun 2023, the second consecutive month of decline (May: -1.2%). This brings H1 2023 IP growth to 2.9%, a fraction of the 21.6% surge recorded in H1 2022 (thanks to oil production). In mom terms, industrial output grew by 0.5% in Jun, reversing May’s fall of 3.1% (the steepest since Feb 2021).
- Mining and quarrying sector growth has fallen into negative territory in May-Jun, and is poised for further slowdown (given extended oil production cuts). It fell by 0.8% in H1 2023, from a 22.4% gain in H1 2022.
- Manufacturing has been the mainstay: it grew by 10.1% in Jun, averaging 12.9% in H1 2023 (vs 21.5% in H1 2022). PMI readings for Saudi Arabia seem to indicate a strong few months up ahead: by sector, the fastest rates of output expansion were reported by manufacturing (and construction) companies in Jul (though overall new order growth lost some momentum, holding back headline PMI).
- The issuance of new industrial licenses also bodes well for IP: 73 new licenses were issued in Jun, with making food products topping the list (19 licenses) followed by base metals (5) and manufacturing chemicals (5). Industrial establishments in the country reached a total of 10,982 factories, with an investments value exceeding SAR 1.4trn.
Powered by: