

Download a PDF copy of this week’s insight piece here.
Weekly Insights 17 Feb 2023: Economic Diversification in the Middle East: catch-phrase or reality?
1. Measuring Economic Diversification 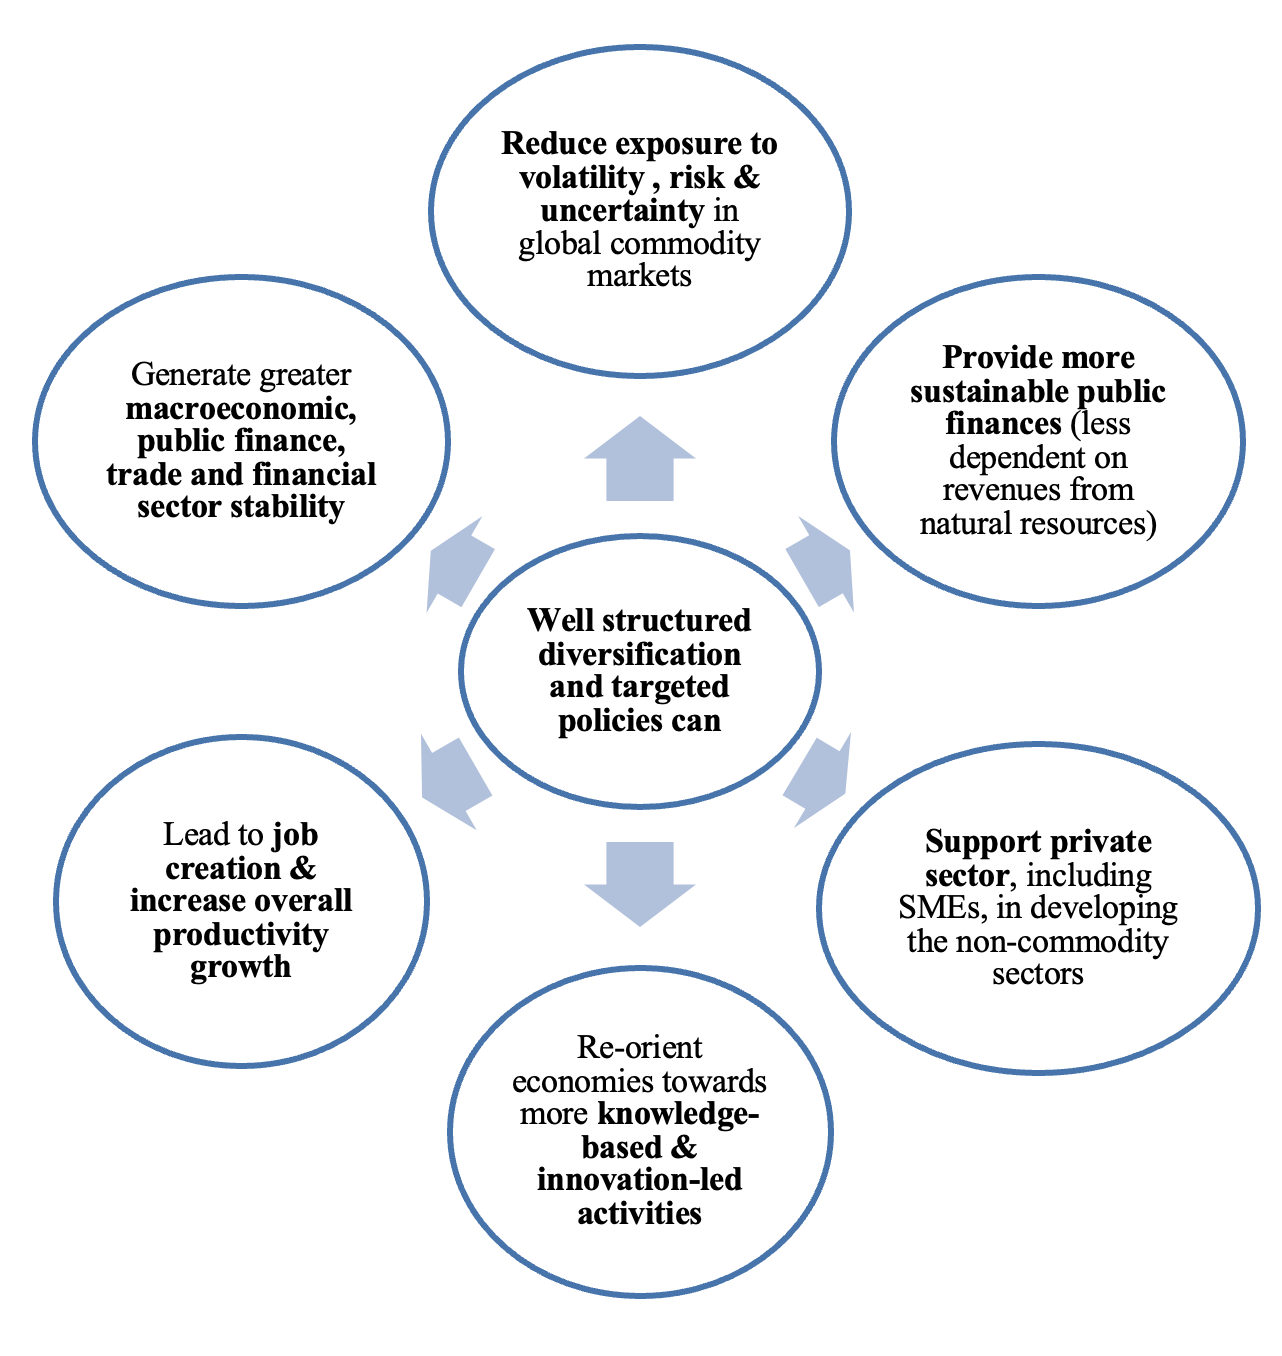
- Diversification is key to reducing macroeconomic risks, avoid ‘natural resource curse’, achieve a balanced economy, sustained economic growth, trade and development and job creation.
- Diversification visions and strategies exist: but there were NO harmonized, comparative, comprehensive, quantitative indicators to measure their progress and guide strategy and policy
- The Global Economic Diversification Index fills this gap, by creating an index based solely on publicly available, quantitative measures with no qualitative/perceptions indicators. The overall Global EDI is composed of three sub-indices tracking
- Output diversification. As commodity exporters diversify, lower their dependence on resource rents and potentially score a higher score on the EDI
- Trade diversification. Greater trade diversifications reduces impact of trade-related & external shocks, increases economic linkages and product complexity
- Government revenue diversification. For non-diversified nations, when price of the commodity falls, there is a significant decline in government revenue, public spending, current account balance and international reserves: more volatility.
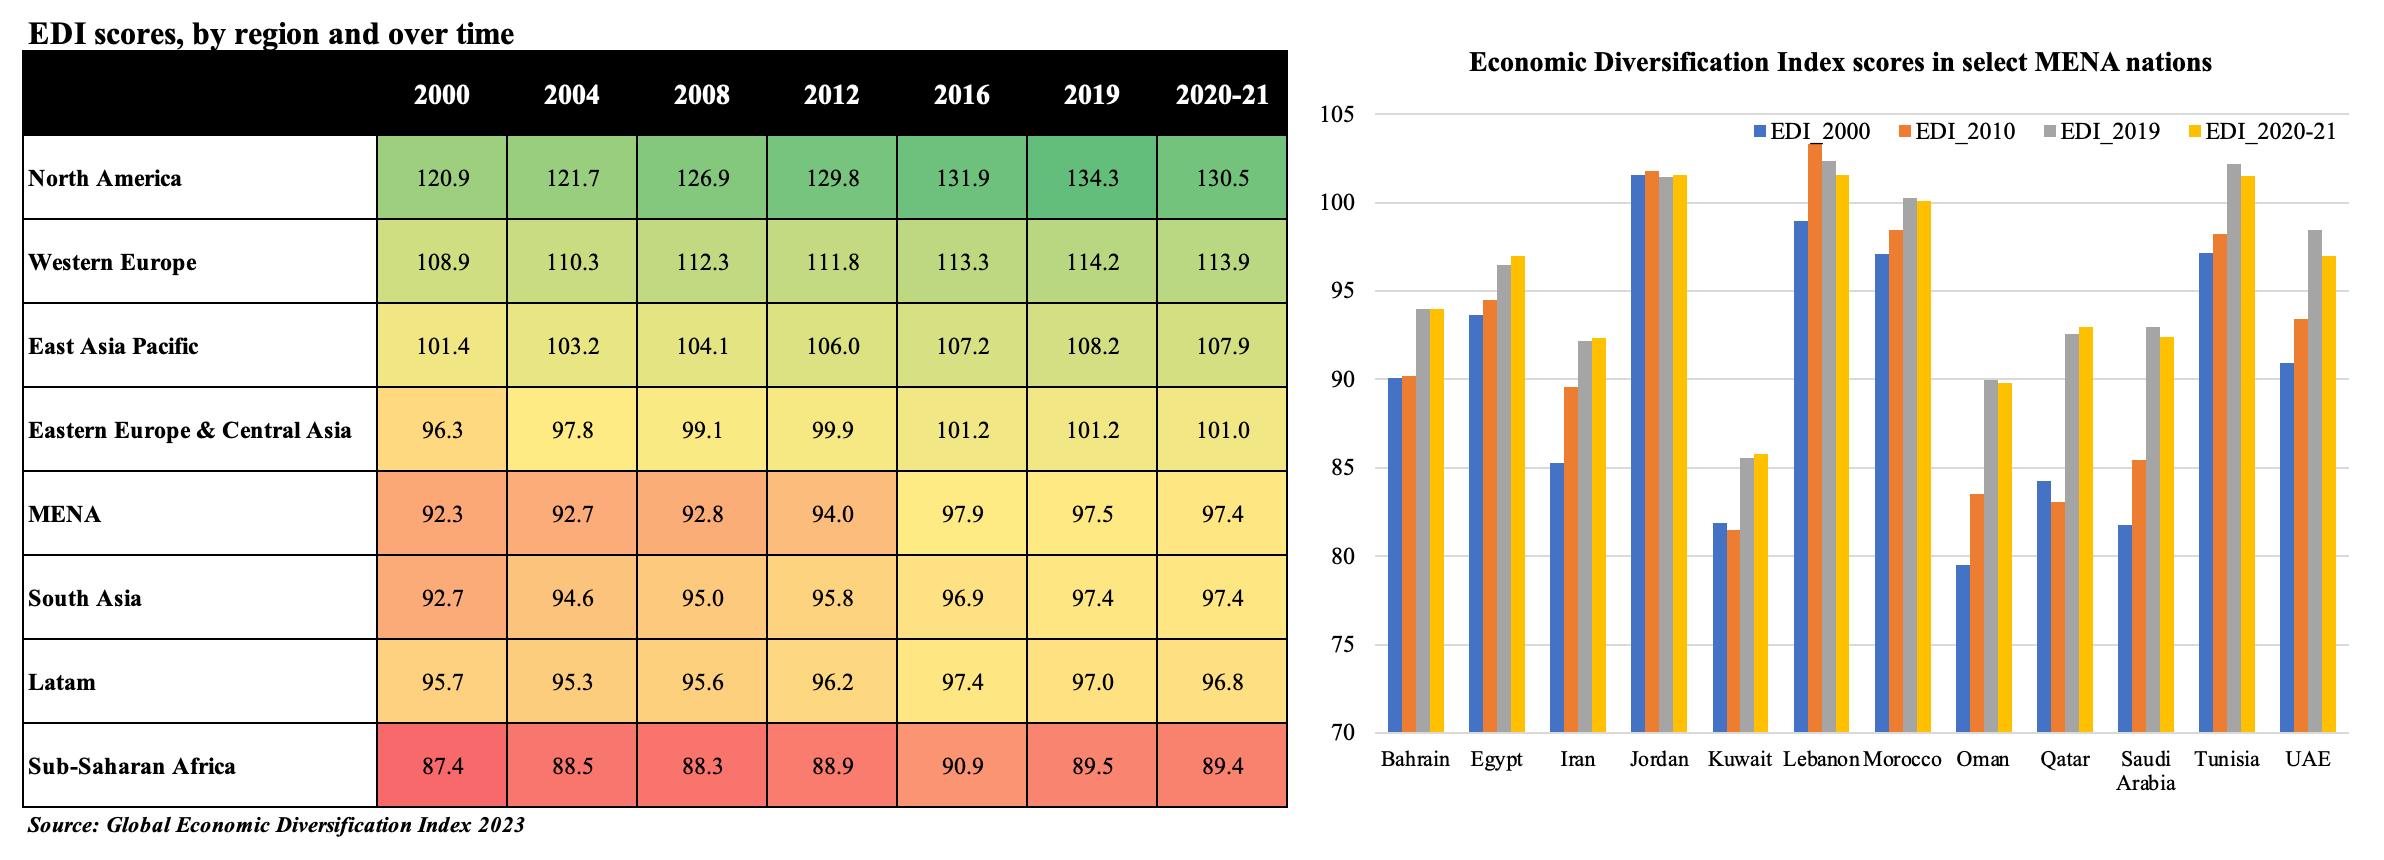
- The Global EDI 2023 tracks performance 105 nations (including major commodity exporters, not limited to just oil) over a period of 22 years (2000-2021).
2. Economic Diversification Index by region
- Prior to Covid, there was a clear divergence pattern in regional diversification paths: North America, Western Europe and East Asia Pacific countries were much ahead of their peers, with the former progressing at a much faster pace. The impact of Covid19 is visible with lower diversification scores across all regional groupings in 2020-21.
- The MENA region had seen an improvement towards the latter part of the 2010s decade as many oil exporters began to accelerate their diversification plans.
- Output diversification sub-index: performance remained very volatile, given oil price fluctuations;
- Trade diversification sub-index: steady improvement in performance thanks to a drop in fuel exports (as % of total exports), increase in manufactured exports (as % of total exports) and a jump in medium & hi-tech manufactured exports (as % of manufactured exports);
- Revenue diversification sub-index: a marginal increase only given lack of tax structures in many oil exporters.
- Among the MENA nations, oil exporters have the lowest scores (though individual country-specific performance has varied over time); Jordan, Tunisia and Morocco have performed better thanks to a relatively more diversified export basket and diverse set of trade partners; Lebanon had been one of the better performers pre-2019, thanks to output diversification.
3. Wide Disparities within Regional Economic Diversification scores
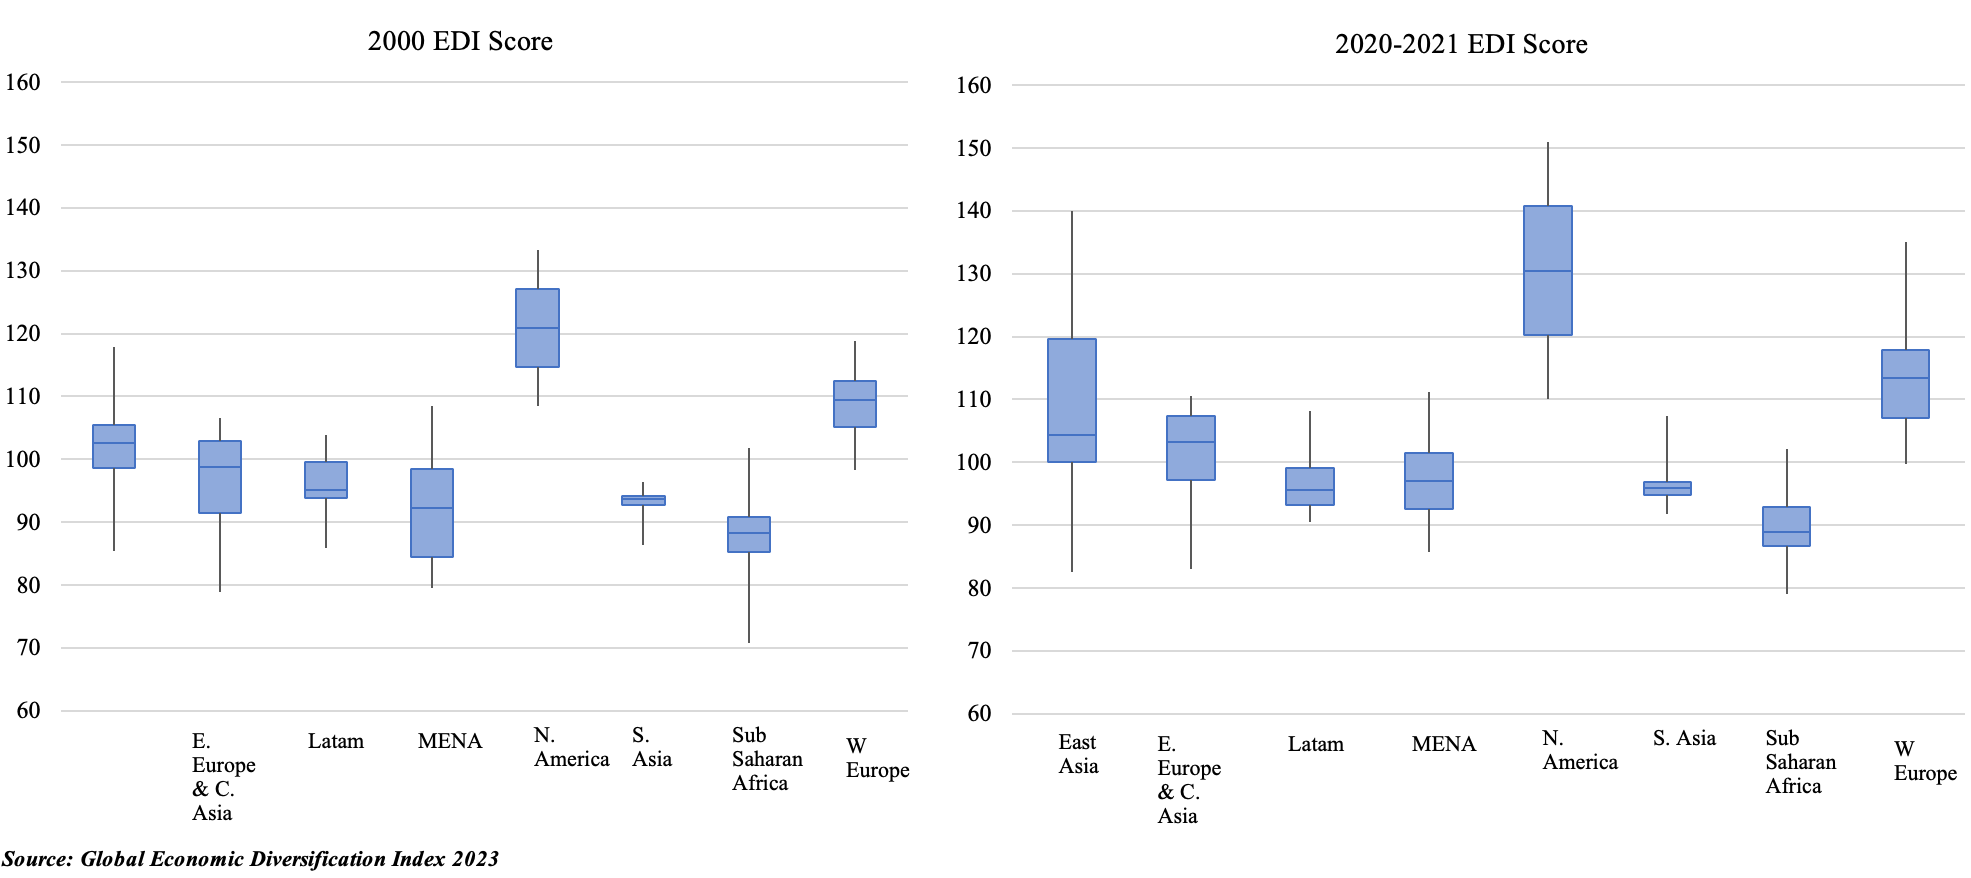
- Across all regions, the median score is the lowest in Sub-Saharan Africa for both 2000 and 2020-21, and the highest in North America.
- In 2000, the gap between the maximum and minimum score was the highest in East Asia (Japan had the highest score in this region, and it was 32.4 points more than the lowest scorer in the region Mongolia). In 2020-21, East Asia’s gap has widened further (China is the highest ranked and its gap with low ranked Mongolia widened to 57.4 points).
- It is interesting to note that the distribution for East Asia is skewed to the right in 2020-21 (i.e. higher EDI scores are more spread out).
- By comparing the inter-quartile range (height of the blue box), least variability is seen in South Asia and Latin America in 2000, and the most in MENA. The variation in scores has reduced only in 2 of the 8 regions: MENA (most, by 5 points) and Eastern Europe and Central Asia (by 1.4 points).
- It is generally the case that commodity producing nations within regions score lower than the median value (e.g. Mongolia in East Asia, or Norway and Iceland in Western Europe).
4. Commodity dependent nations & their performance over time
- Economic diversification has been a recurring policy theme for commodity producing nations for macroeconomic stability and reducing volatility of income, investment, and consumption.
- Australia and New Zealand were way ahead of their commodity-dependent counterparts though the pace of diversification has slowed. While lowest-ranked countries have also improved their score over time, the pace of catch-up has not been sufficient, leaving them in the lowest quartiles still in early 2020s.
- Many commodity-dependent nations are among the richest in the world,be it Norway or GCC nations with high levels of national income per capita. More than one-third of those classified as commodity dependent nations in the EDI fall within the high-income economies grouping by the World Bank. And interestingly, most of these high-income countries are mainly dependent on fuel exports.
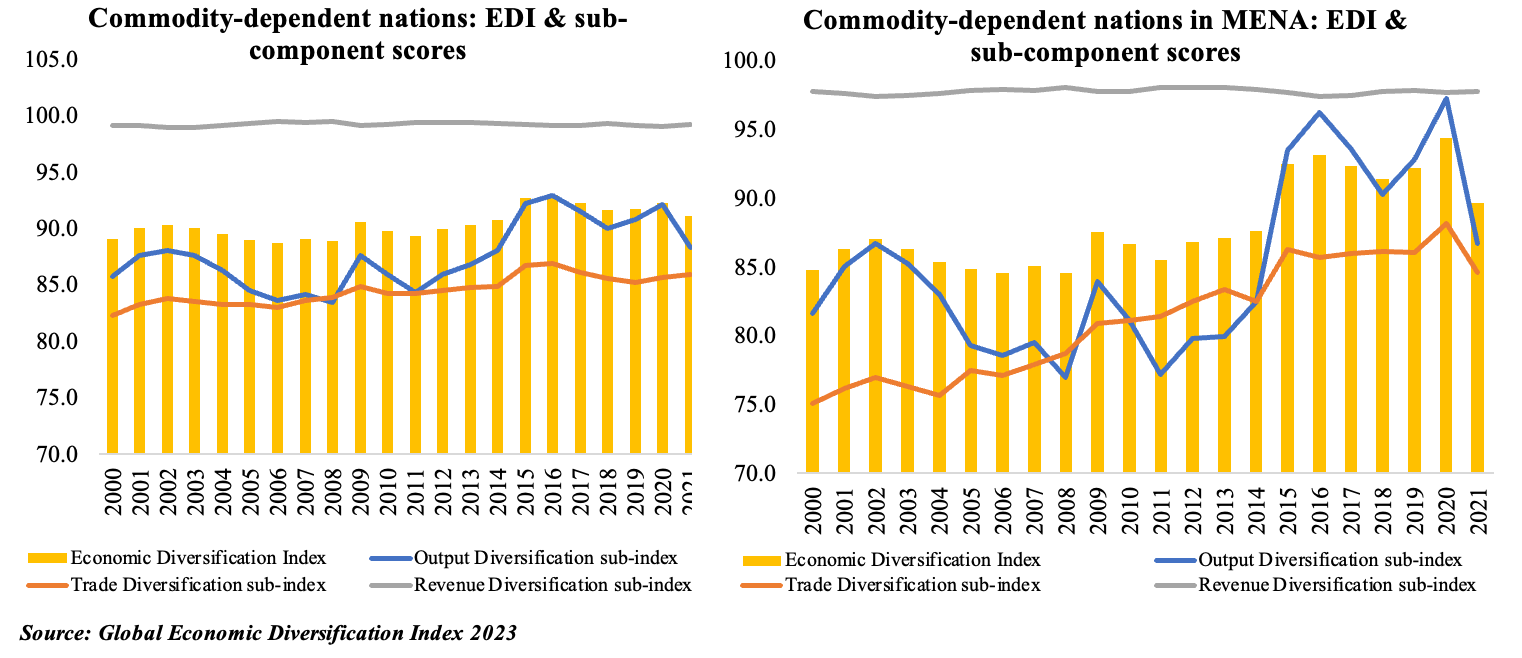
- Including all commodity producers’, there has been an increase in their overall score (from 89.8 in 2000-03 to ~92.0 in the 2016-19 and 2020-21 periods). While gains were recorded in both output and trade diversification sub-indices (volatile in the former), revenue diversification has been holding back overall diversification gains.
- If the analysis is restricted to MENA region’s commodity exporters, the average EDI score shows a significant gain (from 86.1 in 2000-03 to 92.0 in the 2020-21 period), once again supported by (highly volatile) output and (steady) trade gains.
5. GCC’s Economic Diversification performance 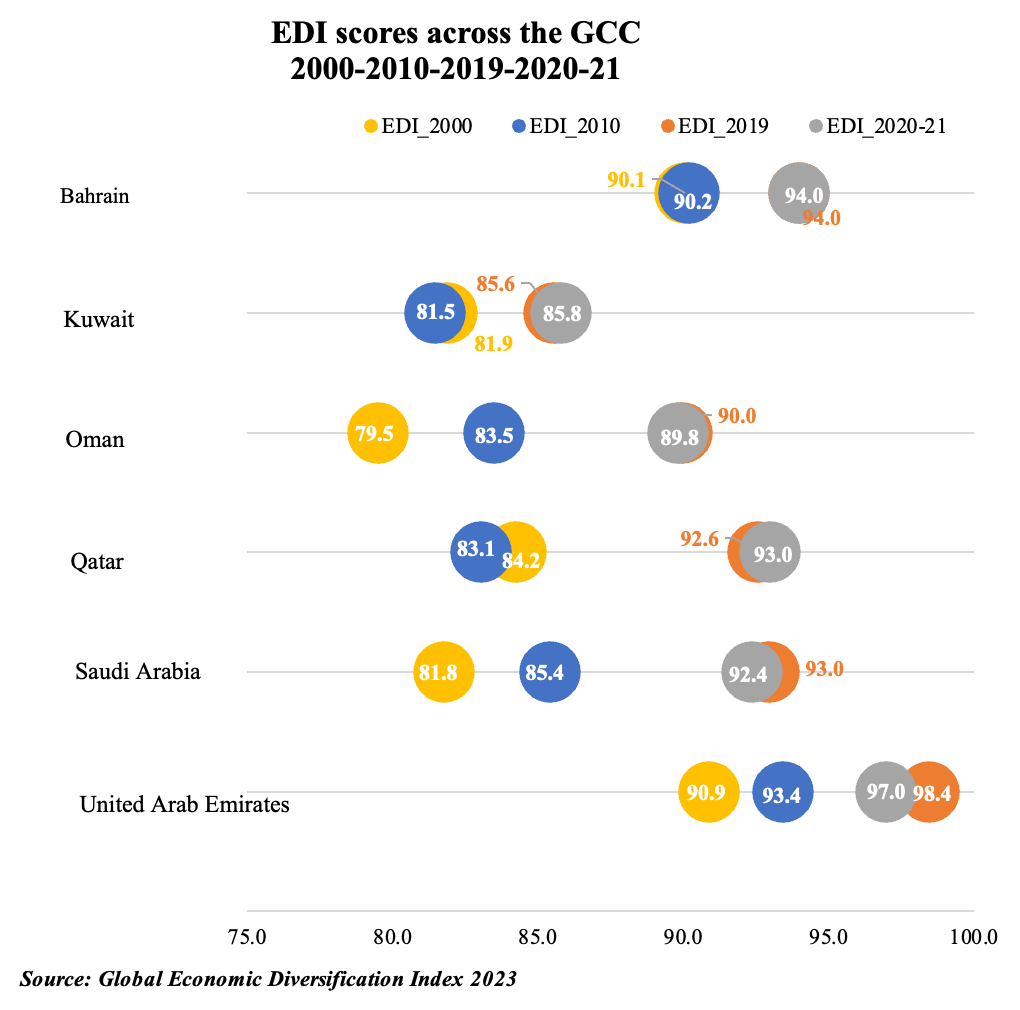
- The GCC region has seen a significant improvement in its EDI scores over the 2000-2019 period, supported by its diversification plans. However, Covid19 has seen a temporary decline in scores, especially as many services sectors were significantly affected.
- Bahrain, with its very limited oil resources, was already diversified among its regional peers in early 2000; however, it has not seen much improvement in its score recently.
- By contrast, the UAE and Saudi Arabia have both moved up the EDI ladder, thanks to policy measures encouraging diversification into the non-oil sector.
- Oman and Kuwait still feature among the lowest ranked, the latter still among the bottom 10 ranks. Oman has initiated reforms to support diversification (translated into an improvement in scores overtime: 90 pre-Covid from 80 in 2000); Kuwait meanwhile has seen a few internal impediments to economic reforms (for example, lack of consensus in the parliament).
- As the GCC manages its post-Covid recovery, many nations have seen an accelerated shift in policies rolled out to enable economic transformation.
- This included structural reforms (especially in the labour market), embracing the digital economy, efforts to broaden the tax base, and a push towards privatising certain state-owned assets.
For interactive visualization of the Global Economic Diversification Index, or to download a copy of the dataset and the latest edition of the report, please visit: www.EconomicDiversification.com
Core EDI team:
Aathira Prasad, Director of Macroeconomics at Nasser Saidi & Associates
Salma Refass, Principal Researcher at Mohammed Bin Rashid School of Government
Dr. Nasser Saidi, Founder and President of Nasser Saidi & Associates
Dr. Fadi Salem, Director of Policy Research at the Mohammed Bin Rashid School of Government
Dr. Ben Shepherd, Principal of Developing Trade Consultants
Powered by: