

Saudi oil exports. UAE & Oman fiscal update. Saudi financing needs 2023. UAE SME lending. Dubai inflation.
Download a PDF copy of this week’s insight piece here.
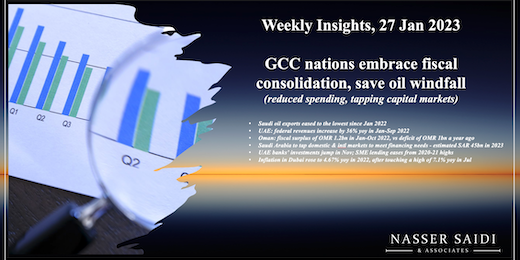
Weekly Insights 27 Jan 2023: GCC nations embrace fiscal consolidation, save oil windfall (reduced spending, tapping capital markets)
1. Saudi oil exports eased to the lowest since Jan 2022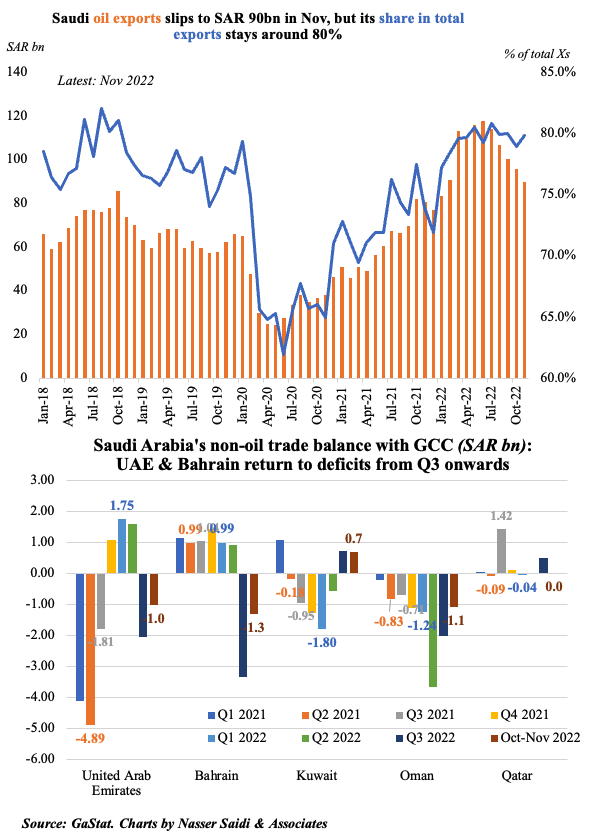
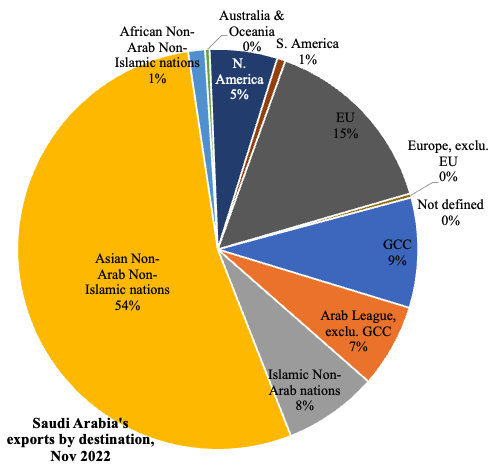
- Oil exports from Saudi Arabia accounted for around 80% of total exports, in Nov 2022in spite of it falling to SAR 90.0bn – the lowest since Jan 2022. Non-oil exports and re-exports were 16.7% and 3.5% of total exports respectively.
- Asia continued to be the largest destination for overall exports (54% share), dominated by oil, while China was the largest export partner (18.3% of total exports) followed by Japan (10%) and India (9%). China was also the largest imports partner (23% of total imports).
- About 8.9% of Saudi exports were routed to the GCC nations; non-oil trade balance with both UAE and Bahrain moved into a deficit from Q3 onwards.
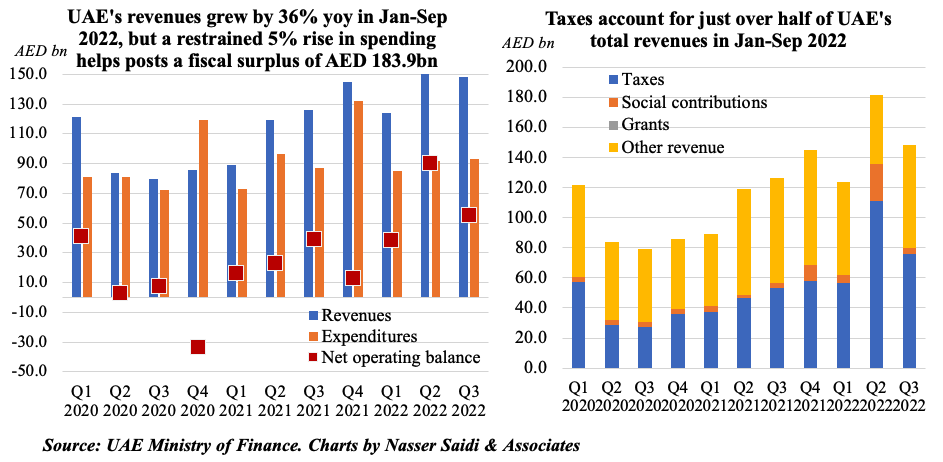
2. UAE: federal revenues increased by 36% yoy in Jan-Sep 2022
- UAE federal revenues rose to AED 453.7bn in Jan-Sep 2022, up 36% yoy. Taxes surged by 78% to AED 243.8bn in that period, or ~54% of total revenues.
- Spending grew by 5% to AED 269.8bn, causing the net operating balance to widen almost 2.4-times to AED 184bn.
- Compensation of employees (32% of total spending) edged up by 1%; subsidies were down 18% to AED 18.6bn.
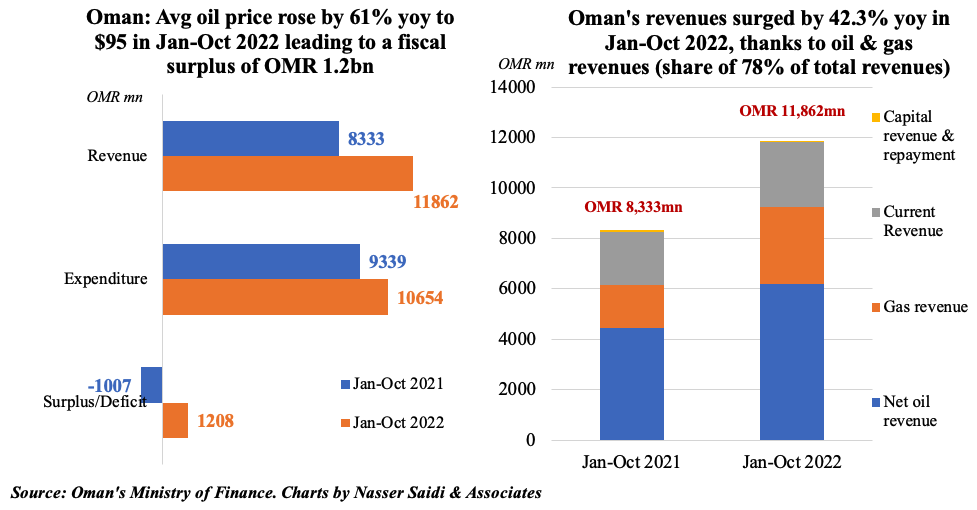
3. Oman: fiscal surplus of OMR 1.2bn in Jan-Oct 2022, vs deficit of OMR 1bn a year ago
- Oman’s revenues increase by 42% yoy in Jan-Oct 2022, thanks largely to the increase in average oil price to USD 95 (+61%). Capital revenue and repayment fell by 62$ to OMR 24mn.
- Expenditure meanwhile increased by 14%, leading to a fiscal surplus of OMR 1.2bn in Jan-Oct (versus a deficit of OMR 1.01bn in Jan-Oct 2021).
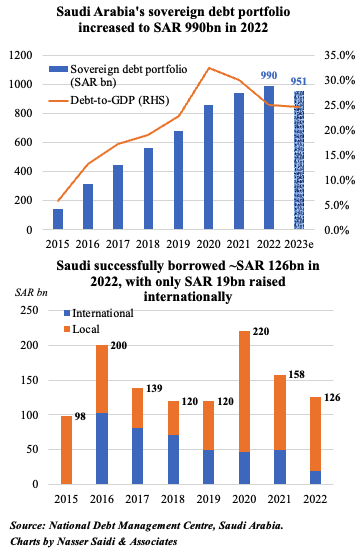
4. Saudi Arabia to tap domestic & international markets to meet financing needs – an estimated SAR 45bn in 2023
- Saudi Arabia’s sovereign debt rose by about SAR 52bn to SAR 990bn in 2022 , or 25% of GDP (2021: 30% of GDP).
- The increase in sovereign debt was thanks to pre-funding transactions which raised about SAR 48bn in 2022 (helping manage interest rate & refinancing risk).
- Of the SAR 125bn in borrowing in 2022, only 15% was raised internationally (vs 40% in 2021), indicating the strength of its domestic debt capital market.
- The official 2023 budget statement estimates sovereign debt to fall slightly to SAR 951bn this year (or 24.6% of GDP). Financing needs stand at around SAR 45bn in 2023 (after securing approximately SAR 48 bn of the 2023 total financing needs in 2022).
- Saudi Arabia’s debt raising guidelines indicate that it will continue to tap domestic & international markets for funding to repay debt maturing in 2023 and in the medium term: in Jan 2023, it had raised USD 10bn in a multi-tranche bond sale. The 2023 debt portfolio split between domestic and international debt will be largely unchanged from 2022.
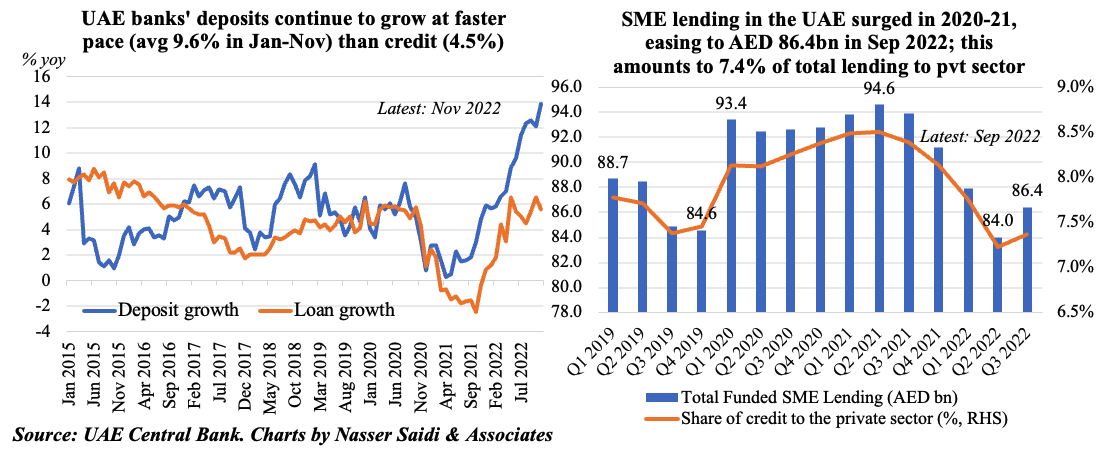
5. UAE banks’ investments jump; SME lending eases from 2020-21 highs; deposit growth outpaces credit for 2 years in a row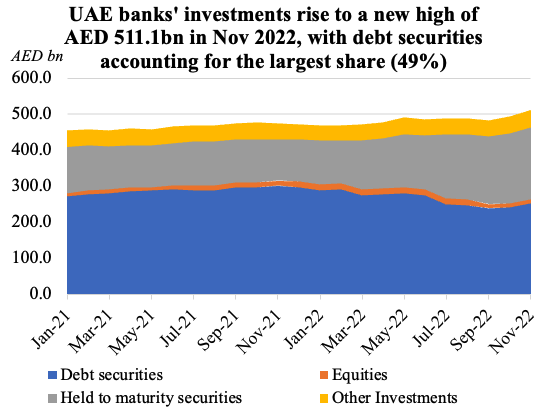
- UAE banks’ investments rose to a high of AED 511.1bn in Nov 2022, up 3.5% mom and 7.7% yoy; debt securities are the largest component (49.1%), followed by held to maturity securities (39.3%).
- Deposit growth outpaced credit growth in the UAE, a visible pattern since the start of 2021. Within credit, lending to the public sector (GREs) were up by 2% mom while that to the private sector nudged up by 0.6%.
- Lending to the SMEs totalled AED 86.4bn as of Sep 2022 and has eased from the highs in 2020-21; it accounts for 4% of total lending to the private sector and 5.2% of overall domestic credit.
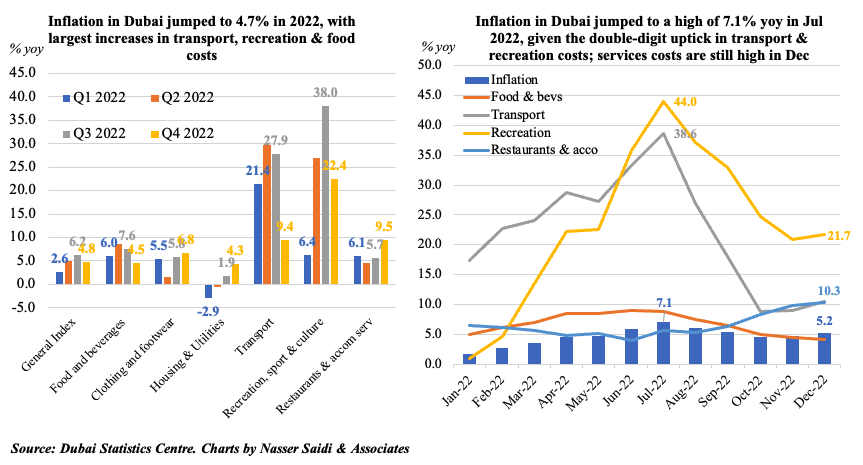
6. Inflation in Dubai rose to 4.67% yoy in 2022, after touching a high of 7.1% yoy in Jul
- Dubai’s uptick in inflation (+4.67% yoy in 2022) was driven initially by rising food, transport and recreation costs – with the latter two surging to double-digit increases till Jul before easing.
- For the full year, costs were higher across all categories except tobacco (-0.49%). The largest increases were in recreation (23.4%), transport (21.9%), food (6.7%) and restaurants & accommodation (6.5%). The chart on the right shows monthly fluctuations. Housing and utilities, which has the largest weightage of 40.68% in the index, showed decline in prices from Jan-May but has been rising ever since (thanks to higher rents): it posted a 0.62% uptick for full year 2022.
- While the overall trend suggests an easing in inflation, lookout for persistent increases in the non-tradeable components (e.g. housing, restaurants, accommodation etc.).
Powered by: