Weekly Insights 19 Aug 2021: Charts of the Week (Global Trade Recovery + Middle East’s Tourism Indicators + Fiscal deficits in Bahrain & Kuwait + Consumer & Producer Prices + Industrial Production in Saudi Arabia)
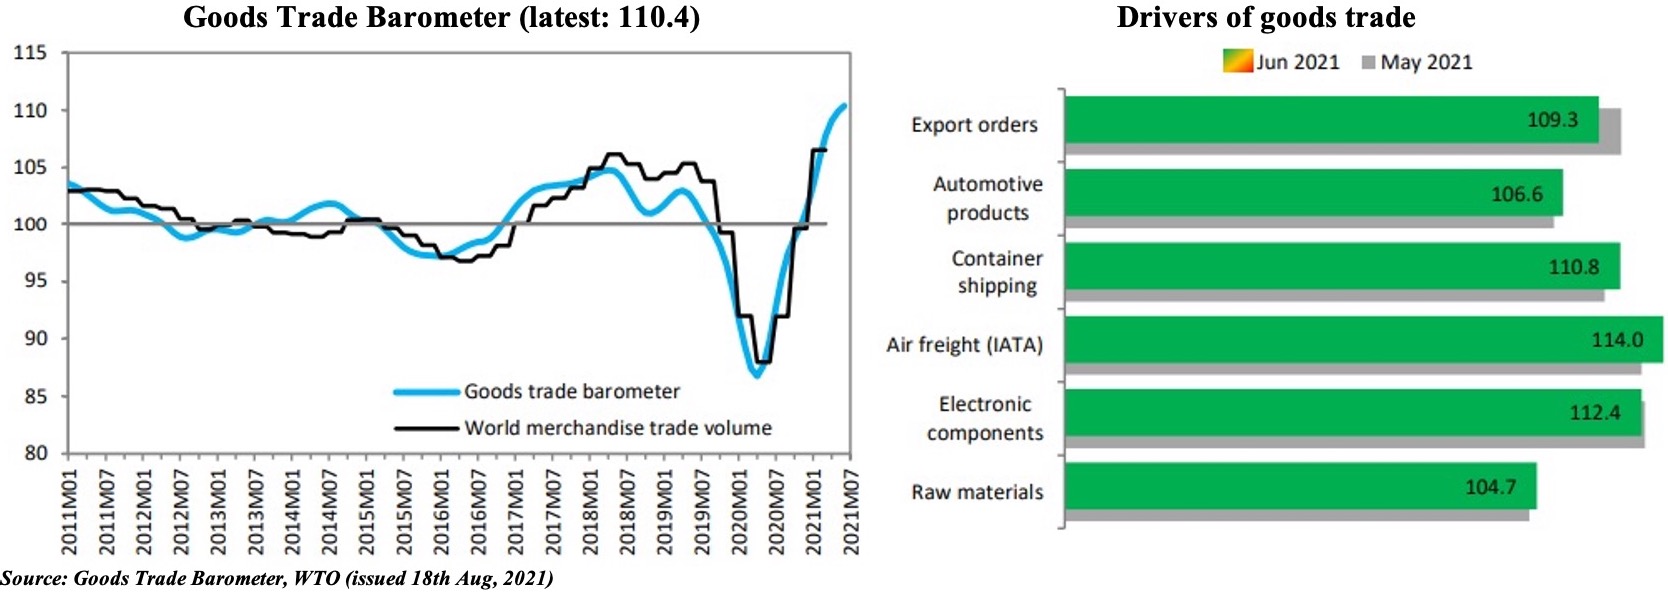
1. Recovery in trade in 2021, though the pace is slowing; port closures to lead to delays & higher costs
- The WTO’s latest Goods Trade Barometer, with a record high reading of 110.4, underscores the strength of recovery: it is up more than 20 points in year-on-year terms. However, data suggest that the index is rising at a slower pace. Overall, the WTO expects world merchandise volume to grow by 8% this year (vs 2020’s 5.3% drop).
- All components identified as drivers of trade were above trend (100): but the easing of the forward-looking export orders in Jun (vs May) suggests that the uptick seen in the earlier months might be slowing. This is also evident from recent PMIs: rate of expansion in JP Morgan’s global manufacturing PMI had slowed further from May’s 15-year high.
- Furthermore, supply chain disruptions will continue to have a negative impact: the recent closure of the Ningbo Zhoushan port in China (following a Covid19 case) is leading to congestion at several other Chinese ports & likely lead to delays as well as uptick in freight charges. Case in point: Freightos Baltic Global Container Index, a weighted average of 12 major global container routes, hit a record high of USD 9,770 per forty-foot equivalent (FEU) container this week.
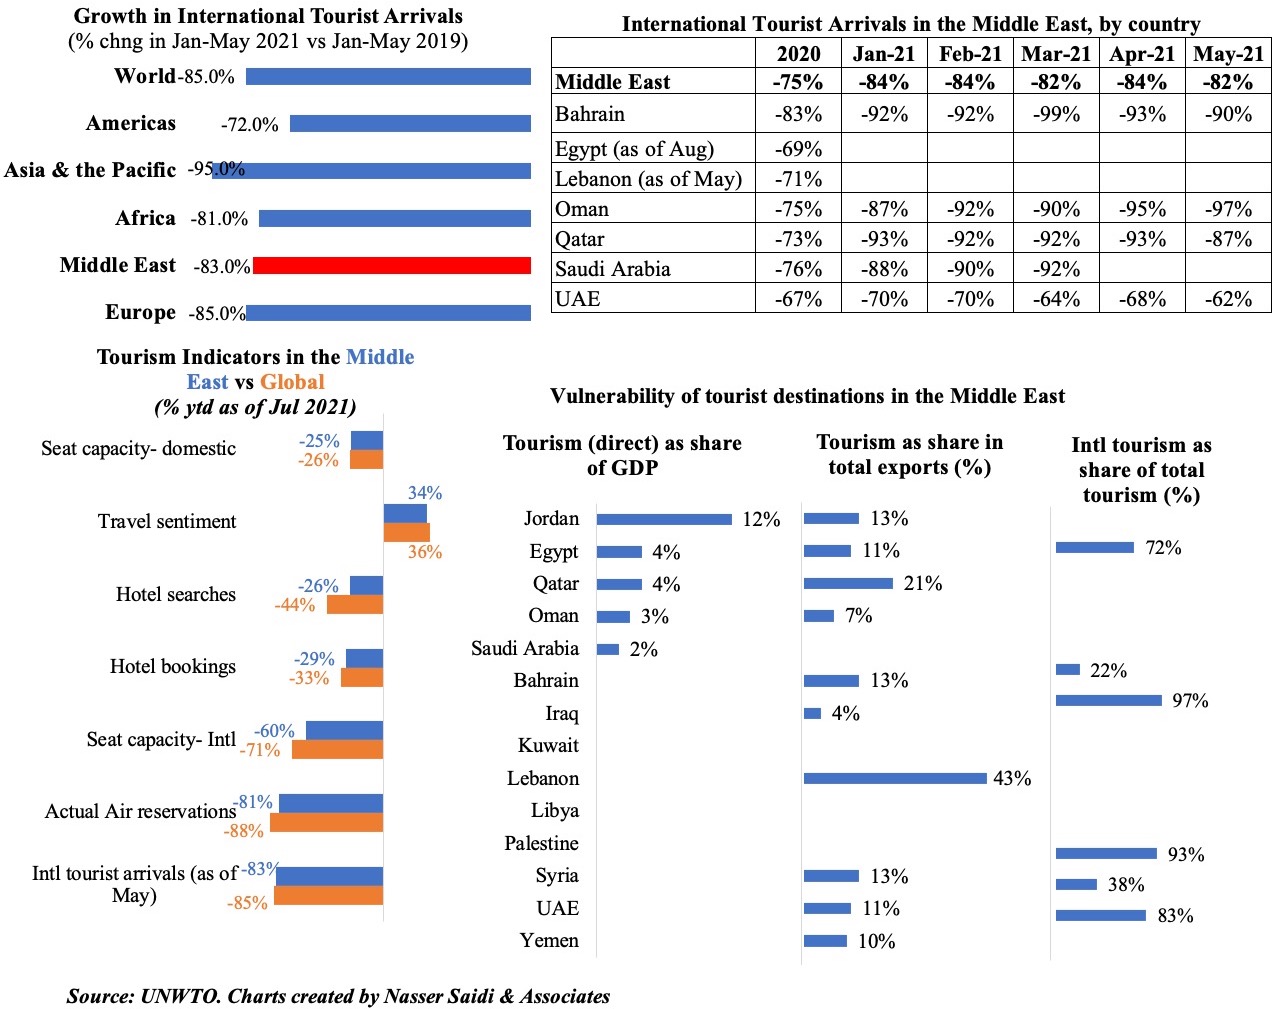
2. Tourism: As regions with large domestic markets recover faster, no surprise that the Middle East lags
3. Bahrain’s deficit narrows in H1 2021, thanks to a rise in oil revenues; debt needs taming
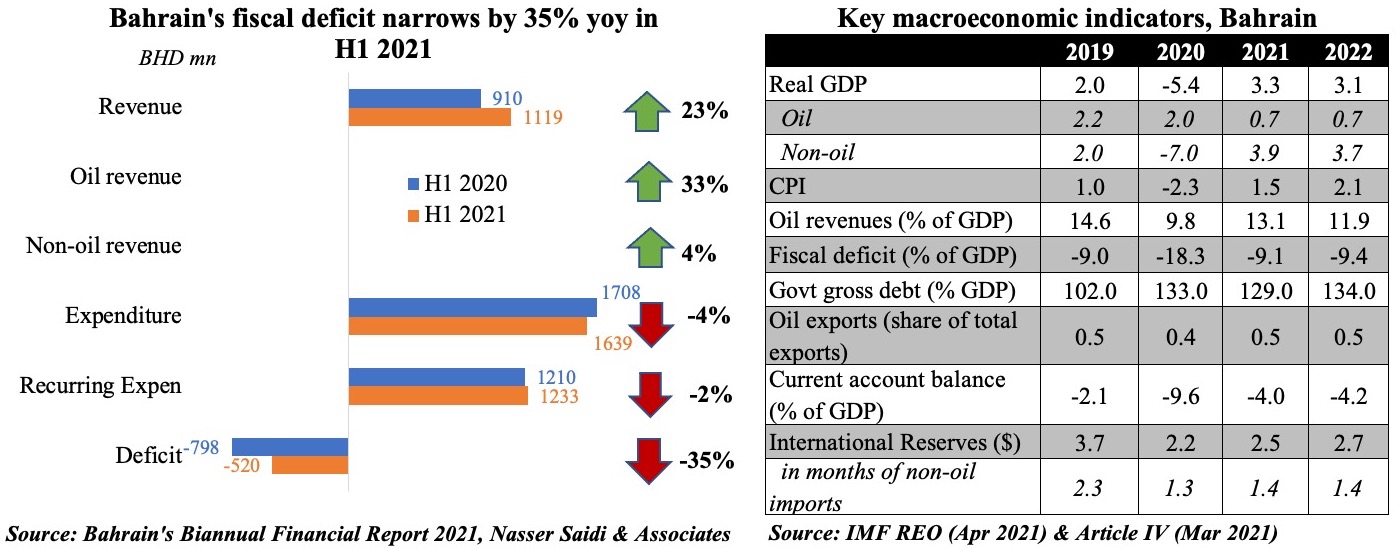
- Budget deficit in Bahrain narrowed to BHD 520mn in H1 2021 (-35% yoy), supported by a 23% pick up in revenues (largely due to the 33% rise in oil revenues).
- Overall, revenues (& expenditures) in H1 account for 46.5% (& 45.4%) of the total budgeted for the full year 2021. The budget, based on oil price at USD 50 per barrel, is estimated to post a deficit of BHD 1.2bn in 2021. According to the IMF, the fiscal breakeven price for Bahrain is USD 88.2 this year & USD 85.8 in 2022.
- Bahrain needs to reduce debt once economic recovery is back on track: its gross public debt rose to 133% in 2020 and is forecast to increase to 155% by 2026. Its gross external debt is meanwhile projected to ease slightly to 245.6% of GDP this year (2019: 225.7% & 2020: 257.7%).
4. Kuwait’s fiscal deficit almost triples in 2020-21 vs a year ago; salaries & subsidies continue to account for a substantial portion of overall expenditure
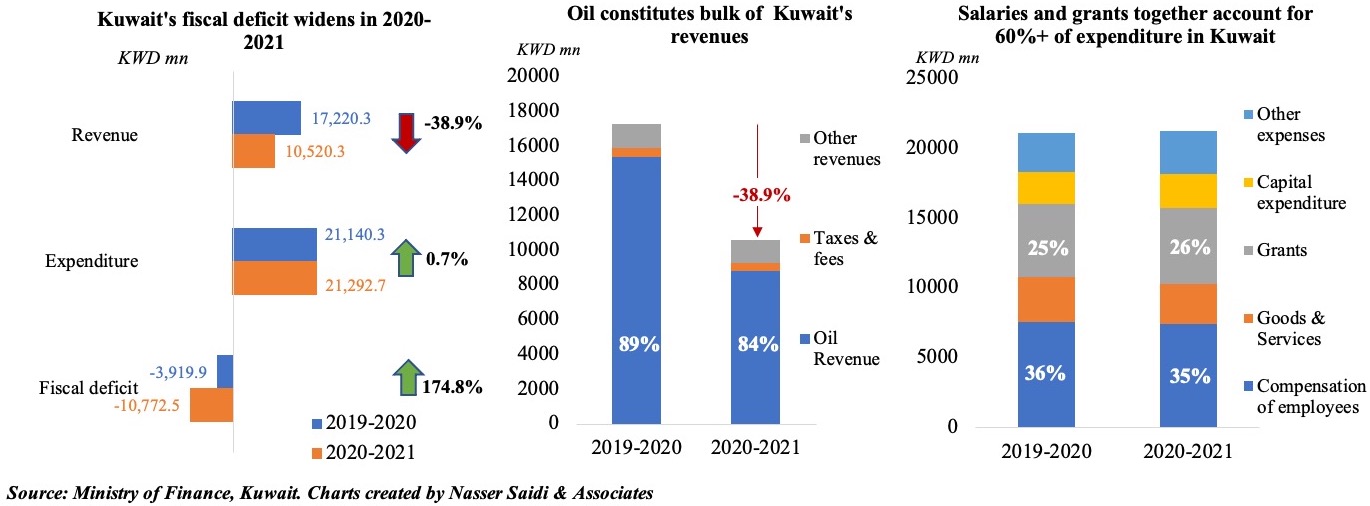
- Kuwait posted a fiscal deficit of KWD 10.8bn in 2020-21, compared to USD 3.9bn a year ago.
- Revenues plunged by 39% yoy in 2020-21, largely due to a 42.8% drop in oil revenues; taxes and fees fell by 10.6%. Oil revenues accounted for 84% of overall revenues last year and close to 90% the year before
- Overall expenditures was little changed (+0.7% yoy) and its composition remained more or less steady: salaries and grants together accounted for 60% of overall expenses; a 10% drop in goods & services was offset by a 12% uptick in other expenses
- It is hence little wonder that the Cabinet announced this week that all government departments are to reduce spending by no less than 10% in the current fiscal year (2021-22). Furthermore, the government is considering a maximum threshold (of KWD 3000) for the disbursement of national labour support to private sector employees
- Kuwait’s debt levels are substantially lower (vs Bahrain), but it urgently needs to: (a) boost its non-oil revenues with the introduction of VAT; (b) reduce subsidies and introduce other expenditure-reducing measures; and (c) push Parliament to pass the debt law which has limited its ability to issue international debt to finance spending (among others)
5. Prices are on the rise in Saudi Arabia (taking into consideration effect of a higher base last year) while industrial production gains (due to oil)
- Consumer price inflation slowed to 0.4% yoy in Jul, largely due to the uptick in Jul 2020 when VAT was hiked to 15% (on a monthly basis, prices were up by 0.2%). However, food costs are now up 8.4% on avg this year (till Jul) vs overall inflation at 4.8%
- Wholesale prices increased to 11.9% yoy in Jul (Jun: 19.76%), as the effect from the Jul 2020 VAT hike dissipates. Other transportable goods, with a weightage of 33.72% and which includes refined petroleum products prices, reported the largest rise during the month (+20.49%). Rising global prices of metals and electrical machinery are also reflected in the country.
- Lastly, industrial production in Saudi Arabia increased by almost 12% in Jun 2021, attributed mostly to the increase in oil production as non-oil manufacturing sector activity dropped by 4.2% yoy and 0.4% mom.

Powered by:


