Weekly Insights 25 Mar 2021: Will the Middle East’s vaccination efforts lead to a faster recovery in travel & hospitality?

Download a PDF copy of this week’s insight piece here.
 
Chart 1. Covid19 cases in the Middle East continue to rise at a varied pace

  • The GCC nations account for one-fourth of the cases in the MENA region. On a per million basis, cumulative Covid19 cases are high in Bahrain and Lebanon. The total number of confirmed cases have doubled in 72 days in Lebanon, 76 days in UAE and 267 days in Saudi Arabia (vs global average of 117 days).
  • Where Covid19 cases are still high, economic activity will be relatively softer in Q1 2021. Many nations, including the UAE, saw an uptick after the December end-of-the-year holidays. Saudi Arabia and Egypt are faring better in spite of the recent increase in cases.
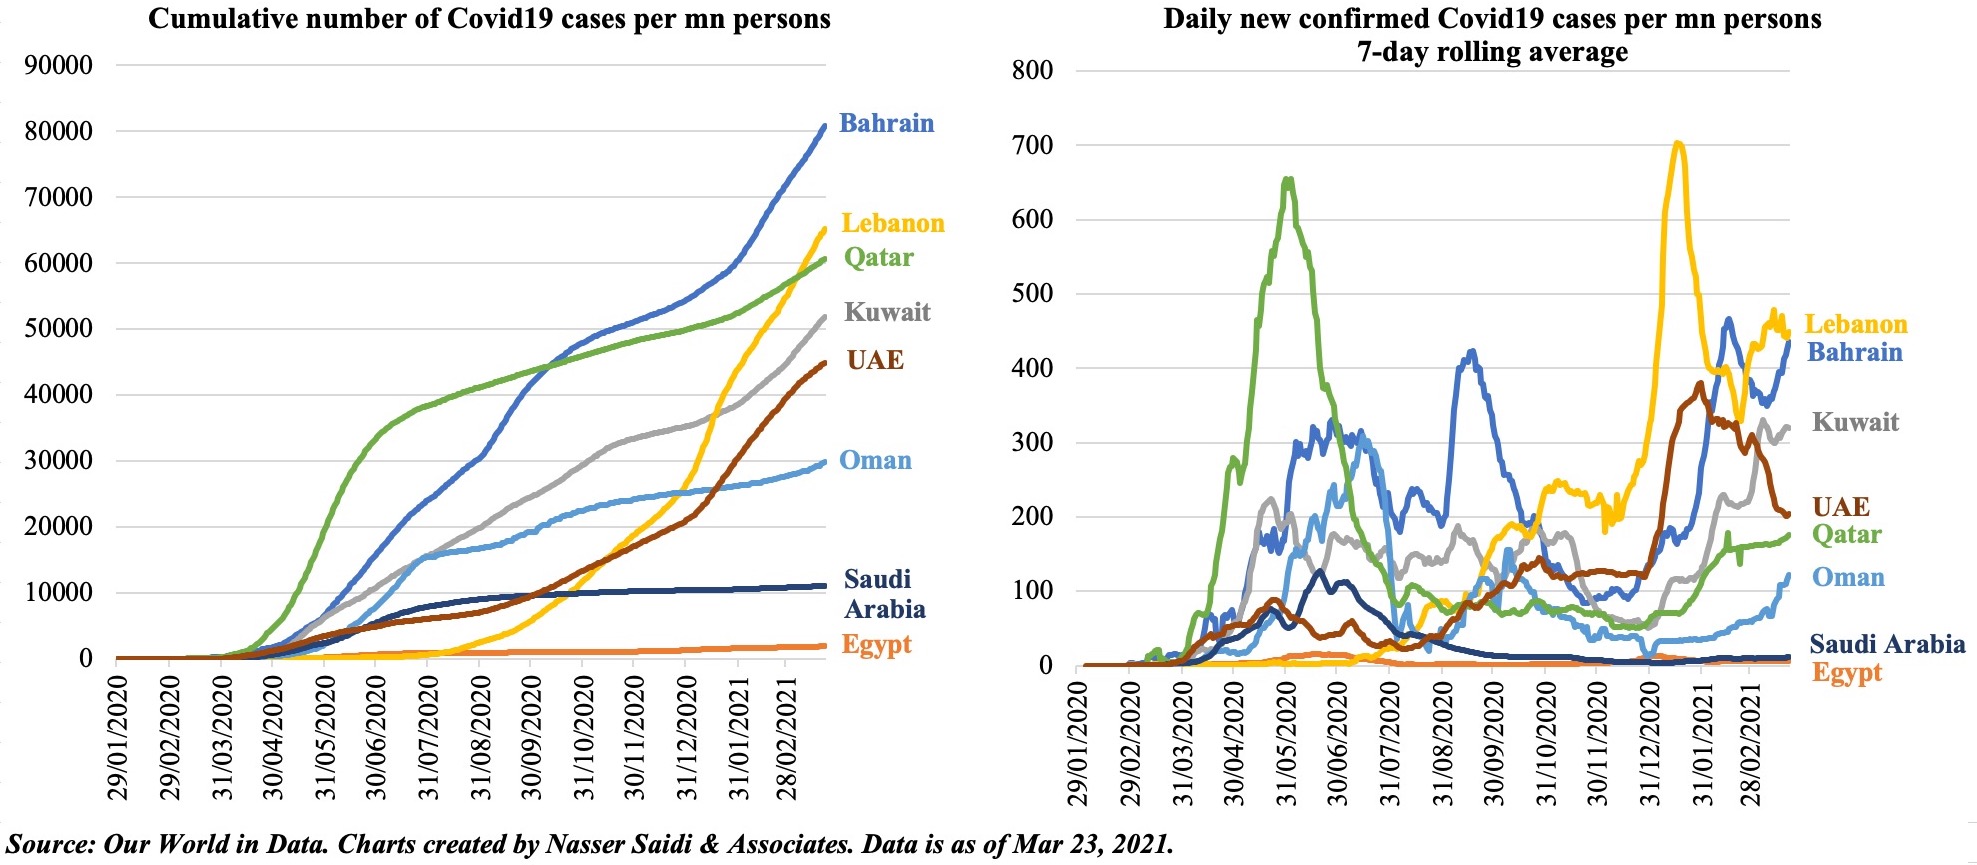

 
Chart 2. Will life return to normal after vaccination? Pays not to be complacent

  • The vaccination rollout is expected to reduce the pace of number of new infections.
  • The UAE, which has one of the fastest rollouts of the vaccines globally, has seen a significant reduction in infections.
  • Though breakdowns by age or hospitalizations are not available in the UAE, improvements for the vaccinated elderly population was a clear result in the case of both UK and Israel – the closest to UAE in terms of vaccine rollout numbers.
  • Last week, UAE announced that vaccines had been administered to 70.21% of the elderly and people with chronic conditions and to over 50% of the population. For now, extra precautions are still being adhered to in the UAE (its stringency index is close to 55) with Ramadan around the corner.
  • With cases ticking up in neighbouring India (test positivity rates are now doubling every five days in several states) due to a new variant with two mutations and easing of lockdown restrictions, and Europe’s delayed vaccine rollouts amid rising case of infections, it would be prudent for the UAE to remain cautious till herd immunity is achieved (given its relative openness).
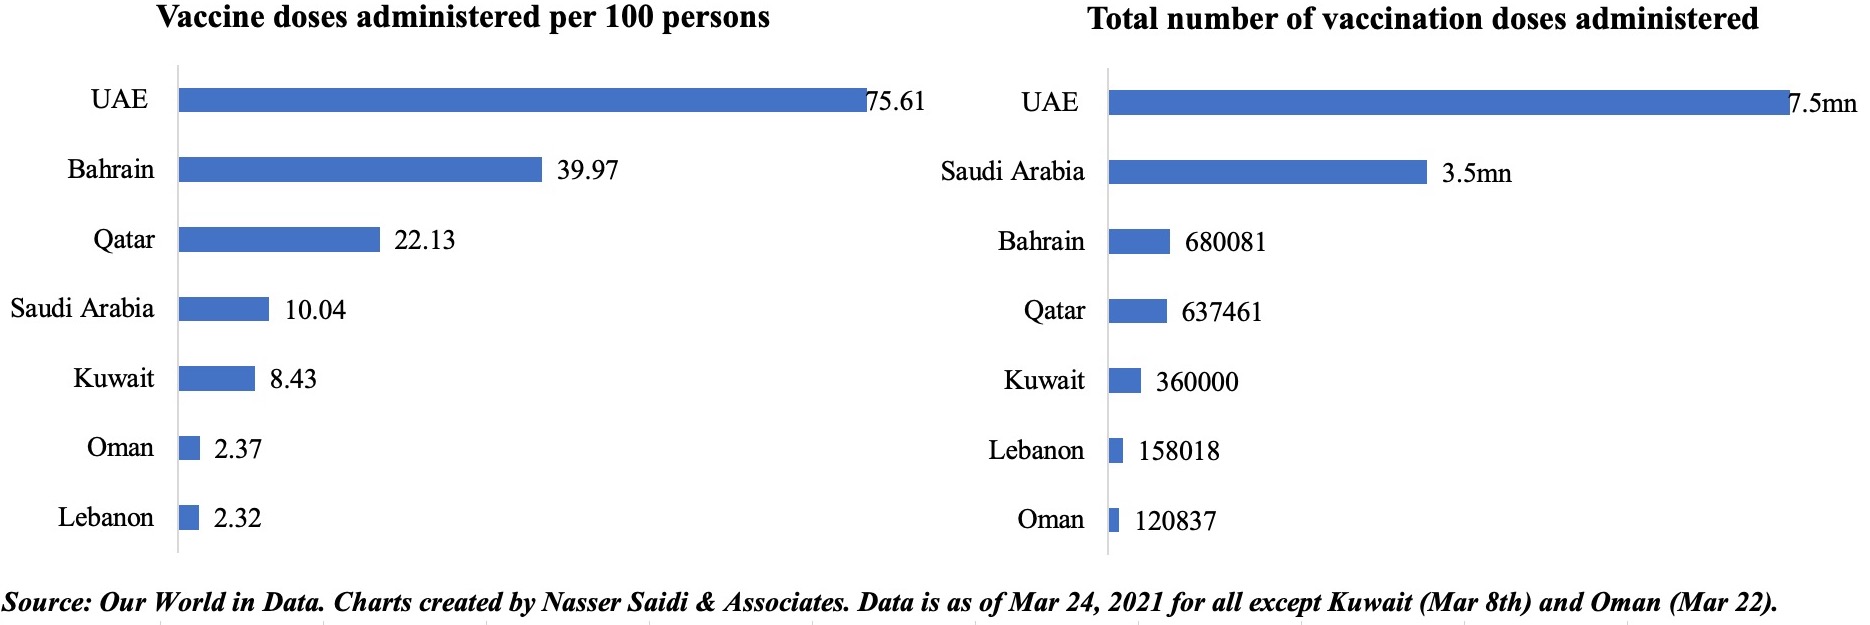

 
Chart 3. With the Stringency Index near the half-way mark, mobility has been improving

  • Mobility – a proxy for economic activity – has improved across the board from pandemic lows.
  • Mobility indicators indicate a strong negative relation with the Stringency Index: the tighter the government-imposed restrictions, the stronger is the observed reduction in mobility. Stringency index is around 55 in the case of Egypt, Saudi Arabia and the UAE.
  • While retail and recreation mobility remains below pre-pandemic levels given the restrictions on capacity, grocery shopping seems to have gone back to pre-Covid levels in Egypt though not as much in UAE and Saudi Arabia – potentially a result of the rise in e-commerce offerings in this space.
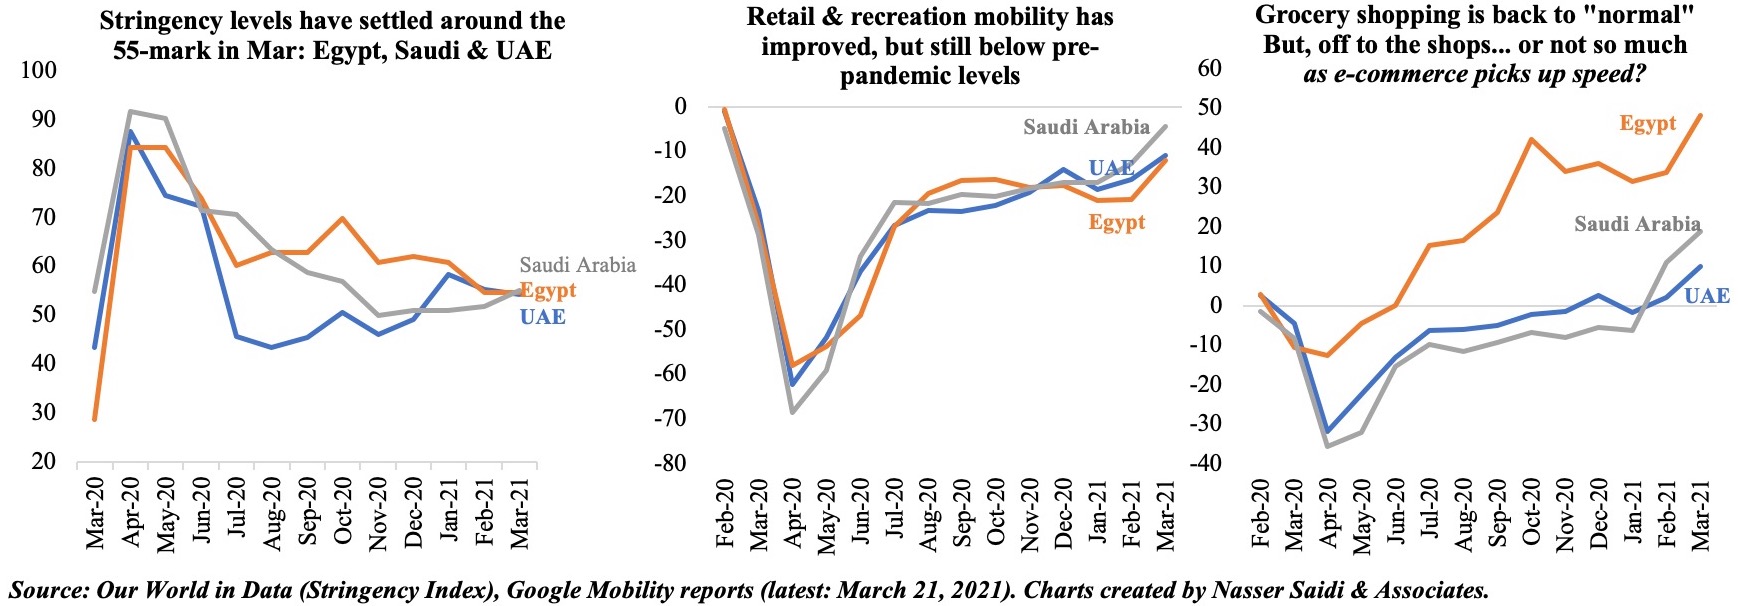

 
Chart 4. Hotel occupancy levels supported by domestic tourism and few travel corridors

  • Middle East’s hotel occupancy rates were the highest on a rolling 7-day average ending with 7 Feb (50.4%) as residents opted for domestic tourism vs international travel (STR Global).
  • As can be seen from the chart, a brake was applied on China’s fast-paced recovery with this year’s wave of Covid19 cases, which also affected the busy Chinese New Year travel period.
  • The Middle East & UAE saw total-year hotel occupancy & revenue per available room levels fall to all-time lows in 2020.
  • The performance towards end of the year was closer to pre-pandemic levels, thanks to the New Year holidays and ease in restrictions (including travel corridors). Dubai posted a 76% occupancy level in the week ending Jan 3rd, followed by Al Khobar & Dammam (72%), Abu Dhabi and Jeddah (at 62%)
  • Markets that are likely to see faster paced recovery are UAE and Saudi Arabia, given government initiatives and policy support
  • UAE will be helped by its relatively lower stringency levels, hosting of the Expo later this year as well as its recent announcement of multi-entry visit visas. Rollout of the IATA Travel Pass/ digital health passports will support recovery. Vaccine tourism is also a possibility.
  • Saudi Arabia will benefit, with its relatively low number of cases, as it resumes religious tourism alongside its ambitious tourism plans (186 projects/66,866 rooms were in the construction pipeline at end-2020).
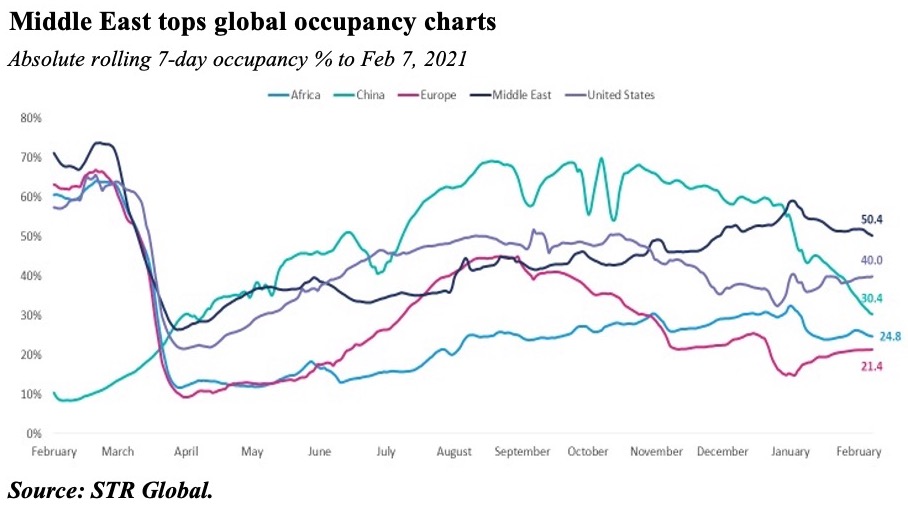
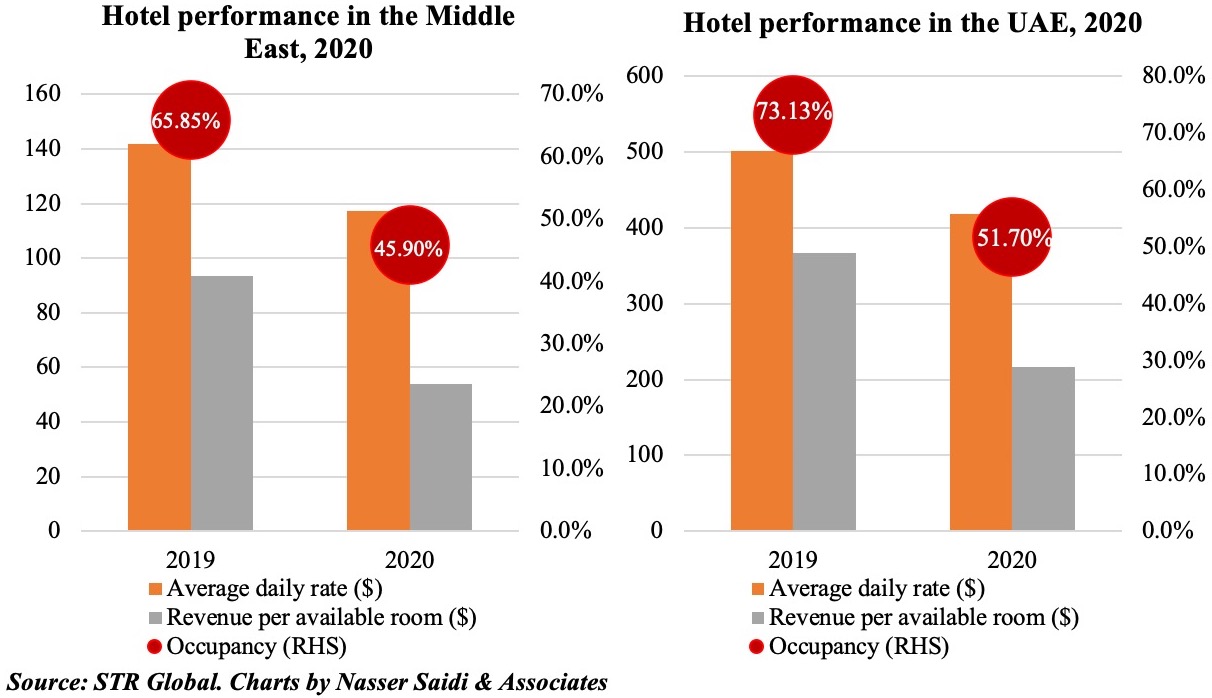

Chart 5. Passenger traffic likely to remain subdued; but with some silver linings

  • Air travel has been negatively impacted by the new round of travel restrictions. Asia has the most stringent controls related to air travel (closed to many regions) & the Middle East the least (quarantine for arrivals for high-risk regions).
  • Passenger activity in the Middle East was 72.2% yoy lower in 2020; in Jan, it was 82.3% lower than pre-crisis Jan 2020. A breakdown by routes show the sharpest drop in the Middle East-Asia sector last year (-73.7%)
  • As vaccinations increase in the Middle East, the demand for international travel will pick-up, given pent-up desire to travel and high individual savings rate
    • Given the expat population in the region, travel to “leisure” destinations is likely to pick up (so long as their source nations are still under pressure from Covid19 cases).  Anecdotal evidence points to UAE residents opting to visit Seychelles and Maldives during the upcoming school break (India is facing a new wave of Covid cases, UK has a mandatory hotel quarantine etc…)
    • There is also a potential of increased visits from grandparents: being the first ones to get vaccinated, evidence already shows an uptick in airline bookings among the 65+ year olds in the US making up for missed family visits during 2020. Likely to benefit the Middle East nations, especially the UAE.


Chart 6. Air cargo levels rebound to pre-pandemic levels; UAE hubs support vaccine deliveries

  • A recovery in export orders from Covid19 lows implies that the recovery in air cargo services has rebounded much faster vis-à-vis passenger traffic. However, lack of capacity (-18.7% yoy in Nov-Jan) is still a constraint.
  • Middle East-North America and Middle East-Asia are two of the strongest trade lanes globally.
  • Middle East’s volumes (measured by cargo tonne km flown) regained pre-crisis levels in Jan, with CTKs 2.2% yoy higher than Jan 2019.
  • Though cargo revenues are growing stronger, these are unlikely to offset the loss of passenger revenues.
  • UAE’s Emirates SkyCargo has flown more than 27,800 cargo flights to deliver medical and food supplies to communities hit by Covid19. It also signed an agreement with UNICEF in Feb to transport critical supplies like Covid19 vaccines, medicines and medical devices.
  • In Mar, Abu Dhabi Ports and the Hope Consortium revealed the largest vaccine distribution centre in the Middle East – a 19k square metre temperature-controlled warehouse with a capacity to hold 120mn+ vaccines – which serves as a hub for vaccine distribution in the MENA, Africa and South Asia.


 
Powered by:


Weekly Insights 23 Dec 2020: V or W-shaped recovery? Surge in Covid19 cases & new strain to dampen growth in Q4

Download a PDF copy of this week’s insight piece here.
 
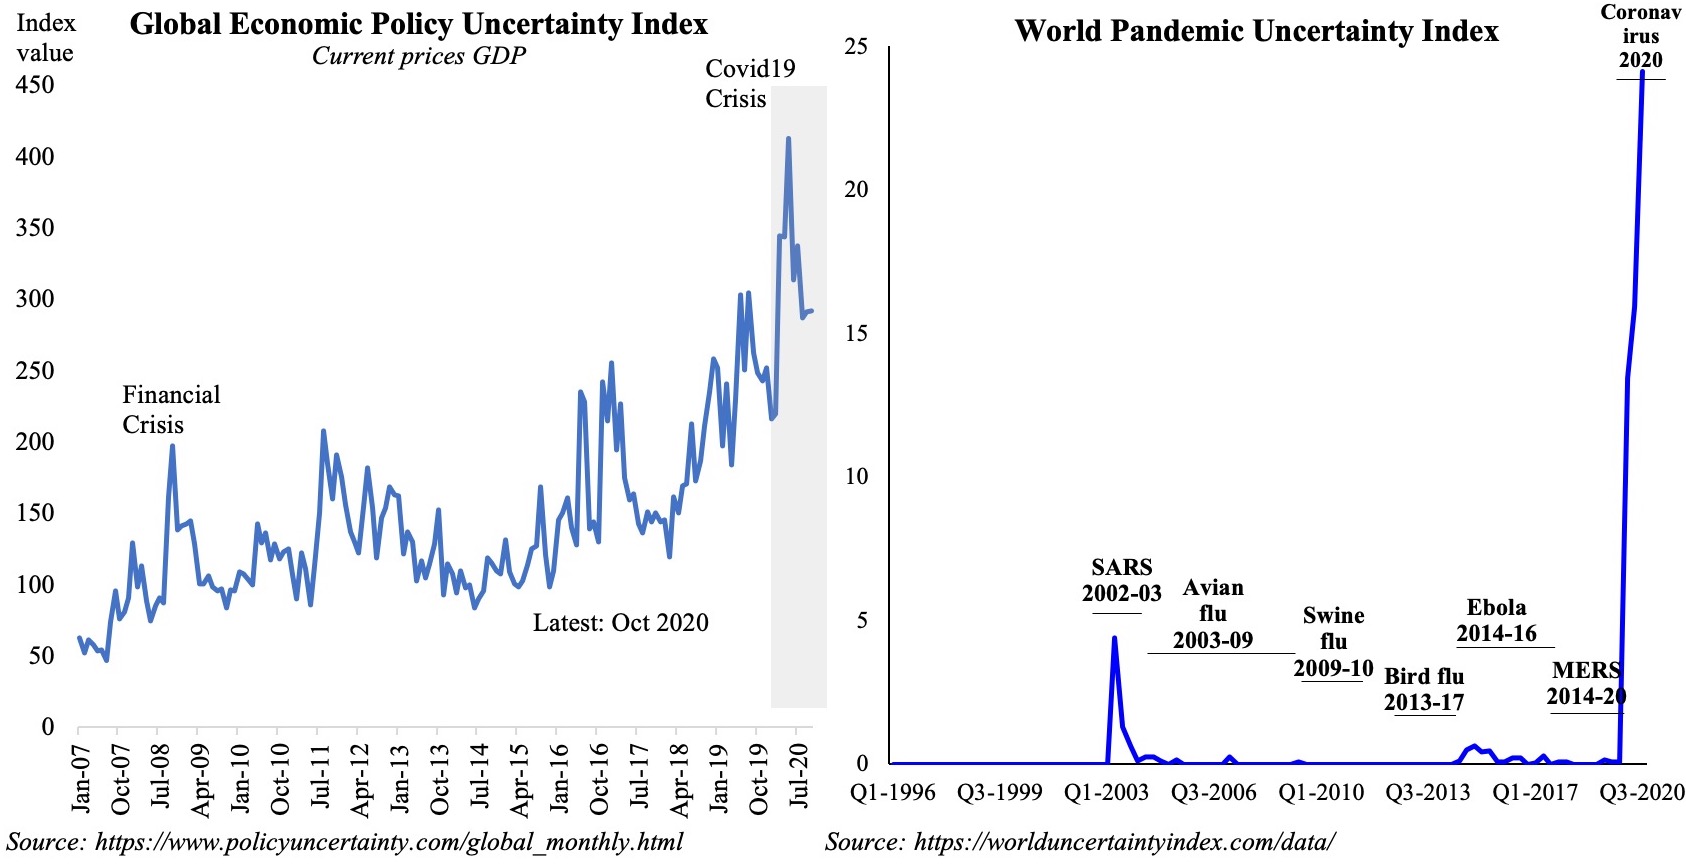
Chart 1: Uncertainty in the time of Covid19

Both Economic Policy Uncertainty and Pandemic Uncertainty indices touched record-highs during the Covid19 crisis. Even with vaccines being rolled out, a new strain of Covid19 in UK has led to stricter lockdown measures, border closures and travel bans.
Policy Uncertainty has been severely high this year, when compared to the global financial crisis or Brexit referendum or the US-China trade war phase. With fiscal and monetary responses continuing to support economies, care should be taken to ease the withdrawal of support in the future.
Countries need to be prepared for a phase of unemployment and wave of business closures when exiting the crisis.


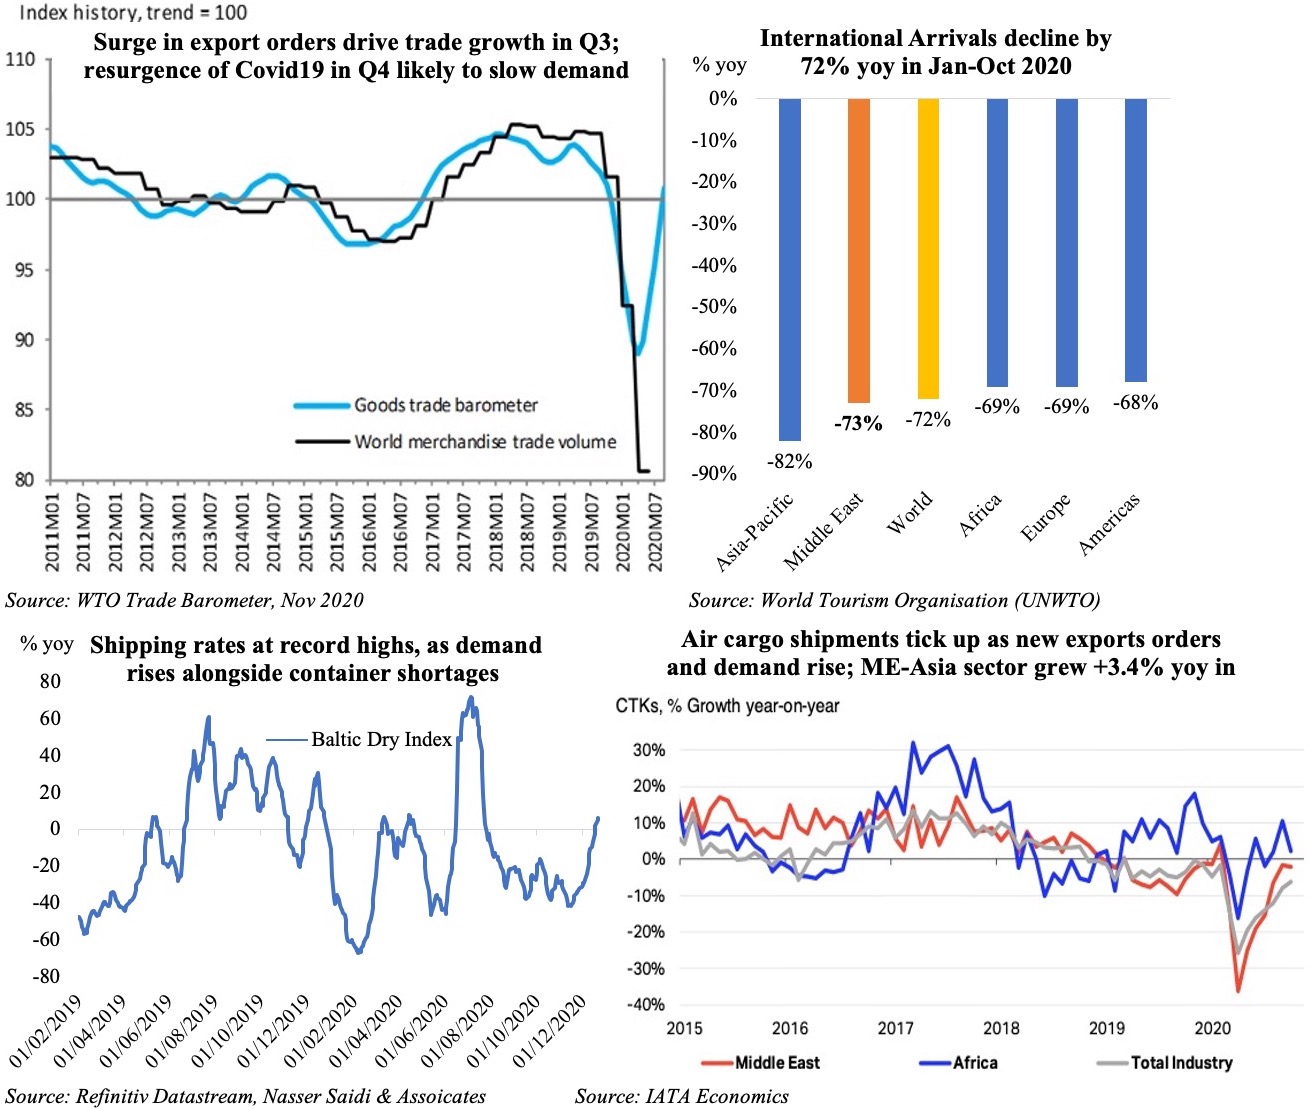
Chart 2: Trade bounced back in Q3, but will the current surge lead to another drop? Tourist Arrivals remain dismal
Trade growth recovered in Q3; but recent surge in cases, a new strain and related closures will likely result in lower demand & dip in trade in Q4.
Meanwhile, thanks to the recovery in new export orders, both shipping & cargo indicators are turning positive.
As international air travel as not picked up, air cargo has suffered, thereby directing demand towards shipping. However, as the holiday season got underway towards end-2020, demand ticked up, but container shortages are leading to higher shipping rates.
Tourism remains unlikely to recover to near pre-pandemic levels till vaccines reach a substantial proportion of global population. Prior to the recent surge in cases, domestic tourism (& therefore air travel) had picked up in Europe and Americas.


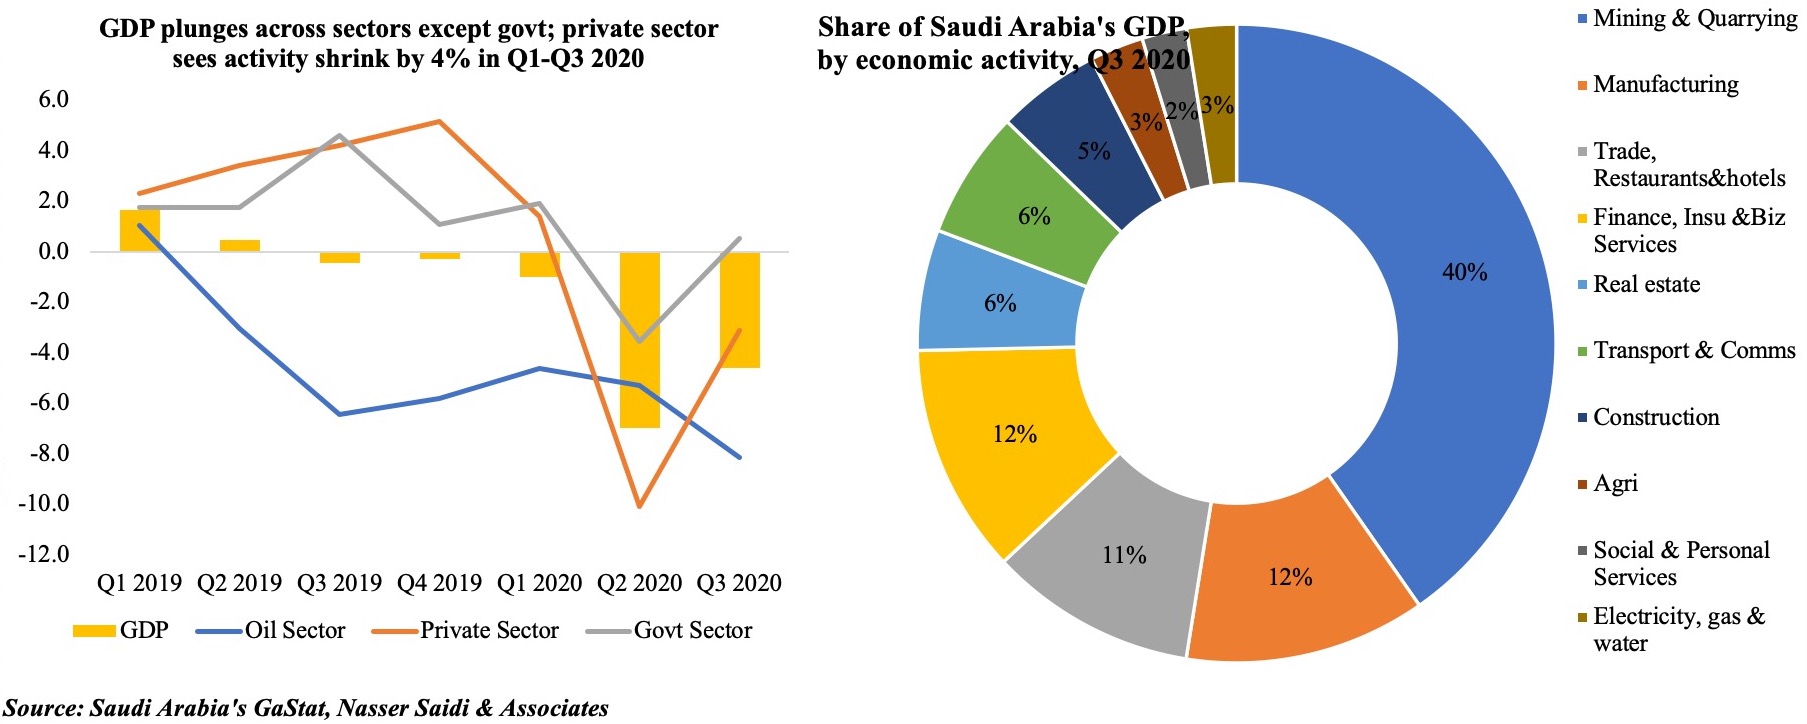
Chart 3: Saudi Arabia’s GDP shows recovery in Q3; private sector growth declines by 4% ytd
Saudi Arabia’s GDP declined by 4.3% in Q3, rebounding from Q2’s 7% plunge, with declines across oil and non-oil sectors (-8.2% and -2.1% respectively). Within the non-oil sector, most sectors posted declines in Q3 ranging from manufacturing (-10.1%) to trade, restaurants & hotels (-5.2%) while finance, insurance & real estate edged up (+1.1%). Share of GDP by economic activity shows that oil sector continues to dominate (40% of overall GDP), followed by manufacturing (12%) and trade & hospitality (11%).
Signs of recovery are evident: PMI for KSA is the strongest in the region, with output and export orders all increasing. The latest reading for employment also increased for the first time since Jan. Credit to the private sector, cement sales and PoS transactions have all been rising. Allocation of funds towards the public health system and social spending in the 2021 budget underscores the government’s commitment to support the economy as vaccines are rolled out next year. The reduction in Covid19 health concerns and uncertainty will encourage increased consumption and investment by the private sector, helping to boost growth. Similarly, roll out of vaccines will help restore the flow of non-religious tourism and the Hajj which are important contributors to the economy.


Powered by:


Weekly Insights 27 Jul 2020: Charts on the spread of Covid19 in the GCC + Global trade

Charts of the Week
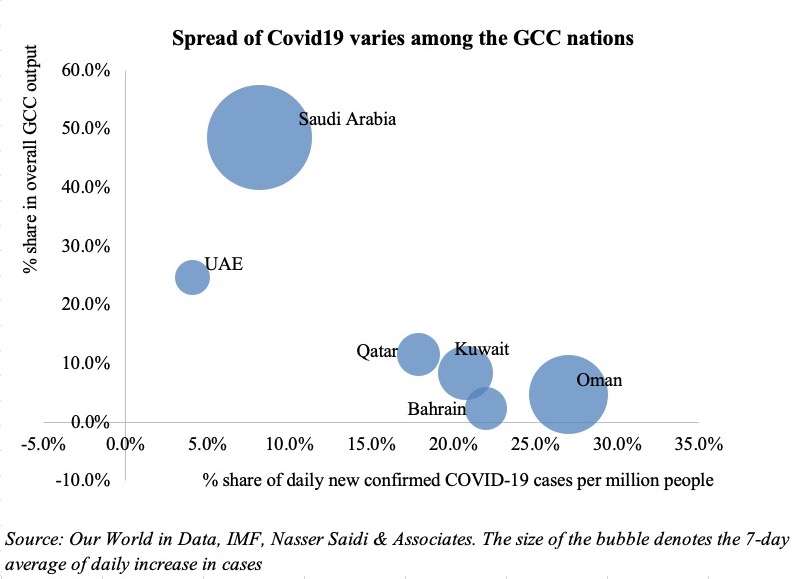
1. Spread of Covid19 in the GCC
Most GCC nations have begun a phased re-opening of their economies after being in partial/ complete lockdown for weeks. Some restrictions still remain (e.g. partial capacity at mosques, restaurants, movie theatres, gyms etc.) in countries that have reopened (like the UAE); where cases are high, partial nighttime curfews and targeted lockdowns are in place. The spread of the outbreak is varied among the GCC nations.
The chart maps the share in total daily increase in confirmed cases per million persons (x-axis) against the share of the country in overall output (y-axis), with the size of the bubble denoting the 7-day average of the daily increase in cases. Among the GCC nations, the UAE seems to be performing better – when it comes to both the 7-day average of daily increase in Covid19 cases as well as the daily confirmed cases per million people.

Saudi Arabia, which accounts for the lion’s share in GCC’s GDP, also has the highest 7-day average of daily increase in Covid19 cases (size of the bubble). This implies a sharper downturn in GDP this year due to the outbreak, but the effects of lower oil prices and the OPEC+ led cut in oil production will worsen the growth outlook. It is then little wonder that the rhetoric has shifted to diversifying revenue base with more privatisations and a hint of the introduction of an income tax in the future.
The GCC nations with the highest share in total daily increase in count (the highest being Oman) are among those with a lower share of overall GDP. For these nations, the worries are multiplied manyfold: not only will growth be affected by both the outbreak and lower oil prices, fiscal constraints and lower credit ratings will restrain their access to borrow from international capital markets. While governments have tightened purse strings, reducing capital and infrastructure spending will be detrimental to economic growth (especially the private sector).
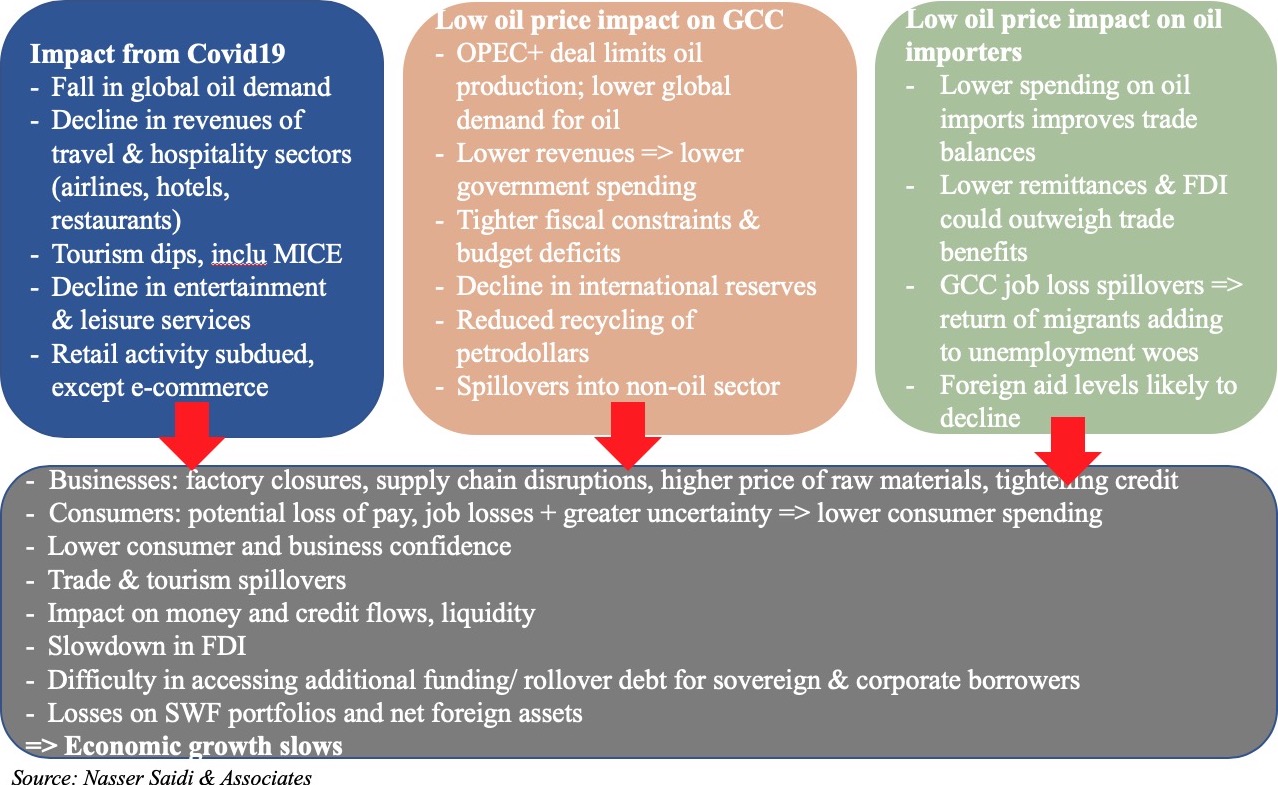
A decline in growth in oil-exporters also has a negative impact on many oil-importing nations: ranging from job losses (& the return of these residents to home countries that already face relatively higher unemployment rates), lower remittances as well as lower foreign aid and investments.
Chart 2. Economic Impact of Covid19 and low oil prices on the Middle East’s oil exporters & importers

 
2. Decline in global trade
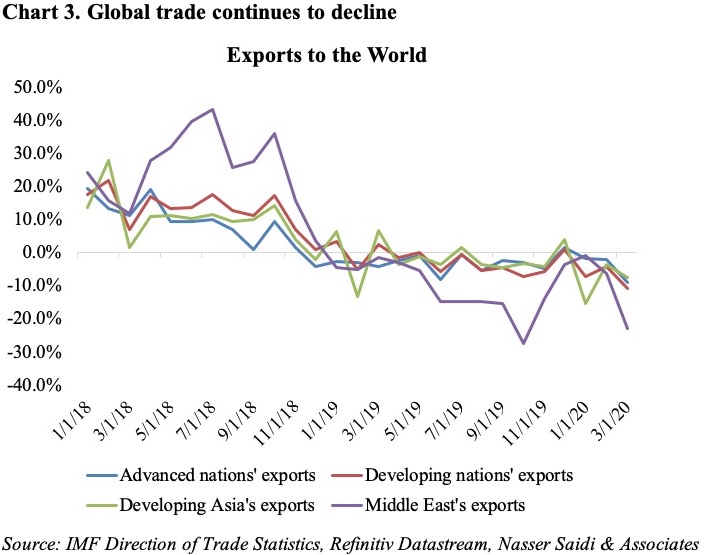
Along with tourism, global trade has been one of the most-hit by the global Covid19 outbreak. Trade growth had been slowing for the past year, and the pandemic has only accelerated its pace. Monthly data from the IMF’s Direction of Trade Statistics reveal that the drop in export growth touched two-digits in Mar, and given lockdown measures and factory shutdowns it can be estimated that data for Apr-May will be far worse.

The WTO estimates that trade will drop by 18.5% in Q2 this year, with a full year dip of between 13% (optimistic) to 32% (pessimistic scenario). For the Middle East, the 13.9% decline in total exports in Mar is a result of both lower oil production and lower demand for oil.
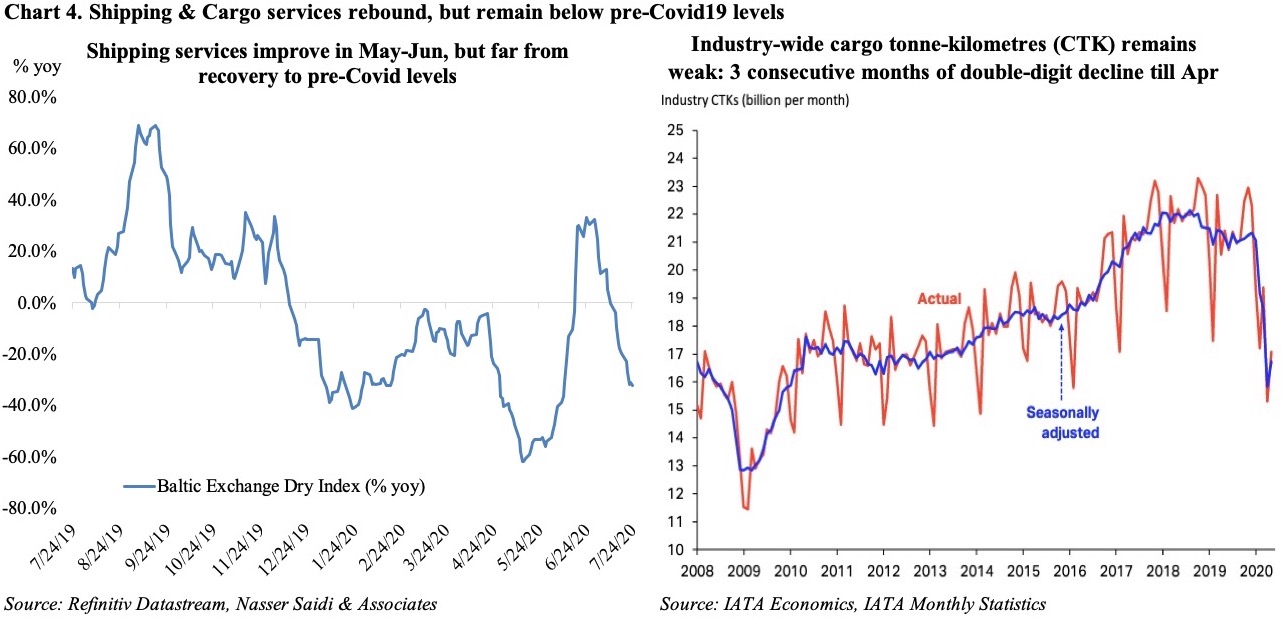
Shipping estimates, denoted by the Baltic Exchange’s sea freight index, touched a 9-month high in early Jul after recovering in Jun: this should translate into an improvement in global trade after May. Air cargo traffic data from IATA also denote that the cargo levels have shown a slight rebound in Apr (the latest available data). However, note that in both cases, there is a long way to recover to their pre-Covid19 levels. Supply chains remain disrupted though there has been a rebound in manufacturing activity across the globe (latest PMI numbers from Europe and Asia).

Powered by: