“Financial Inclusiveness Report”, report prepared for UN ESCWA, Jan 2026

Financial Inclusiveness Report“, prepared with contributions from Nasser Saidi & Aathira Prasad, is available on UN ESCWA (United Nations Economic and Social Commission for Western Asia)’s website


The Financial Inclusiveness Index 2025 provides an integrated, data-driven assessment of financial inclusion across 139 countries by measuring three linked pillars: access, usage and barriers, through both traditional and digital channels. Built on transparent selection and treatment rules, the Financial Inclusiveness Index enables consistent cross-country benchmarking and highlights where financial ecosystems are succeeding in expanding infrastructure but failing to translate this into meaningful participation.

Within the Arab region, progress in access and digital infrastructure is increasingly visible, while usage continues to lag. This is the case even in high-income countries, suggesting that constraints are related to adoption incentives, literacy, trust and regulatory/cybersecurity readiness. Comparison with 2023 shows infrastructure gains alongside a deterioration in ease of access, and a rise in traditional barriers driven by growing distrust in some contexts. The report translates these findings into actionable priorities, emphasizing payment digitization, simplified onboarding, targeted capability-building, and enabling frameworks for financial technology and mobile money to accelerate inclusive and resilient financial participation.

A central finding for this report is the underperformance of the Arab region in financial inclusion. Average account ownership is about 49 per cent, far below the global average of 79 per cent. The gender gap is among the widest in the world, at around 15 percentage points for account ownership and similarly large across several usage indicators. Despite high mobile phone penetration, adoption of digital payments and mobile money remains limited. The most frequently cited obstacle by unbanked adults is “insufficient funds” (71.9 per cent), alongside high costs, documentation requirements, limited trust and uneven digital readiness. While barriers declined in many regions between 2023 and 2025, the Arab region saw a moderate increase.

Within the Arab region, the analysis in this report focuses on 16 ESCWA member States, ranging from high-income Gulf Cooperation Council (GCC) economies to conflict-affected middle-income countries, but no low-income economies. GCC countries perform strongly, with Bahrain leading the Arab region and ranking 31st globally, followed by the United Arab Emirates and Kuwait. Middle-income countries show gradual progress but remain constrained by cost and capability gaps, while conflict-affected countries face systemic obstacles across all pillars.


“Global Economic Diversification Index 2026”, report released at the World Governments Summit, Feb 2026

The 5th edition of the Global Economic Diversification Index “Global Economic Diversification Index 2026” was co-produced with and released by the Mohammed Bin Rashid School of Government (MBRSG) at the World Governments Summit held in Dubai on 4th Feb 2026. Dr. Nasser Saidi & Aathira Prasad were co-authors of the report, which  was developed in cooperation with Keertana Subramani, Zeid Qiblawi & Fadi Salem (MBRSG) and Ben Shepherd (Developing Trade Consultants).

The presentation prepared for the WGS event highlights some of the main findings. Access the latest and past reports as well as the underlying data on the website

The report arrives at a transformational juncture in the global economy – a global landscape defined by geo-economic fragmentation, trade protectionism and the accelerating digitalization and decarbonization transitions. Both economic and trade policy uncertainty readings have been rising since the end of 2024, touching historic highs in Apr 2025 (following the announcement of US tariff hikes). Trade policy uncertainty at the end of 2025 (308.3 vs 1151.4 in Apr 2025) was 6-times that of the average in 2023 more than double the average in 2024.
The Economic Diversification Index provides an assessment of three foundational pillars of diversification – Output, Trade, and Government Revenue – across 117 nations spanning the 2000–2024 period. The upper quartile of the Global EDI presents a remarkably stable hierarchy over time: the US, China, and Germany anchor the rankings, followed closely by a group of high-income, advanced economies. Conversely, the bottom rankings remain dominated by low-income developing nations, predominantly characterized by high commodity dependence.
The 2024-25 period has not just been about what countries trade, but who they trade with. Not only is it necessary to alter the structure of exports i.e. move from raw materials to processed goods and services, but also to move from market concentration dependence to a diversified portfolio of trading partners to avoid tariffs or trade and investment sanctions. Absent this structural transformation, commodity exporters risk remaining trapped as price-takers – exposed to volatility at every turn of the commodity price cycle.
A central focus of the 2026 report is the performance of the 40+ commodity-dependent nations in the index. Data reveals a sharp divergence in trajectories with the GCC countries emerging as a distinct cluster of successful diversifiers within the commodity cohort (the UAE maintains its position as the distinct leader among the GCC countries for economic diversification), while for mineral exporters (e.g. Chile, Mongolia), the global energy transition presents a paradox. As the demand for critical minerals (lithium, copper, cobalt) has surged, it risks deepening commodity dependence rather than alleviating it. Without active policies to encourage domestic value addition (processing and refining), the green transition and accelerating investment in AI related chips and infrastructure could threaten economic diversification.
The GCC meanwhile is uniquely positioned to capitalize on a dual comparative advantage: remaining the central hub of “old energy” (hydrocarbons) while emerging as a global hub for “new energy” (renewables and hydrogen). Digitalisation and new tech sectors are a key component of GCC’s diversification effort, supported by low-cost sustainable power.
The report also captures the transformative role of the digital economy via an augmented metric EDI-plus. The findings reveal a widening diversification gap between advanced economies that have successfully leveraged technology to deepen their resilience to economic and trade shocks and many commodity-dependent nations that remain trapped in cycles of volatility. When digital indicators are included, the dispersion between high-performing and low-performing regions narrows. Though digitalisation provides the opportunity for commodity dependent countries to leapfrog, the persistent digital divide threatens to exclude the most vulnerable economies.
The 2026 EDI confirms that economic diversification is a marathon, requiring structural change and reforms, not a sprint. The winners are nations that have succeeded in pivoting to digital services and high-tech manufacturing, building diversified tax bases, investing in digital connectivity and leveraging their resources to fund the transition to a knowledge economy. The cost of inaction in a digital, decarbonizing world is the risk of remaining trapped in cycles of volatility and stagnation.


“Global Economic Diversification Index 2025”, report released at the World Governments Summit, Feb 2025

Global Economic Diversification Index 2025” was released by the Mohammed Bin Rashid School of Government (MBRSG) at the World Governments Summit held in Dubai on 12th Feb 2025. Dr. Nasser Saidi & Aathira Prasad were co-authors of the report, which  was developed in cooperation with Keertana Subramani, Salma Refass and Fadi Salem (MBRSG) and Ben Shepherd (Developing Trade Consultants). 

Access the latest and past reports as well as the underlying data on the website


Effective governance of economic diversification efforts is highly reliant on the availability of representative and robust data that informs evidence-based development and policy directions. The Global Economic Diversification Index (EDI) 2025 report provides valuable longitudinal datasets to inform policy, research and economic development efforts across the globe. It specifically highlights the importance of economic diversification for commodity-producing nations to mitigate the risks of growth, trade, and revenue volatility. The report underscores the vulnerability of countries dependent on   commodities to various shocks, such as price fluctuations, climate change, and global pandemics. Successful diversification can be accelerated through adopting new technologies and digitalisation, moving towards a services-based economy, focusing on value-added manufacturing, and investing in human capital and infrastructure.

The findings of this latest edition of the EDI emphasises the need for commodity-dependent nations, particularly those reliant on oil and gas, to adopt policies that prevent the natural resource curse and promote sustainable economic growth. Globally, there are numerous examples of successful transitions, including Norway’s diversification into high-tech sectors and Malaysia’s move towards greater industrialisation. However, the report highlights that there is no one-size-fits-all approach to diversification, as the urgency and pace of reform depend on multiple factors, including institutional effectiveness and governance, among others.

The Economic Diversification Index, first published in 2022, provides a comprehensive measure of economic diversification across countries. The EDI, derived by calculating the scores of three key sub-indices: government revenue, output, and trade, allows countries to assess the state and evolution of their economic diversification, as well as compare themselves with peers, and identify factors that can foster or impede diversification. The 2025 edition covers the performance of 115 countries, using publicly available quantitative indicators to ensure transparency and allowing reproducibility of the results. 

The top-ranked EDI nations in the current EDI edition continue to include the United States, China, and Germany. In 2023, twenty-five of the top 30 nations were high-income countries, alongside only four upper-middle-income nations (China, Mexico, Thailand, and Turkey) and a single lower-middle-income nation (India, at rank 20 globally). Only three of the eight regional groupings show an increase in EDI compared to pre-pandemic readings (Western Europe, East Asia Pacific and South Asia). It is, however, important to highlight that while EDI and GDP per capita are generally positively correlated, high-income countries, particularly oil dependent economies, do not always have high economic diversification scores.

In 2024, the Global EDI report introduced new digital trade augmented index (the ‘EDI+’). In the post-pandemic years, digitalisation continues to play an important role in increasing economic diversification while also enabling emerging and developing nations to catch up. The inclusion of digital indicators in the EDI shows that many developing nations are diversifying into the digital space and catching up with more advanced economies. this progress is dependent on factors such as infrastructure availability, regulatory support and the presence of a skilled workforce among others. The 2025 edition confirms that multiple countries in the top quintile of the EDI rise even higher with the inclusion of the digital indicators within the trade sub-index (i.e. trade+ sub-index). Over two-thirds of the nations’ show greater improvements in the trade+ sub-index (comparing 2023 versus 2010) than in the overall EDI+ scores. On the other hand, the lower income groups have yet to recover to pre-pandemic levels, in either EDI or EDI+ scores. This underscores the challenge of achieving recovery without substantial investment in digital infrastructure and relevant enablers.  The performance of EDI+ is in line with other digital indices, with the scores showing a positive correlation.

Insights from the latest EDI scores point to a few policy directions. Commodity producing nations need to consider three key factors while deciding on economic policy: (a) the implications of climate change will have an impact on commodities production and extraction; (b) how energy transition is affecting the demand for commodities, including fuel and metals; (c) the continued risks from geopolitical tensions and trade fragmentation, particularly for low-income and emerging market countries that depend on commodities, which may potentially leading to long-term output losses.

In this EDI edition, 40 countries in the index, nearly 35 percent of the countries covered, are commodity exporters, and within that subset, close to 50 percent of the commodity dependent nations are reliant on fuels. While the more diversified Mexico and Malaysia retain top rankings, given the dynamic nature of diversification, other countries are also undertaking transformational policies: notable cases in 2023 compared to 2000 include Saudi Arabia (up more than 30 ranks), UAE (+24 ranks), Kazakhstan (+17 ranks), Qatar (+12 ranks) and Oman (+10 ranks).Low to middle-income nations such as Angola, Congo and Nigeria remain consistently within the lowest quartile (with common characteristics such as poor governance scores and/ or being politically unstable) along with upper middle-income Azerbaijan. Among the Gulf Cooperation Council (GCC) countries, Bahrain and the UAE have both scored highly in the output sub-index in recent years, while the UAE outperformed in the trade sub-index. Kuwait lags its peers in all sub-indices, making it the lowest scoring among the GCC countries. 

Today, the world faces heightening environmental concerns exacerbating social inequalities and economic instability. The World Economic Forum’s Global Risks Report 2025 underscores the urgent need to address these environmental concerns, with “biodiversity loss and ecosystem collapse” ranked by respondents as the second-most concerning risk over the next decade. Climate change is forcing nations to hasten low-carbon energy transition plans and policies and consumers to make gradual behavioural shifts away from fossil fuels. Geopolitical forces also reconfiguring the global energy map. Even as the GCC countries emerge as “Middle Powers” in a globally fragmented world, its member states are stand out as energy powerhouses in both fossil fuels and renewable energy amidst global fragmentation.


“Global Economic Diversification Index 2024”, report released at the World Governments Summit, Feb 2024

Global Economic Diversification Index 2024” was released by the Mohammed Bin Rashid School of Government (MBRSG) at the World Governments Summit held in Dubai on 12th Feb 2023. Dr. Nasser Saidi & Aathira Prasad were co-authors of the report, which  was developed in cooperation with Keertana Subramani, Salma Refass and Fadi Salem (MBRSG) and Ben Shepherd (Developing Trade Consultants). 

Access the latest and past reports as well as the underlying data on the website


Economic diversification is a gradual, transformative process for countries that are dependent on commodities or a limited set of products or services.

Diversification for commodity producers leads to greater macroeconomic stability, more sustainable growth patterns, enables a gradual move to higher value-added economic activities (from over-dependence on primary commodities) and helps lower trade concentration (i.e., increase a country’s ability to export a wider set of products to a larger set of trade partners). This requires active and productive private sector participation, and in parallel, governments need to rollout effective policy reforms (often structural) and undertake productive investments – while diversifying the government revenue base by raising non-commodity-related revenues.

The Global Economic Diversification Index (EDI), based on publicly available indicators, data and information,provides a quantitative measure of the state and evolution of the economic diversification of countries going back to 2000. The current edition expands the coverage of countries to a total of 112 countries (7 additional countries compared to the previous EDI edition) owing to improved data availability.

The United States, China and Germany retain the top 3 ranks in the EDI for 2022, with the top 10 nations having small margins between scores (implying the strength of diversification). Western European nations account for almost two-thirds of the top 20 highly-ranked nations and while 26 of the top 30 nations are high income, there are representatives from upper-middle income (China, Mexico, and Thailand) and one lower middle-income nation (India).

At the other end of the spectrum, however, the diversification process has been long and slow. Four nations – three from Sub-Saharan Africa alongside Kuwait from the Middle East and North Africa region (MENA) – continue to remain in the bottom 20 ranks of the EDI over the period. The share of MENA nations in the bottom 20 ranks fell to just 10% from one-fourth in 2000. At the same time, there were 13 Sub-Saharan African nations among the lowest 20-ranked nations in the year 2022 from nine in 2000. Furthermore, the catch up for lower ranked nations in the post-Covid era will be a tougher ask, given the long-term scarring effects and output loss induced by the pandemic in addition to an already limited fiscal space and existing debt burdens.

As the global economy slowly recovers post-pandemic, it is contending with a lasting structural change: the accelerated adoption of digital technologies, which has resulted in societal gains such as higher labour force participation rates and productivity gains among others (especially in nations where the basic infrastructure was already in place). Despite challenges in data availability in this realm, this edition of the EDI includes indicators that aim to capture the growth of the digital economy: three digital-specific indicators are added to the trade sub-index.

Using this updated list of indicators and availability of data, a revised trade+ (“trade-plus”) sub-index is calculated for the years 2010-2022, for a subset of 106 countries. The revised trade+ sub-index is also used to calculate a digital augmented EDI+ (“EDI-plus”) score and ranking. Other than the Sub-Saharan Africa region, all regional groups improved their trade+ sub-index scores in 2020-2022. While the top four ranked countries are the same in both the trade and trade+ sub-indices, of the bottom 20-ranked nations in the original trade sub-index, thirteen are worse-off when including digital indicators. This finding is in line with what other studies have shown i.e. if adoption is delayed, existing digital divides can widen leading to deteriorating outcomes and prospects in the absence of an acceleration of reforms. South Asia shows a significant upwards jump in trade+ scores over time and this is reflected as well in the EDI+ scores as well.

A clear outcome across countries is that digital economy investments improve trade diversification, notably through the ability to export services. For commodity producers and exporters, the report finds that they can strongly improve their overall EDI and trade rankings by investment in and adoption of new digital technology and its services. Additionally, country geographical size does not appear to be an impediment to economic diversification and EDI scores (e.g. highly-ranked nations such as Singapore, Ireland and Netherlands among others are relatively small economies, both in the EDI and EDI+ versions).

Commodity producing nations are vulnerable to volatility in commodity prices. Prices can be more or less volatile depending on the type of commodity.  For instance, price of oil has been more volatile than the price of copper, wheat or cotton and other commodities, as shown by historical data. In the EDI sample of countries, more than 50% of the commodity dependent nations are reliant on fuels. The demand and supply shocks that occurred during the pandemic and those caused by ongoing wars, in addition to the planned energy transition to Net-Zero Emissions, increase the urgency for fossil fuel exporters to diversify – else these nations run the risk of being left with lower valued or stranded assets.

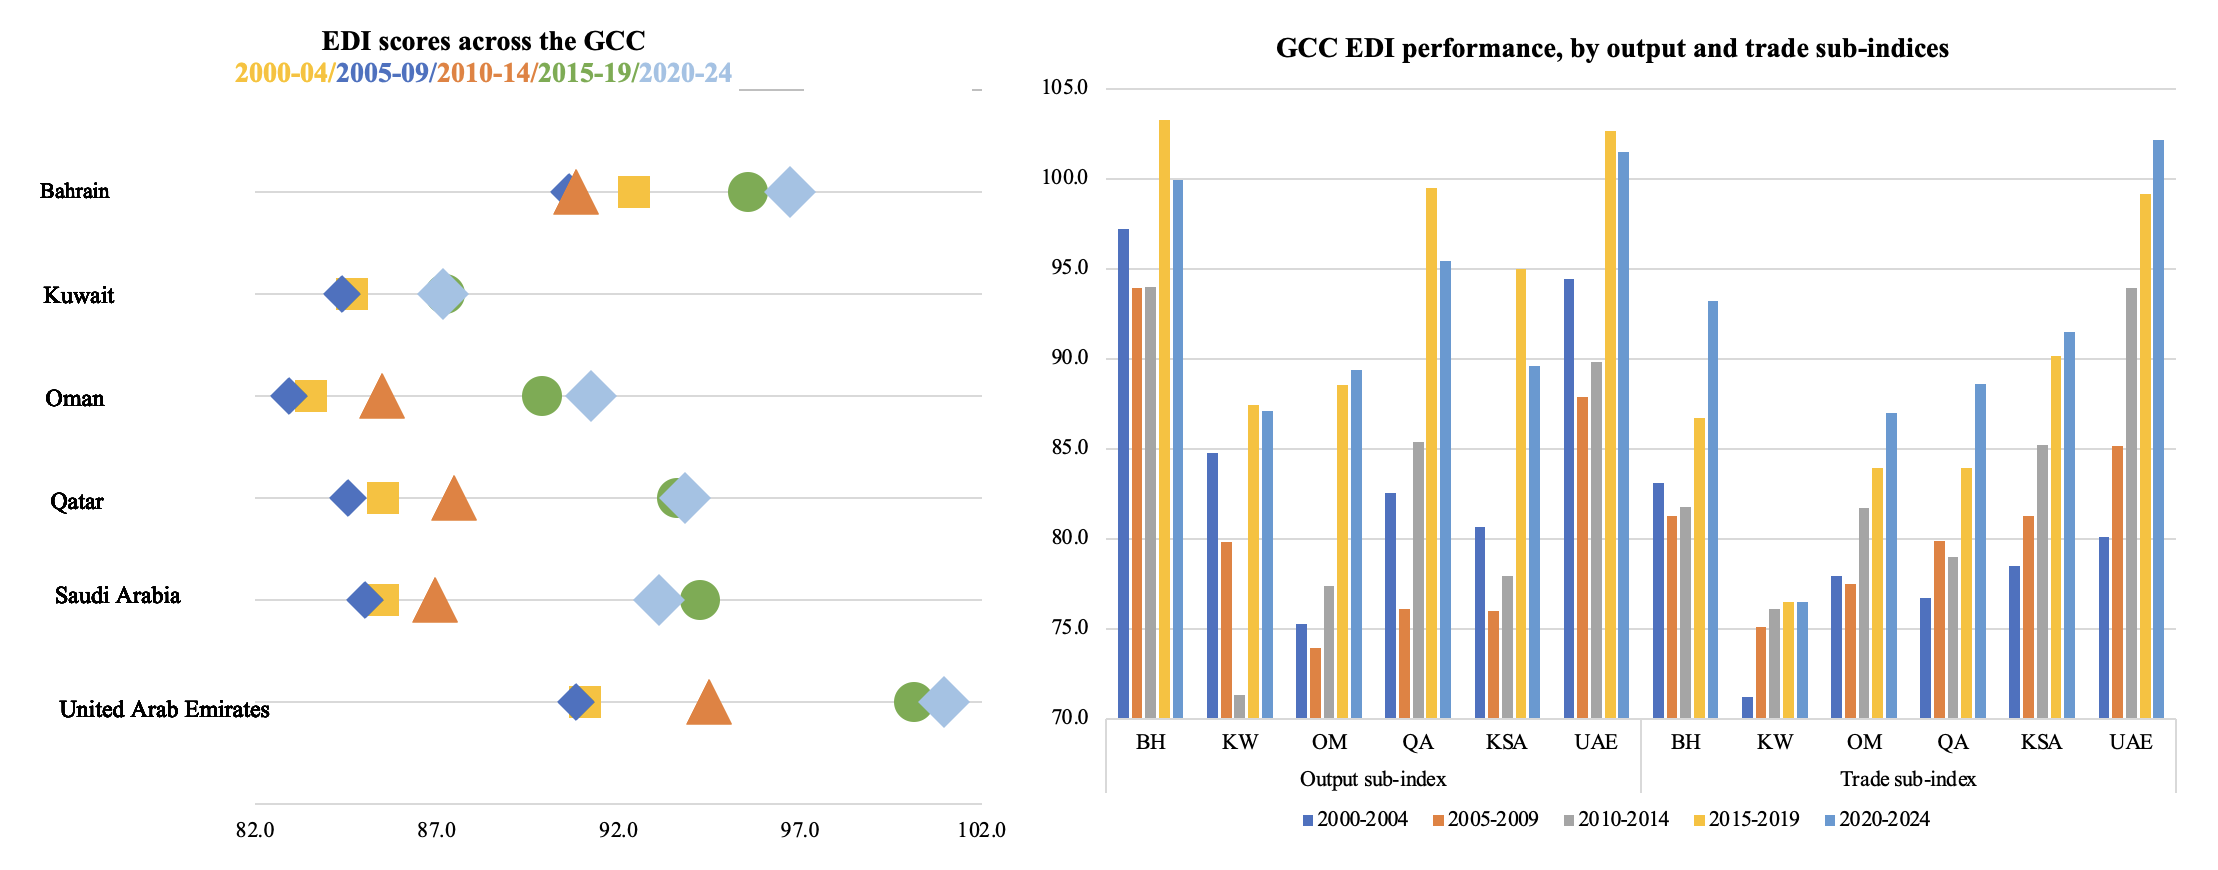
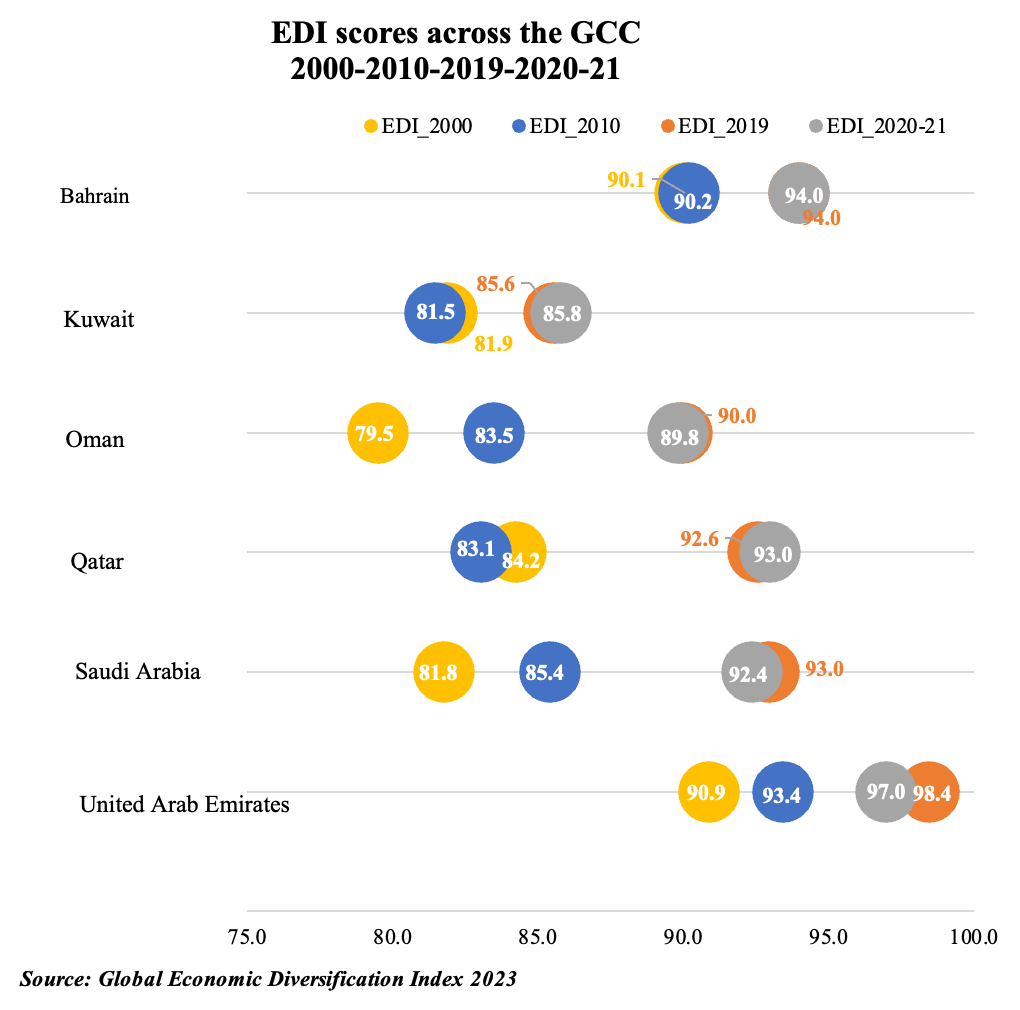
Sub-Saharan Africa’s commodity exporters posted the lowest EDI scores over time, with the 2020-2022 average score falling below the 2012-2015 period, underscoring not only the pandemic’s 
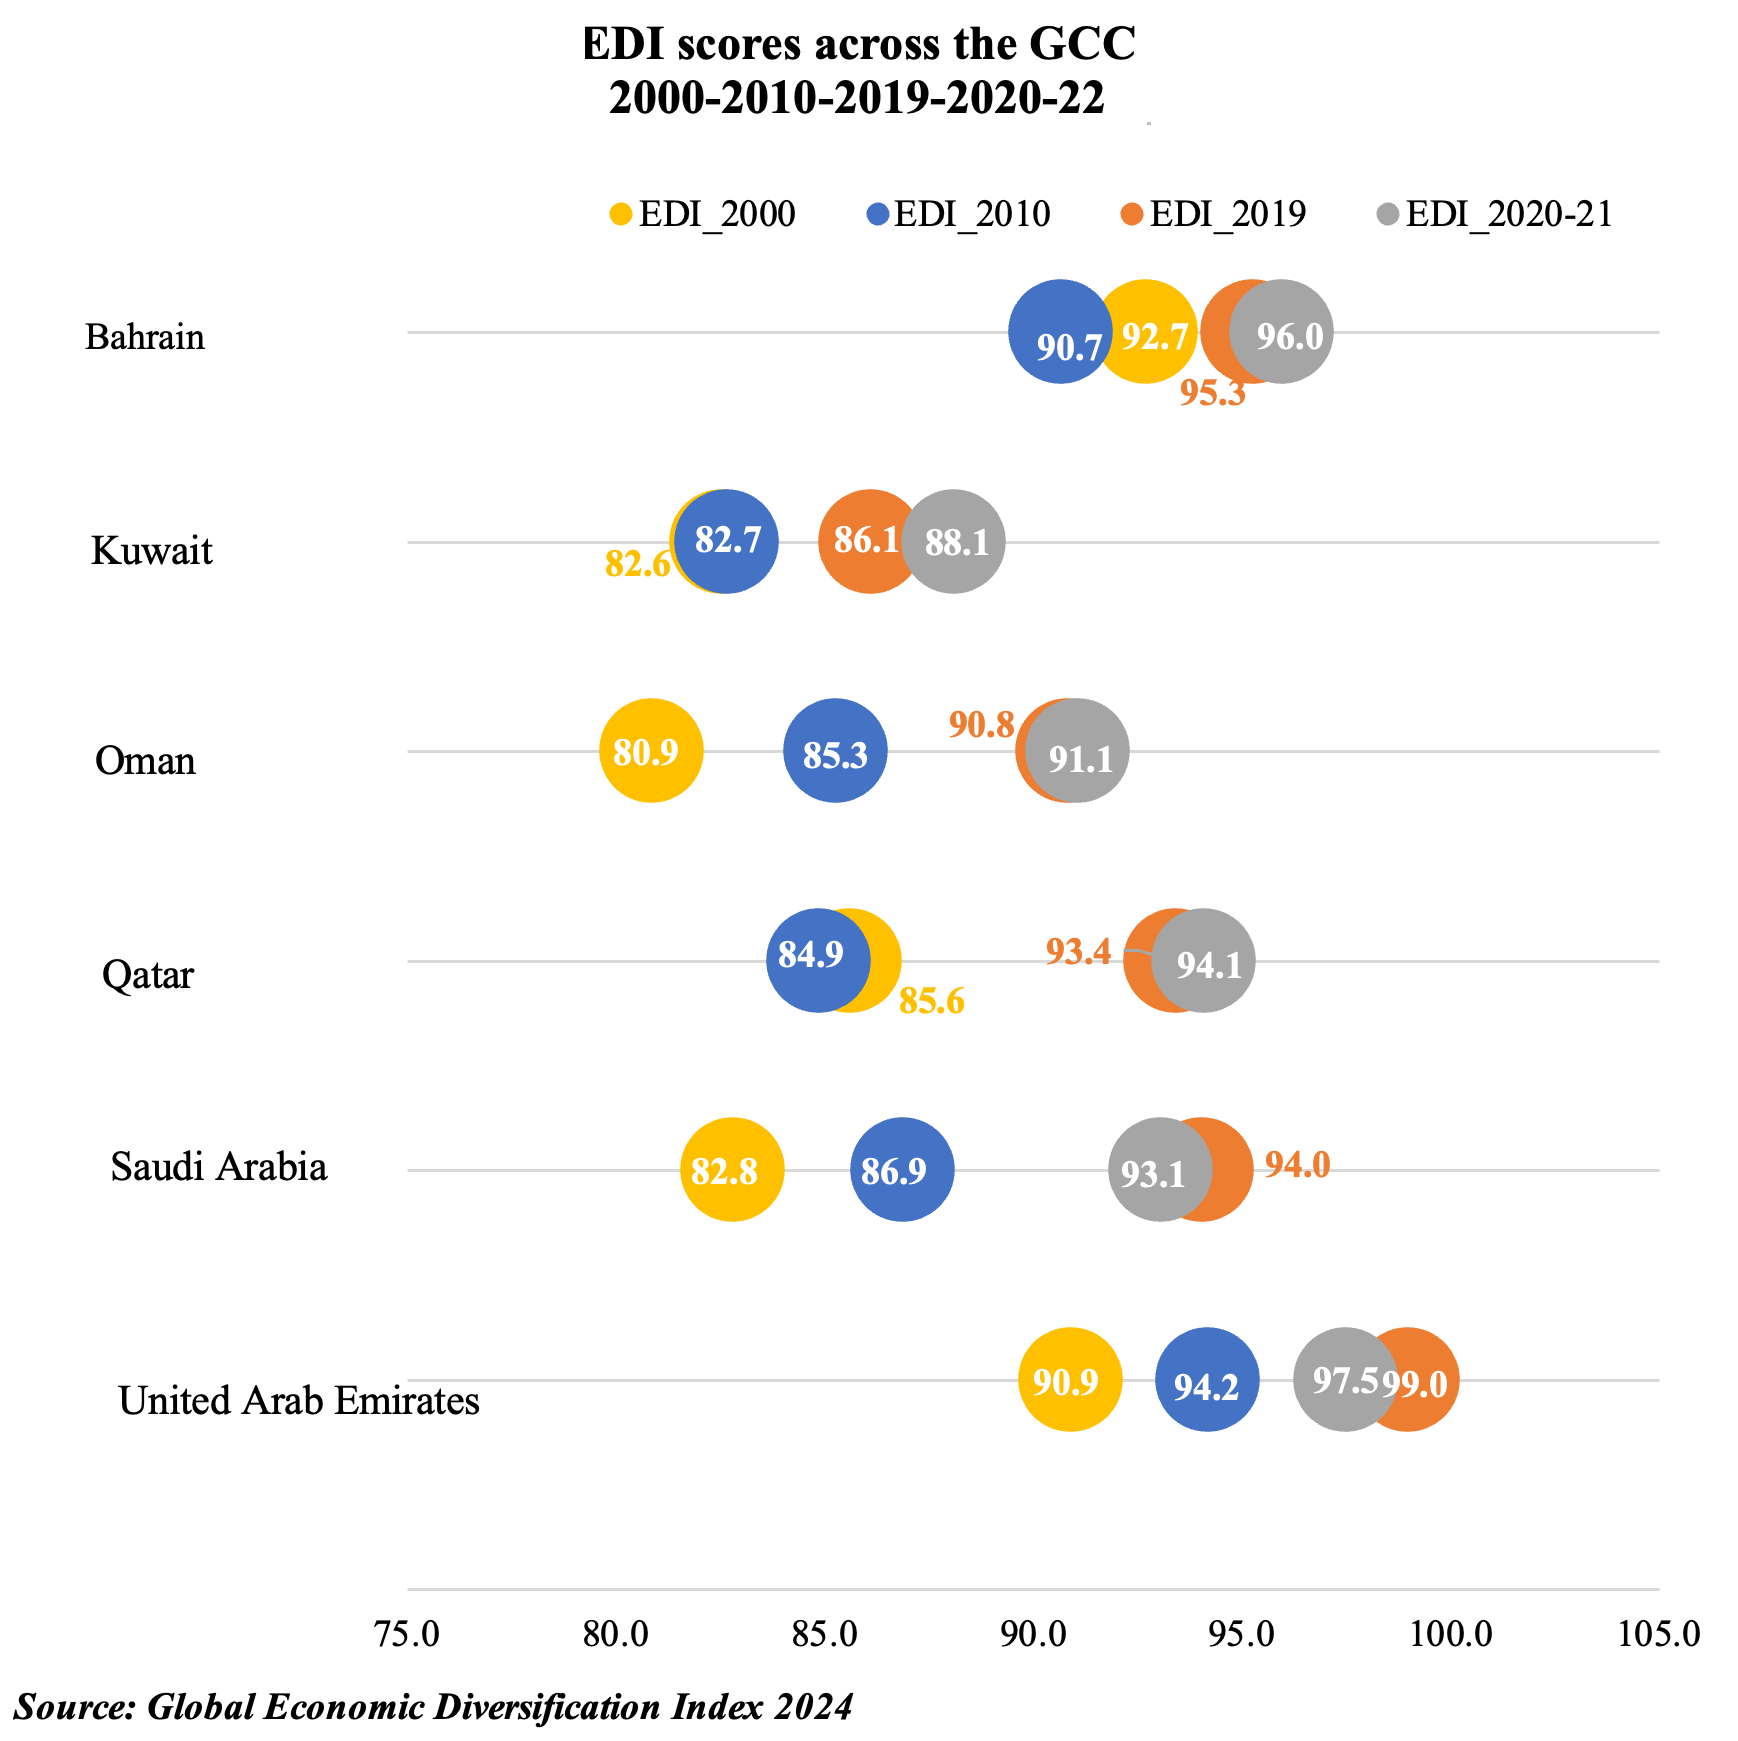
negative impact on performance but also the divergent paces of recovery. However, both the MENA and Eastern Europe & Central Asia regions reported a slight improvement in the 2020-2022 period versus pre-pandemic scores: these nations were all fuel exporters (i.e. not exporters of any other commodities). The report also finds that countries that reduced (increased) the share of resource rents have seen an increase (decline) in EDI scores, but the relation is one of correlation and not causation. Among the GCC, UAE and Bahrain have higher EDI scores compared to their peers, while Saudi Arabia and Oman have both gained over 10-points in 2020-2022 compared to their EDI score in 2000. Improvements in GCC scores have resulted from the implementation of reforms at a much more aggressive pace after the pandemic – including incentives to invest in new tech sectors, plans to broaden tax bases, trade liberalisation through free trade agreements and improvements to regulatory and business environment among others facilitating rights of establishment and labour mobility – that support diversification efforts and provide long-term economic resilience.

Lastly, the report highlights an increasingly relevant discussion related to climate change and the vulnerability of commodity-dependent nations. As countries adapt to and mitigate climate change risks, energy transition and “Green economy” investments, such as renewable energy, can play a key role in transforming economies and output structures. Fossil fuels are likely to remain in the global energy mix for decades, but a potential sustained decline in demand necessitates the roll-out of diversification policies at the earliest. With many oil-exporting nations in the Middle East already diversifying energy sources, potential export of clean energy from these nations could widen their export base (both in terms of products and trade partners). Furthermore, regional integration would aid diversification efforts of commodity producers and also provide a massive opportunity to link with domestic or regional value chains, adding to diversification efforts.


“Global Economic Diversification Index 2023”, report released at the World Government Summit, Feb 2023

Global Economic Diversification Index 2023” was released by the Mohammed Bin Rashid School of Government (MBRSG) at the World Government Summit held in Dubai on 14th Feb 2023. Dr. Nasser Saidi & Aathira Prasad were co-authors of the report, which  was developed in cooperation with Salma Refass and Fadi Salem (MBRSG) and Ben Shepherd (Developing Trade Consultants). 

Access the latest and past reports as well as the underlying data on the website. The report’s release was covered in newspapers like The National and Khaleej Times among others. 

Economic diversification has been a guiding policy theme for commodity producing nations to minimize volatility, support economic growth and development, create jobs. alongside greater private sector activity and more sustainable public finances. While research about economic diversification centers around its determinants and the impact of policies on economic development, there had been no agreed, available measure or index of economic diversification till the first edition of the Global Economic Diversification Index (EDI) was published in 2022. The EDI measures and ranks countries on the extent of their economic diversification from a multi-dimensional angle, exploring diversification of economic activity, international trade as well as of government revenues (away from a dependence on natural resource or commodity revenue).

The EDI is based solely on quantitative indicators, with no survey or perception indicators, providing a quantitative benchmark and ranking of the economic diversification of countries, using 25 publicly available indicators, data and information. This edition of the EDI extends the coverage to a total of 105 countries, for the period 2000 to the Covid19 affected 2020 and 2021, allowing an international, cross-country, regional comparison and ranking of commodity dependent countries.

The United States, China and Germany hold on to their top 3 positions in this edition of the EDI. Nations that rank 4th to 10th have only a 6-point difference between them, highlighting the strength of diversification among the highly ranked countries. Three oil producing nations continuously remain in the bottom 10 nations across the period, but the MENA region has recorded an improvement towards the latter part of last decade (supported by the acceleration of many oil producer’s diversification plans).

Overall regional rankings held steady even during the pandemic years (though the scores were much lower): North America topped the list while Sub-Saharan Africa remained a laggard. The analysis highlights that while commodity dependent nations have made gains in both output and trade diversification sub-indices over time, revenue diversification has been holding back overall advances for many. Tax revenue as a % of GDP in Norway, highly ranked in the revenue sub-index, stands at a high 30%+ and compares to single digit readings in countries like Bahrain, Iran or Kuwait, to name a few.

Within the GCC, UAE and Saudi Arabia have made the most significant economic diversification progress, thanks to a conscious effort to diversify into the non-oil sector. Following the onset of Covid-19, which put the brakes on non-oil sectors of focus (like tourism, infrastructure and logistics), there has been an accelerated shift in policies rolled out to enable economic transformation. This includes structural reforms (especially directed at the labour market and increased mobility), embracing the digital economy, efforts to broaden the tax base and a concerted push towards the privatisation of certain state-owned assets and enterprises to de-risk fossil fuel assets among others. This will support the next phase of economic diversification in the region.


“COVID-19 and its impact on Arab economic integration”, UN ESCWA report, Nov 2022

COVID-19 and its impact on Arab economic integration“, prepared by Nasser Saidi & Aathira Prasad, is available on UN ESCWA (United Nations Economic and Social Commission for Western Asia)’s website


The paper explores the impact of the COVID-19 pandemic on the Arab region’s global and regional economic integration. In terms of output, oil exporters faced a double whammy of lower domestic demand and supply shocks along with lower oil prices and exports, while tourism-dependent countries took a severe hit. The Middle East’s decline in international and regional trade was sharpest across all regions, and the decline in services trade was even harsher. With respect to labour, there was evidence of reverse migration alongside resilient remittances, but the recovery will be long for those in the informal sector, especially women and young people. Overall, the Gulf Cooperation Council (GCC) countries seem to be the main drivers of greater regional (and indirectly of greater global) economic integration, and Mashreq countries are becoming increasingly integrated with the GCC.

To enhance regional integration in a post-pandemic world, the Arab region needs to rethink its trade and investment policies (agreements with key partners in the GCC and Asia, reduce restrictions related to trade in services, strengthen links to the global value chain, and invest in digital trade), while allowing for greater mobility of labour and enhancing financial (and capital market) linkages. Moreover, policy coordination is paramount to address some of the common challenges facing the region, including mitigating the risks of climate change and food security.


“The Gulf Falcons Report”, prepared for the Abu Dhabi Finance Week, 14 Nov 2022

The Gulf Falcons Report” (click to download) was prepared by Nasser Saidi & Associates (commissioned by the Abu Dhabi Global Markets) for the Abu Dhabi Finance Week held from 14-18 Nov 2022. 


Introductory remarks

The Gulf Falcons embody a vision of the future for the Gulf, transforming, in three decades, from an empty desert to the new opportunities of space. The GCC have fast growing populations and economies, and maintained macroeconomic stability despite global and regional crises.

The largest Gulf Falcons, Saudi Arabia and the UAE account for 34% of MENA’s GDP and 42% of its total trade. Sound macroeconomic policies, good governance and institutions enabled the Gulf Falcons to use their 30% of global oil reserves to transform and diversify their economies, build world class infrastructure, achieve high GDP growth, and run fiscal, current and balance of payment surpluses. Major strides have been achieved in raising the standards of living and human development.

In its next phase of diversification, the region will benefit from global fragmentation while choosing to explore new routes to development, investing in digitalisation and new tech sectors. Implementing a regionalised globalisation policy, the rising Gulf Falcons will drive and support regional economic integration and transformation.

The Gulf Falcons with their SWFs and international financial centres are fast becoming a global financial powerhouse, with the ability to globally manage, control and deploy wealth. The Gulf Falcon Markets are key to financing the drivers of regional transformation, through (a) by financing the emerging new global energy map, the energy transition, renewables and combating climate change. The UAE and Saudi can become global clean energy finance hubs; (b) structural change through financing infrastructure, privatisation, PPP, efficient management of State assets, and de-risking fossil fuel assets; (c) financing regionalised globalisation to enable greater economic integration and transformation of the GCC-connected region including Middle East and East Africa; (d) financing digitalisation and investment in new and disruptive technologies will open new avenues of growth.


Trends in trade and investment policies in the MENA region: Policy Brief prepared for the OECD MENA-OECD Working Group on Investment and Trade, Nov 2018

The MENA-OECD Working Group on Investment and Trade‘s 2018 meeting was held in Dead Sea, Jordan on 27-28 Nov, 2018. (More: http://www.oecd.org/mena/competitiveness/investment-and-trade.htm)
A policy brief titled “Trends in trade and investment policies in the MENA region” was prepared by Nasser Saidi & Associates to aid discussions during this meeting.
The executive summary is shared below; the paper can be downloaded here.
 

Executive summary

The Middle East and North Africa (MENA) region accounted for only 5% of global exports and 4.3% of total imports in 2017. Merchandise exports from the MENA region to the rest of the world stood at 893bn USD in 2017 (up from just under 250bn USD at the start of this century). MENA countries are particularly vulnerable to terms-of-trade shocks because of the volatility of their export earnings, caused by the high concentration of exports in primary commodities and exacerbated by the high concentration of export markets. The region can achieve greater economies of scale if each country can better use its comparative advantage through production sharing networks and integration into global value chains.
There has been a significant shift in the region’s trade patterns toward Asia over the past few decades. Asia now accounts for about 55% of the region’s total trade compared to around 40% in 1999.  Regional trade remains dismal at under 10%. MENA oil importers’ share of trade within the region remains relatively high: Lebanon (44% of total exports in 2017) Jordan (43%), and Egypt (22%). Maghreb countries export the least within the region (under 10%), with much of their exports going to Europe.
FDI inflows into the region increased between 2000 and 2008, thanks to efforts to improve the business environment and investment climate and to related structural and institutional reforms. Slowdown appeared after the financial crisis in 2008 followed by regional turbulences, with limited recovery. In 2017, investment flows into the GCC were 15.5bn USD, almost 3.5 times lower than in 2008 at their peak. The bulk of FDI inflows into the region have gone into energy, real estate, financial services and consumer products.
Overall, the MENA region remains less regionally integrated in terms of trade and investment flows. The main barriers to growth in trade and investment (including intra-regional) are multi-fold:

  • Though average tariffs have reduced over time, they remain very high; non-tariff barriers (e.g. burdensome technical regulations, import authorisation procedures, cumbersome customs clearance and border controls) are obstacles to both regional and global integration;
  • MENA’s trade facilitation performance – in terms of procedures, harmonisation, transparency, border agency cooperation and so on – leaves much to be desired;
  • Though regional trade agreements are in place, their implementation and enforcement are lacking and benefits are not visible;
  • Lack of diversification is a serious drawback, given that oil and agricultural products remain by far the most important exports;
  • Regional economic integration has seen very little progress due to different factors including weak institutions, the lack of infrastructure and state-owned enterprises;
  • Cumbersome licensing processes, complex regulations and opaque bidding procedures create both business and investment barriers;
  • Competition legislation is particularly needed in countries where markets are highly concentrated and where barriers to imports are still high;
  • Trade has been negatively affected by the wars, sanctions and political barriers in the region; and
  • The scarcity of quality data and statistics on both domestic and foreign investment means a lack of evidence-based public policy and increases perceived investment risk.

While the region has undertaken significant reforms to support trade and investment – ranging from lowering tariffs to improving infrastructure to protecting minority investments to institutional investment reforms – it is evident that there is a long way to go for greater trade integration. In this context, it is recommended that the MENA region:

  • Invest heavily in trade-related infrastructure and logistics;
  • Deepen intra-regional trade through trade facilitation;
  • Invest in moving towards greater digital trade facilitation;
  • Use GCC countries as engines of economic integration;
  • Reflect the shift in trade partners in new trade and investment agreements;
  • Improve legal and institutional framework to support private sector growth and diversification
  • Make a digital transformation in order to support trade and investment: from transport (electric vehicles), to banking and financial services (Fintech), commerce (e-commerce), to health and agriculture (Agrytech), and the government sector  ;
  • Ensure the availability, harmonisation and dissemination of regular, timely, comparable and quality statistics, which are essential to conduct sound trade and investment policies.


White Paper on "Lebanon’s Oil and Gas Wealth", Sep 2016

An extract of the white paper titled “Lebanon’s Oil and Gas Wealth: Policy Recommendations for Escaping the “Devil’s Excrement” Curse” is posted below.
Click to download the English and Arabic versions, published by La Maison du Futur in cooperation with the Konrad Adenauer Stiftung.
Lebanon’s Oil & Gas Opportunity
Lebanon’s prospects as an oil and gas producer are fueling expectations, verging on irrational exuberance, that an energy windfall would jump start the economy out of its lethargy, increase exports, investment and consumption spending, create new jobs in
the energy sector and raise growth rates. How realistic are these expectations and what should be done to effectively manage Lebanon’s prospective energy wealth?
A 2010 US Geological Survey report estimated that there were 122 trillion cubic feet (TCF) (equivalent to 3,455 billion cubic meters) of gas and 1.7bn barrels of oil off the coasts of Israel, Palestine, Cyprus, Syria and Lebanon.Though small by international standards (they pale in comparison to Russia’s 1688 TCF and Iran’s 1193 TCF proven gas reserves), Lebanon’s oil and gas reserves present a potentially transformational opportunity for Lebanon.
Nevertheless, we should recall the old proverb that “there’s many a slip ‘twixt the cup and the lip”.


Excise Taxation for GCC Revenue Diversification: Policy Brief, May 2016


The Policy Brief titled “Excise Taxation for GCC Revenue Diversification”, authored by Dr. Nasser Saidi and Aathira Prasad, highlights the need for excise taxation to support the ongoing revenue diversification policy. Raising revenue from fuel and tobacco taxation are two example explored in the brief. One of the findings is that specific excises are preferable than ad valorem taxes, and another that governments should avoid steep successive increases in tax rates as this can lead to a loss of revenue, and increase in illicit trade. A more detailed explanation and recommendations on the implementation of excise taxes in the GCC are part of the policy brief.
Download the English and/or Arabic version(s).


CSS Capital Advisory: Uncommon Sense, March 2016

Click here to download the complete issue for March 2016. 

Most economies are expanding at an unusually low nominal pace despite the massive monetary stimulus from central banks. The most important indicator of the conjuncture in the US, the non-farm payroll, indicates that the world largest economy remains on a steady, albeit modest, growth trajectory. However, elsewhere the picture is slowly deteriorating. In Japan GDP growth has been negative in two of the last three quarters, in Europe growth is stalling and emerging markets suffer from depressed commodities prices and capital flights. In the best of circumstances, global growth in 2016 will be in line with the moderate pace recorded in 2015. The critical battleground against global recession will be China, the engine of global economic recovery in 2009, which is now paying for the consequences of its massive stimulus programs in 2008-09. The Chinese premier Li Keqiang announced a new plan hinging on the trite mix of credit and fiscal expansion. Official sources are now ventilating a budget deficit in excess of 4% of GDP, while the Chinese central bank (PBOC) has cut its policy rate for the sixth times since November 2014 (and reserve requirements several times). Few are holding their breath waiting for an immediate turn-around. Currently the Chinese industrial sector is in shambles. Exports plunged 25% yoy in dollar terms in February, the biggest one-month decline since early 2009, after an 11% drop in January. Imports fell 14% yoy after a 19% decline in January. The current account surplus dropped to 2.7% of GDP in 2015 from 10% in 2007. The second troubled spot is the Chinese real estate market which is the single most important sector in the global economy and the biggest risk factor (in 2011 and 2012 China produced more cement than the US did in the entire 20th century). The authorities are taking steps to absorb excess housing inventory relaxing restrictions to help rural migrants purchase housing in urban areas, cutting minimum down-payments, reducing mortgage interest rates and property transaction tax. As a result, the value of newly-started investment projects jumped 31.7% yoy in the three months to February, according to official data.

Stock Markets’ Outlook

There is a sense of renewed optimism in global stock markets after four weeks of rebounds which have erased most of the losses at the beginning of 2016. Yet the rebound was once again linked to exceptional monetary measures first by the PBOC and then by the ECB. Hence risk aversion has abated, but Factset estimates for Q1 2016 a decline in earnings for the S&P 500 of -8.3%. In addition, a higher percentage of S&P 500 companies have lowered the bar for earnings in Q1 2016 relative to recent averages. Of the 117 companies that have issued EPS guidance for the first quarter, 91 have issued negative EPS guidance and 26 have issued positive guidance. In essence based on aggregate corporate sector data the upside of equity as an asset class remains capped, but it could be time to consider a selective increase of exposure.

Fixed income securities

In the past few weeks the global monetary stance has taken additional steps in the ultra-dovish direction. Even the US Fed which in December appeared determined to start a process of rates normalization has now backed down. For the first time since the Asian and Russian crises of the late 1990s, the Fed is explicitly taking into account global growth prospects in its decision. Nine FOMC members estimated two more rate hikes would be enough to hit their forecasts this year. The result is that now fixed income markets are expecting near-zero interest rates for another decade. For example overnight interest rate swaps imply that 1) the ECB rates will not return above 0.5% for roughly 13 years and will not exceed much 1% for at least 60 years; 2) Japan’s main interest rate will not reach 0.5% for at least 30 years; it will take 6 years for US rates and a decade for UK rates to reach 1%. Clearly the actions and the message from central bank are completely discordant. A pension fund that buys a 10-year corporate bond yielding 0.5% or an fund manager that buys a government bond yielding negative rates clearly do not believe that inflation will reach the 2% target in a couple of years as the major central banks promise. And if the rates are expected to be near zero for the indefinite future it means that investors do not expect growth to pick up anytime soon, so the renewed optimism in stock markets conflicts with such expectations. To complete the picture JPMorgan, which compiles the EMBI Global Diversified index of sovereign dollar bonds from developing countries, said that based on ratings from two of the three main ratings agencies the index would already be considered junk, or sub-investment grade.

In conclusion the real economy and asset valuations are misaligned due to the extraordinary support of central banks. Such state of affairs is vulnerable to a deterioration in growth, financial shocks or bouts of risk aversion.


White Paper on "Taxation, Illicit Trade in Tobacco Products and Finance of Terrorism in the Middle East"

The Executive Summary of the White Paper titled “Taxation, Illicit Trade in Tobacco Products and Finance of Terrorism in the Middle East” is posted below. Click to download the English and Arabic versions.

The sharp decline in oil prices alongside an appreciating US dollar has resulted in a “double whammy” for oil-exporting nations, including the GCC. Given their high dependence on oil exports for government revenue, countries face massive losses. To address the volatility and vulnerability of oil revenue and address fiscal sustainability the GCC countries will need to prioritize fiscal reform and put in place policies to diversify the sources of government revenue, as well as revise expenditure plans. This could happen through a reduction in fossil subsidies alongside the introduction of taxes. Current discussions focus on the introduction of value added taxes and increasing trade tariffs and taxes on consumption of tobacco and alcohol among others.

This White Paper addresses two important issues relevant to imposing and increasing excise taxes on tobacco: (a) the need to avoid sudden, large tax hikes that would lead to an increase in illicit trade and (b) as a result provide financing to organised crime groups (OCGs) and terrorist organisations operating in or out of the Middle East region. The vastness of the illicit trade network is evident in the fact that trade in illicit (and untaxed) tobacco recently became the fourth-largest global tobacco business by volume, just behind British American Tobacco, Philip Morris International and Japan Tobacco International.

The GCC countries currently have relatively low illicit penetration rates, but are wedged between the tobacco industry’s established smuggling centres. Tariff and tax induced price differentials along with the lack of secure borders within the Middle East are a major driver of illicit trade. We find that an increase in ad-valorem taxes could lead to a massive spread (of more than USD 1 million per container) in cigarette prices between the lowest and highest markets across the region: a definite incentive for a surge in illicit trade.

This policy paper puts forward a GCC action plan to impede illicit trade growth. This multi-pronged approach includes both legal and regulatory measures, alongside tax and capacity building. These include: (i) Support the GCC countries to become members of the Protocol to Eliminate Illicit Trade in Tobacco Products (ITP) (ii) Assist the GCC in developing common standards to comply with the ITP through a track and trace solution (iii) GCC policy harmonisation and coordination to introduce domestic excise taxes (iv) Gradual implementation of excise tax introduction and tax increases (v) Invest in the build-up of taxation capacity and administration (vi) Use modern technologies for tax administration including digital fiscal markers (vii) Develop Public-Private-Partnerships to ensure compliance


White Paper on "GCC Fiscal Reform: Oil, Government Revenue, Excise Taxes & The Tobacco Market"

The Executive Summary of the White Paper titled “GCC Fiscal Reform: Oil, Government Revenue, Excise Taxes & The Tobacco Market” is posted below; click to download the English & Arabic versions.

Government spending in the Gulf Cooperation Council (GCC) countries has been rising rapidly since the onset of the Arab Spring. On the revenue side, oil & gas revenues account for more than 85% of GCC government revenue. This high dependence on oil & gas makes the GCC countries highly vulnerable to oil price fluctuations, with the recent decline in oil prices bringing fiscal sustainability concerns to the forefront. The IMF has recently warned that: (a) oil exporters’ fiscal surpluses are set to vanish by 2017; (b) if oil prices hit $75 per barrel for a prolonged period it would reduce GCC’s GDP by 1 percentage point; and (c) this could reduce the aggregate fiscal surplus from a current projected $275bn to around $100bn in 2015. Moreover, GCC countries do not have monetary independence given their peg to the US dollar and cannot adjust exchange rates when faced with external shocks.

To address their revenue vulnerability and fiscal sustainability the GCC countries should prioritize fiscal reform and put in place policies to diversify the sources of government revenue.  Revenue diversification policies should be directed not only at mobilizing non-oil revenue in the short run, but also at improving the buoyancy of tax revenue. Government revenue diversification reforms are recommended with the most efficient plan being to introduce both broad-based sources of taxation (a Value Added Tax) and indirect taxes (excise taxes) on specific goods and products like gasoline, diesel, alcohol and tobacco. This White Paper focuses on tobacco taxation, though the argument applies to the other products.

International & bilateral trade agreements constrain the GCC countries from raising the common external tariff on cigarettes and other tobacco products thereby restricting the ability of the GCC to raise prices to reduce tobacco consumption and smoking incidence, while increasing government revenue from tobacco taxation. However, international best practice suggests an alternative structure for tobacco taxation, which would allow GCC member states to raise the tax burden on cigarettes without violating their international obligations.

This White Paper recommends: (a) Agreement of the GCC countries to introduce excise taxes on tobacco consumption as a policy tool to increase tobacco prices for health reasons and to raise revenue; (b) The introduction of domestic excise taxes on tobacco in the form of a specific nominal excise duty to be introduced in each GCC member state consisting of a fixed amount per 1,000 cigarettes or equivalent units of other tobacco products; (c) GCC policy harmonisation: introduction of tobacco excise taxes should be applied uniformly (including on domestic production), equally and in synchronized manner in all countries in order to prevent arbitrage opportunities and illicit trade or smuggling. (d) The process of implementation of the new tax structure should be gradual to avoid encouraging smuggling & illicit trade. (e) The building of tax capacity in the form of tax revenue authorities to implement the fiscal reform, monitor and collect revenue.


DIFC Economic Activity Survey 2011

While advanced economies of the world are trying to return to a sustainable path in the aftermath of the global financial crisis, magnified by fiscal and debt uncertainties in the Eurozone area, the GCC countries, and the UAE in particular, have recovered. Their growth is buoyed by higher crude oil prices, stimulatory government spending, and growing links with emerging economies, predominantly from Asia. During 2011, despite the upheavals associated with the Arab Spring, oil producers renewed their record levels of export earnings and international reserves, allowing for expansionary fiscal policy that boosted economic activity and led to an acceleration of economic growth, at least in the short term.

During 2011 the DIFC has benefitted from the economic activity revival in the UAE and the region as a whole, as evidenced by the findings in DIFC Economic Note 20 titled “DIFC Economic Activity Survey 2011”, and strengthened its position as a growing financial hub of the region.

This report is based on the survey responses from 533 DIFC entities (8.6% higher than the number of entities that participated in the survey in the previous year – 479) that represent 65.2% of the DIFC’s 817 companies that were active during 2011. The response ratio for the current survey slightly improved from the 63.5% response rate in 2010.

The growth in number of establishments at the DIFC in 2011 was driven entirely by the non-bank Business sector, while the number of companies in the Financial sector remained stable. At the same time we note that a growing number of firms are joining the DIFC from the emerging market economies.

We estimate that total value added (the equivalent of GDP) of the DIFC reached USD 3.13bn in 2011 with an acceleration of the growth rate to 7% from 5.5% in the previous year.

The performance of economic sectors and activities of the DIFC entities at current prices in 2011 can be broken down as follows: Financial intermediation sector recorded a value added of USD 2.2bn, while its contribution to the total value added of the DIFC was 70.3%. The balance of29.7%, amounting to USD 0.9bn, was generated by Business sector entities (e.g. accounting and audit services, management consultants, law firms, restaurants, retailers, and other service providers) and the public sector.

While the contribution of companies to the value added of DIFC can be estimated as above, the indirect contribution of the DIFC to the economies of Dubai and the UAE cannot be so accurately accounted for. As residents in the Emirate, the DIFC workforce contribute to the economy as consumers who invest, rent housing, travel, shop, eat, have relatives visit from abroad (who also shop, eat, travel within the UAE), consult doctors, drive cars, buy real estate all causing an increase in demand for key goods and services in the Emirate – leading to what is called a multiplier effect. This value is more difficult to estimate, but given that the average DIFC workforce compensation falls in the higher end, it is a safe assumption to make that the stimulus to the economy from their spending is substantial.

The questionnaire for the current survey, which is based on the UN-OECD principles and methodology for compiling national income statistics, was expanded to include new sections to capture additional workforce characteristics, paid-up capital, assets and liabilities, and the geographical origin of DIFC entities’ ultimate controlling parents. The new data show that aggregate paid-up capital of DIFC entities owned by non-UAE residents is about 2 times higher than that owned by UAE residents (based on the actual data from responding companies), and that more than half of all ultimate controlling parents of the responding DIFC companies originate from only 4 countries, with the UAE leading the list, while the total number of countries in the list exceeds 50. Also, the new data shed some light on the hierarchical structure of the DIFC labour force, revealing that in the financial sector companies, in contrast to the entities involved in business activities, the proportion of executive officers and managers in the total workforce is notably higher.

A large proportion (55.6%) of the total DIFC’s labour force, estimated at 12,945 people as of end of 2011, was employed in the finance and banking sector. Business sector and public administration entities provided jobs to 41.7% and 2.7% of the total DIFC labour force, respectively. UAE nationals, accounting for only 2.2% of the total DIFC labour force, were mostly represented in the public administration sector (around 1/3 of all people employed by the DIFC and DFSA, on a consolidated basis), while their share in the labour force of private companies was minor at 1.4%.

DIFC human capital is of high quality, with 87.6% of all employees holding university level and post-graduate degrees. Educational attainment features are similar among male and female populations. About 85% of both men and women are university graduates and above, underscoring the availability of an equally highly skilled workforce at the Centre.

The data were collected through the interactive secure web-based online portal DIFCSTAT, which manages all official and administrative communications between the DIFC Authority and licensed companies (https://www.difcstat.ae/difcstatonline/default.aspx).

Click Economic Note 20 – EAS 2011 to download the full report.


MENA Chartbook, JULY 2012

The MENA Chartbook provides data (a wide range including GDP growth, fiscal indicators, money and banking indicators, the oil and gas sector, financial market, social development and business rankings) and updated information on economic and financial conditions in the MENA countries. The Chartbook also features an economic snapshot of the MENA countries, in addition to a regional macro-economic overview. Data for the Chartbook are extracted from free sources like the IMF and World Bank, in addition to data service providers like Thomson Reuters and Bloomberg. The concept is to keep you updated on developments in the MENA countries through a readily available information and analysis tool. The data is updated on a quarterly basis and will be available on the website.

MENA Chartbook July 2012


From Frontier to Emerging: Does Market Reclassification Matter?

http://nassersaidi.com/wp-content/uploads/2012/03/From-Frontier-to-Emerging-Does-Market-Reclassification-Matter.pdf

DIFC Economic Note 19, titled From Frontier to Emerging – Does Market Reclassification Matter?, discusses and compares the market classification criteria and methodology used by the various index providers, including MSCI, noting the similarities and differences. MSCI have indicated that the UAE and Qatar are being considered for re-classification from Frontier to Emerging market status, subject to a number of reforms. Evidence on the effects of reclassifications in both developed and developing economies is studied in this paper and we find that while MSCI have undertaken some 14 reclassifications over the years, six of them have been downgrades while there have been no reclassification from Frontier to Emerging, yet.

Using past examples of classification changes, this paper examines the short- and long-term impacts of the reclassification – including an empirical analysis of the effects on markets returns of the classification of Egypt and Morocco as emerging markets. Our results indicate that the initial announcement of a potential reclassification leads to an “overshooting” with investors speculatively bidding up securities prices and returns prior to the actual reclassification event, leading to almost no impact post-reclassification. Additionally, too much emphasis is placed on a potential market reclassification, with many forgetting that reclassifications are best viewed as signaling a confirmation of policy reforms and changes in market conditions, which trigger the reclassification. Thus, there is an identification effect whereby improved market conditions, which are a result of policy actions and reforms (leading to a reclassification), could empirically be attributable to the reclassification itself.


The Redback Cometh: Renminbi Internationalization and What to Do About it

http://nassersaidi.com/wp-content/uploads/2012/03/The-Redback-Cometh-Renminbi-Internationalisation-What-to-do-about-it-DIFC-Economic-note-18.pdf

DIFC Economic Note 18, The Redback Cometh Renminbi Internationalisation & What to do about it, analyses the growing international role of China which spans trade, investment, foreign reserve accumulation and Sovereign Wealth Funds. Despite the growing economic & financial international role of China, its currency, the Renminbi (RMB) remains largely a domestic currency. There are increasing calls for the RMB to become an international payment, investment and reserve currency. However, the move towards internationalization necessitates the development of an onshore capital market complemented by domestic policy reforms leading to a changed financial structure, with lower dependence on bank financing.

Internationalization of the RMB forms an integral part of the process of capital market development and financial sector reform. To date, there have been three main channels of RMB internationalization: the introduction of the RMB as the settlement currency for cross-border trade transactions, the provision of RMB swap lines between the People’s Bank of China (PBoC) and other central banks and the creation of a RMB offshore market. In this context we estimate that the RMB will emerge as the third global currency by 2015! In addition, the paper also discusses the GCC’s rising stature as a major trading partner for China, underscoring the fact that it is in the GCC’s strategic interest to move towards greater economic & financial integration with China through accelerating the GCC-China free trade agreement, establishing links between financial markets, finance bilateral trade using the RMB and establishing RMB swap lines with GCC Central Banks.

The Redback cometh and we need to prepare for this momentous coming.


Political unrest has wraked the Middle East and North Africa in early 2011- but has CG reform kept pace with social change SEPT 2011

Political unrest has wraked the Middle East and North Africa in early 2011- but has CG reform kept pace with social change SEPT 2011
[gview file=”http://nassersaidi.com/ns2016/wp-content/uploads/2011/09/Political-unrest-has-wraked-the-Middle-East-and-North-Africa-in-early-2011-but-has-CG-reform-kept-pace-with-social-change-SEPT-20111.pdf” height=”800px” save=”1″]


Infrastructure as an Engine of Growth in MENASA

http://nassersaidi.com/wp-content/uploads/2012/04/Economic-Note-15.pdf

DIFC Economic Note 15 titled “Infrastructure as an Engine of Growth in MENASA” provides a descriptive analysis of the infrastructure in the Middle East North Africa and South Asia region. Drawing from the key driving factors behind development of hard and soft infrastructure in the region, the paper also discusses the role of the public and private sector in its investment.

The MENASA region is experiencing a secular wave of transformation with two epicenters, India and the GCC. In the former, the main drivers are a “Goldilocks” demographics and the long lasting impact of reforms enacted in the 1990s by Dr. Singh (India’s current PM) are expected to solidify and extend this transformation process. In the GCC, the main driver is an energy commodity windfall that for the first time in history is not merely amassed in offshore assets, but is increasingly deployed domestically to transform the Arabian Peninsula into an advanced XXI century knowledge based economy.

Two factors will be keys to the future of the region: demographics and urbanization. With fertility rates still well above 2.2, the MENASA region will enjoy the goldilocks of an expanding labor force, while massive internal migration will feed a powerful process of urbanization. These secular waves require a massive commitment to build indispensable infrastructure to sustain the increased population and economic growth. In the two epicenters this need is well understood by policy makers, but a fundamental difference is noticeable. While in the GCC infrastructure projects are anticipating the demand and actually stimulating it (supply side effect), in the rest of MENASA the existing infrastructure are strained due to poor maintenance and intensive usage.

Investment in infrastructure sets in motion a virtuous circle: higher productivity and competitiveness translate into higher incomes and higher government revenues and in turn more public investment in a mutually reinforcing pattern, as has been the case of China over the past two decades and the GCC since the turn of the century. In the process, other positive spill-overs are felt in the form of learning-by-doing effects, efficiency gains in companies, human capital improvement, research and development in construction techniques, technology transfers and process innovation.

Governments’ role as the largest provider of infrastructure financing in the region needs to be redefined given the crisis and resultant fiscal constraints. The role of private sector needs to be enhanced through privatization and Public-Private Partnerships (PPPs). The availability of capital is a key to spur an investment cycle – given the long-gestation nature of infrastructure projects, there is a need to attract private sector funds and more importantly, a need to develop deep and liquid local currency debt markets to improve access to finance.


SWFs and the ascent of Emerging Market Economies Saidi & Scacciavillani July 2011

SWFs and the ascent of Emerging Market Economies Saidi & Scacciavillani July 2011
[gview file=”http://nassersaidi.com/wp-content/uploads/2012/08/SWFs-and-the-ascent-of-Emerging-Market-Economies-Saidi-Scacciavillani-July-2011.pdf” height=”800px” save=”1″]


The Dubai Mercantile Exchange: Trading, Prices and Market Efficiency

http://nassersaidi.com/wp-content/uploads/2012/04/Economic-Note-14-The-Dubai-Mercantile-Exchange-Trading-Prices-and-Market-Efficiency.pdf

The Dubai Mercantile Exchange Limited (DME) is the energy commodities exchange located in the DIFC that lists and trades the Oman Crude Oil Futures Contracts (DME Oman). The DME Oman is the sole benchmark for Oman and Dubai crude oil official selling prices, and the only market listing sour crude in the region. To date, over two million contracts or two billion barrels of crude oil have been traded over the DME since its launch in June 2007. Furthermore, the average daily volumes in DME touched 3,000 contracts during Q1 2011 with the highest record reached in January 2011 when the average daily volume was 3,570 contracts (equivalent to 3.5 million barrels of oil per day). Today, it is considered the largest physically-delivered crude oil futures contract in the world with a 35% (at an annual rate) rise in trading volume in 1Q2011.

Against this backdrop it is important to test the market efficiency of DME and also test whether the prices are reliable and not subject to manipulation. This Economic Note 14, titled “The Dubai Mercantile Exchange: Trading, Prices and Market Efficiency” analyzes the efficiency of DME oil market by using the “weak form of market efficiency”, which posits that future prices are optimal predictors of spot prices. Furthermore, the analysis is done using the Hansen and Hodrick correction which allows treating the overlapping observation problem. Our empirical results are consistent with the hypothesis that the DME market is efficient with reliable prices that reflect available market information. The DME has added value to oil markets by providing a transparent market price mechanism at a time of higher than average volatility in oil prices and market conditions.


A MORTAGE GUARANTEE CORPORATION FOR THE UAE-APR 2011

Without adequate financing, real estate will continue to be a drag on economic recovery, leading to lower growth than in other emerging market economies.
[gview file=”http://nassersaidi.com/wp-content/uploads/2012/08/A-MORTAGE-GUARANTEE-CORPORATION-FOR-THE-UAE-APR-2011.pdf” height=”800px” save=”1″]


The Role of Gold in the New Financial Architecture

http://nassersaidi.com/wp-content/uploads/2012/04/Economic-Note-13.pdf

Beyond its value as industrial input, including in jewelry, gold as a financial asset provides no cash flow or monetary dividend, nor a positive carry, and thus its value depends on non-directly measurable factors. However, its ancestral property as a store of value and a ‘safe haven’ especially in the face of heightened uncertainty and grave disruptions to the financial system would call for a role in the new financial architecture emerging after the global crisis. Absent a return to a fully fledged gold standard or to a gold exchange standard as prevailed pre-1971, gold could provide at least a partial anchor for monetary aggregates in a world that is increasingly multipolar, that is, where one economy would not be able to sustain the dominant international role of its currency without jeopardizing its internal stability as a result of an unsustainable external debt service (Triffin dilemma).
The ongoing real decoupling trend of emerging markets from mature economies will lead to a secular re-centering of the world’s economic and financial geography. This implies that the size of the US economy will shrink relative to other economies and therefore the world will gradually revert to a situation similar to that prevailing before WWI when the first wave of globalization took place.
During the XIX century and up to WWI, the gold standard provided the foundation for the expansion of international trade and the international financial relations. At that time none of the four or five large economies (including their colonial empires) was dominant. In that environment characterised by intense rivalries among major powers, the anchor for the world monetary and payments relationships was gold, i.e. an asset whose supply was independent from the discretionary decisions of national or supranational authorities.
After World War I, and especially after WWII, an economic landscape took shape that was unusual from an historical standpoint (at least since the fall of the Roman Empire). With Europe undergoing reconstruction from the devastation and ravages of war while imposing restrictions on trade and payments, the US became the dominant economy in global trade and investment relations (especially considering that the Soviet Union and, after WWII, China decided to pursue a closed door policy in international economic relations, while India pursued a protectionist model of economic development). The US dollar became the international currency for payments and reserves, thanks to its peg to gold until 1971, the size, depth and liquidity of its financial markets, the dominance of the US as a capital exporter and thereafter thanks to its overwhelming size and military reach.
The Triffin Dilemma, which figured prominently in the international monetary policy discussions right after WW II, posits that the country issuing the reserve currency is bound to run an ever increasing current account deficit as world trade and payments increase in order to allow reserve accumulation and until its foreign liabilities become unsustainable. Against that the US obtained an ‘exorbitant privilege, enabling it to pay for its imports with its own currency.
This dilemma could be side stepped as long as the US economy grew at least as fast as the world global average and had no serious rival on the world stage. However, the global financial crisis which originated in the US severely shook confidence in US banks, financial institutions and markets, which along with the emergence of China and India (with a 10-15 year lag), has reignited these dormant worries. Moreover fiscal laxity in the US, aggravated by the uncertainty over the cost of the health care reform combined with the large unfunded liabilities related to social security and other entitlement programmes, raises the spectre of a scenario in which the international role of the dollar could suddenly come into question.
The US cannot continue to run indefinitely a current account deficit without jeopardizing the stability of the world economy. In a multipolar world the size of a single country would not be large enough to sustain its role as supplier of the dominant reserve currency and international liquidity.
The alternative would be to devise a financial system relying on several major currencies as was the case before WWI. But should such a multi-currency system be left to market forces to set exchange rates or could it benefit from being anchored to an asset such as gold which not issued by a national authority?
Should we base an alternative global monetary system on national fiat currencies or should we move towards a gold exchange standard? The answer – provided in this DIFC Economic Note 13 titled “The Role of Gold in the New Financial Architecture” – is that international liquidity should be supplied on a large scale by an international currency such as the SDR, whose value should be tied to a basket of major currencies and gold, with the weight of the latter set at 20-25%.


The Case for Gold as a Reserve Asset in the GCC

http://nassersaidi.com/wp-content/uploads/2012/06/Economic-Note-11.pdf

The international role of the dollar as a vehicle currency and international reserve asset has come under strain during the financial crisis of 2007-2009. The Triffin dilemma is strongly resurgent: the large balance of payments deficits that the US has been running over the past decade and therefore the piling up external liabilities that have gone to finance the swelling size of international trade and financial markets, has undermined confidence in the US dollar as a reserve asset. Second, the US has been running large fiscal deficits since 2001, leading to a large buildup of public debt, with more than 60% being foreign held. The debt service is becoming a burden which puts the country at risk of negative repercussions when global interest rates will be on the rise again.

Over the years and decades to come, the dominant role of the dollar is likely to give way to a multi-currency arrangement as has been typical of historical phases where three or more economies in the world had roughly the same size and none was clearly dominant as in the late XIX century.

The size and composition of international reserves depends on the choice of exchange rate regime, mandate of the central bank and its policy objectives. Obviously if the national currency is pegged to a foreign currency like the US dollar, as is the case in most of GCC (excluding Kuwait) the reserves will be predominantly kept in US dollar denominated liquid assets. Since oil is priced in US dollars and oil contributes significantly to GCC countries’ government revenues and gross domestic product, governments have preferred to fix the domestic currency against the US dollar. While this has provided an anchor, the obverse is that Gulf currencies have been volatile against the euro, the Yen and other currencies, while trade and investment patterns have been shifting eastward, with Asian countries being the main trade (and increasingly investment) partner of the GCC.

The GCC countries are also considering moving towards a Gulf Monetary Union and potentially a Gulf Common Currency. In this DIFC Economic Note 11 titled “The Case for Gold as a Reserve Asset in the GCC“, we examine the backing for such a common currency in terms of a basket of currencies and whether the composition of reserves could help in conferring the new currency credibility and whether it is possible to demonstrate quantitatively that including gold would help to achieve better macro-economic stability. We conduct a series of simulations based on past data to calculate the return on a portfolio of reserves assets with and without gold.

Our results indicate that if a relatively conservative central bank holds gold as an asset class, its potential returns for any given level of risk (i.e. at any threshold of standard deviation) increase by several basis points more per year than when excluding gold from its optimal portfolio. Similarly, a dollar invested (in January 1987) by a fictional conservative central bank in an international reserves portfolio with gold would have grown to $6.6 by May 2010 – which is about 1.5 times more than an international reserves portfolio without gold.


The Case for Gold as a Reserve Asset in the GCC OCT 2010

The Case for Gold as a Reserve Asset in the GCC OCT 2010
http://nassersaidi.com/wp-content/uploads/2012/08/The-Case-for-Gold-as-a-Reserve-Asset-in-the-GCC-OCT-2010.pdf


Dubai World Central and the Evolution of Dubai Logistic Cluster

The logistics sector has been one of the main forces globalization and the DIFC Economic Note 10 “Dubai World Central and the Evolution of Dubai Logistic Cluster” explores the opportunities and benefits for Dubai from its state-of-the-art infrastructure and logistics sector. At the heart of the logistics revolution lays the integration of transport modes and the standardization of procedures which boosted synergies and economies of scale, to an unprecedent extent.

Dubai has been riding high on the wave of this advancements fulfilling a vocation that had suited the Emirate since the late XIX century when its ruler at the time, Sheikh Rashid bin Maktoum, declared its port a free zone. Dubai has thrived in its role as a regional hub reaching a position of prominence in the global logistics network and today it is one of the critical nodes in the global supply chain. This evolution underlines also the growing importance of our region in the world and its gradual transformation from an energy commodity exporter into a diversified economy with a broader economic base and a flourishing, internationally connected, service sector.

The opening of the Al Maktoum International Airport in June 2010 has strengthened and expanded this role. With global trade acquiring an even more strategic importance in the world economy, Dubai will reinforce its position at a time when Asia is supplanting the West as the main engine of growth.

Research highlights that the relationships between transport costs, production locations, and trade patterns follow different stages. At the beginning of the process, when transport facilities slowly improve and costs drop, competitive advantages are the key driver of trade. Later, as the efficiency in transport grows, intra-industry trade starts to dominate, specialization increases and manufacturers exploit massive economies of scale.

To achieve wider supply chain optimization it becomes imperative for companies at different levels of the production chain to coordinate their operations. At the macroeconomic level we observe, as a result, that trade elasticities to global GDP have increased over the last decade all over the world. Likewise, we observe that intra-industry trade among high income economies, but also between low- and high-income countries dominates global trade relationships. As much as 44% of all shipments pertain not to finished goods, but to inputs.

Dubai’s logistics sector is poised to catch the tail wind of this new phase in global trade where the services and the organization of logistics will be the dominant success factors and firms will therefore increase scale and specialization while building sophisticated buyer-supplier networks. To exploit fully the benefits of seamless integration between the major transport infrastructures in Dubai however a few hurdles must be cleared, such as the upgrade of regulation of intermodal links within the Emirate.


Forecasting Tourism in Dubai

During the past decade, Dubai has become a global tourism hub. The DIFC Economic Note 8 “Forecasting Tourism in Dubai” forecasts guest nights demand in Dubai hotels and hotel apartments as a proxy to measure the performance of  the tourist sector in the Emirate. Although tourism represents only 2.5% of recorded GDP, it has a profound impact on retail sales and transportation, which together represent some 44% of recorded GDP.

The empirical analysis uses traditional empirical methods, but in addition to the data compiled by Dubai authorities, it tests the explanatory power of seasonal factors and dummy variables capturing erratic effects such as the Holy Month of Ramadan, the school calendar and major sporting events. As a final element in the forecasting exercise, the analysis includes the number of searches conducted on Google using keywords related to travel to Dubai.


The Global Financial Crisis & the Role of Official Investors in the Gulf- Sovereign Risk Management JAN 2010

The Global Financial Crisis & the Role of Official Investors in the Gulf- Sovereign Risk Management JAN 2010
http://nassersaidi.com/wp-content/uploads/2012/08/The-Global-Financial-Crisis-the-Role-of-Official-Investors-in-the-Gulf-Sovereign-Risk-Management-JAN-2010.pdf


Local Bond Markets as a Cornerstone of Development Strategy

Debt markets represent the leading channel of liquidity for governments, public companies, agencies and financial institutions in many advanced and emerging economies. This DIFC Economic Note 7, “Local Bond Markets as a Cornerstone of Development Strategy” examines the need for developing a local currency fixed income market as it brings multiple benefits: stable access to capital, diversification of monetary policy instruments, creation of a yield curve for pricing financial assets and tailoring risk management tools.

In most countries, the debt market is born out of the need to finance government expenditures. With time, the yield curve on public debt becomes a reference for private entities such as banks, public utilities and corporations, which are then able to tap the market to fund their investments.

The development of local bond markets requires a strong commitment from governments to implement a proactive debt management programme as well as ensure a large and diversified issuers base. Therefore, a focused issuance programme of government securities is essential to establish benchmark bonds. Governments should also encourage publicly owned companies (especially utilities) to issue similarly structured securities to provide a slate of issuers that enjoy local name recognition, thereby paving the way for private corporations to issue debt. The GCC countries are investing heavily in infrastructure, which according to estimates requires USD2.2 trillion in financing. It is both opportune and desirable to raise this financing through securities backed by future cash flows from the infrastructure services, as is typical of project financing schemes.

Although banks are the obvious buyers of bonds, since government debt is highly attractive for meeting statutory reserve or prudential requirements, authorities should encourage the development of a secondary market among life insurances, asset managers and international institutional investors. To ensure the success of the endeavour, the legal environment needs to be tailored to promote transparency, the seamless and timely flow of information, prevention of insider trading and minimal counterparty risk. As markets develop, issuances further down the credit spectrum will increase and more transparent accounting standards in accordance with International Financial Reporting Standards (IFRS) must be adopted. Another pre-requisite for the development of a healthy bond market is a flexible, interlinked, electronic registry clearing and settlement system.

Building and sustaining a vibrant capital market relies on the commitment of long-term stakeholders. In addition to the government and the central bank, market makers, in their capacity as liquidity providers, are essential to ensure an active secondary market, particularly during a hiatus in primary market issuance. Finally, creating a robust framework for creditor rights and investor protection is necessary to instill investor confidence and maintain the momentum of capital market growth.


The successes of DIFC as an international financial centre SEPT 2009

The successes of DIFC as an international financial centre SEPT 2009
http://nassersaidi.com/wp-content/uploads/2012/08/The-successes-of-DIFC-as-an-international-financial-centre-SEPT-2009.pdf


UAE Company Law Reform and the Cost of Doing Business SEPT 2009

UAE Company Law Reform and the Cost of Doing Business SEP 2009
http://nassersaidi.com/wp-content/uploads/2012/08/UAE-Company-Law-Reform-and-the-Cost-of-Doing-Business-SEP-2009.pdf


Corporate Governance in Islamic Finance-Islamic Wealth-ch33 FEB 2009

Corporate Governance in Islamic Finance-Islamic Wealth-ch33 FEB 2009
http://nassersaidi.com/wp-content/uploads/2012/08/Corporate-Governance-in-Islamic-Finance-Islamic-Wealth-ch33-FEB-2009.pdf


The imperative of overshooting in CG in the GCC and MENA SEPT 2008

The imperative of overshooting in CG in the GCC and MENA SEPT 2008
http://nassersaidi.com/wp-content/uploads/2012/08/The-imperative-of-overshooting-in-CG-in-the-GCC-and-MENA-SEPT-2008.pdf


Financial Regulation and Lessons learned for the EME from subprime and other crisis SEPT 2008

Financial Regulation and Lessons learned for the EME from subprime and other crisis SEPT 2008
[gview file=”http://nassersaidi.com/ns2016/wp-content/uploads/2016/05/Financial-Regulation-and-Lessons-learned-for-the-EME-from-subprime-and-other-crisis-SEPT-2008.pdf” height=”800px” save=”1″]


Towards Economic Growth and international integration in the middle east AUG 2008

Towards Economic Growth and international integration in the middle east AUG 2008
http://nassersaidi.com/wp-content/uploads/2012/08/Towards-Economic-Growth-and-international-integration-in-the-middle-east-AUG-2008.pdf


Opening doors through good corporate governance MARCH 2008

Opening doors through good corporate governance MARCH 2008
http://nassersaidi.com/wp-content/uploads/2012/08/Opening-doors-through-good-corporate-governance-MARCH-20081.pdf


Managing Capital Flows MARCH 2008

Managing Capital Flows MARCH 2008
http://nassersaidi.com/wp-content/uploads/2012/08/Managing-Capital-Flows-MARCH-2008.pdf


The Power of Regional Economic Integration – JAN 2008

The Power of Regional Economic Integration – JAN 2008
http://nassersaidi.com/wp-content/uploads/2012/08/The-Power-of-Regional-Economic-Integration-JAN-2008.pdf


Pathways to Integration-Lebanon and the euro mediterranean partnership DEC 2007

Pathways to Integration-Lebanon and the euro mediterranean partnership DEC 2007
http://nassersaidi.com/wp-content/uploads/2012/08/Pathways-to-Integration-Lebanon-and-the-euro-mediterranean-partnership-DEC-20071.pdf


CG for the Takaful industry DEC 2007

CG for the Takaful industry DEC 2007
http://nassersaidi.com/wp-content/uploads/2012/08/CG-for-the-Takaful-industry-DEC-2007.pdf


SWF- Policy Issues & Recommendations NOV 2007

SWF- Policy Issues & Recommendations NOV 2007
http://nassersaidi.com/wp-content/uploads/2012/08/SWF-Policy-Issues-Recommendations-NOV-2007.pdf


A dynamic and changing environment- CG in MENA countries JUNE 2007

A dynamic and changing environment- CG in MENA countries JUNE 2007
http://nassersaidi.com/wp-content/uploads/2012/08/A-dynamic-and-changing-environment-CG-in-MENA-countries-JUNE-2007.pdf


CORPORATE GOVERNANCE IN THE GCC- APR 2007

CORPORATE GOVERNANCE IN THE GCC- APR 2007
http://nassersaidi.com/wp-content/uploads/2012/08/CORPORATE-GOVERNANCE-IN-THE-GCC-APR-2007.pdf


Mortgage Markets for the UAE MARCH 2007

Mortgage Markets for the UAE MARCH 2007
http://nassersaidi.com/wp-content/uploads/2012/08/Mortgage-Markets-for-the-UAE-MARCH-20071.pdf


Improving Bank CG in the Arab Countries Arab Bank Review April 2006

Improving Bank CG in the Arab Countries Arab Bank Review April 2006
http://nassersaidi.com/wp-content/uploads/2012/08/Improving-Bank-CG-in-the-Arab-Countries-Arab-Bank-Review-April-2006.pdf


Governance, Post-Conflict Reconstruction & Development APR 2006

Governance, Post-Conflict Reconstruction & Development APR 2006
http://nassersaidi.com/wp-content/uploads/2012/08/Governance-Post-Conflict-Reconstruction-Development-APR-2006.pdf


E-government technology for good governance development and democracy in MENA countries MAY 2005

E-government technology for good governance development and democracy in MENA countries MAY 2005
http://nassersaidi.com/wp-content/uploads/2012/08/E-government-technology-for-good-governance-development-and-democracy-in-MENA-countries-MAY-2005.pdf


Le Système de Paiement au Liban MARCH 2005

Le Système de Paiement au Liban MARCH 2005
http://nassersaidi.com/wp-content/uploads/2012/08/Le-Système-de-Paiement-au-Liban-MARCH-2005.pdf


Le-Marché-Financier-de-Beyrouth-MARCH-2005
http://nassersaidi.com/wp-content/uploads/2012/08/Le-Marché-Financier-de-Beyrouth-MARCH-2005.pdf


Arab Economic Integration- an awakening to remove barriers to prosperity FEB 2005

Arab Economic Integration- an awakening to remove barriers to prosperity FEB 2005
http://nassersaidi.com/wp-content/uploads/2012/08/Arab-Economic-Integration-an-awakening-to-remove-barriers-to-prosperity-FEB-2005.pdf


eGovernment Tech for Good governance, development and democracy in the MENA countries NOV 2004

eGovernment Tech for Good governance, development and democracy in the MENA countries NOV 2004
http://nassersaidi.com/wp-content/uploads/2012/08/eGovernment-Tech-for-Good-governance-development-and-democracy-in-the-MENA-countries-NOV-2004.pdf


EuroMed Economic Cooperation Promises Barriers & Historical Opportunity OCT 2004

EuroMed Economic Cooperation Promises Barriers & Historical Opportunity OCT 2004
http://nassersaidi.com/wp-content/uploads/2012/08/EuroMed-Economic-Cooperation-Promises-Barriers-Historical-Opportunity-OCT-2004.pdf


EuroMed Economic Cooperation & Governance- removing barriers to prosperity OCT 2004

EuroMed Economic Cooperation & Governance- removing barriers to prosperity OCT 2004
ttp://nassersaidi.com/wp-content/uploads/2012/08/EuroMed-Economic-Cooperation-Governance-removing-barriers-to-prosperity-OCT-2004.pdf


Financial Sector Development and Reform NewForumNews JULY 2004

Financial Sector Development and Reform NewForumNews JULY 2004
http://nassersaidi.com/wp-content/uploads/2012/08/Financial-Sector-Development-and-Reform-NewForumNews-JULY-2004.pdf


Ethics&Governance inLebanon JULY 2004

Ethics&Governance inLebanon JULY 2004
http://nassersaidi.com/wp-content/uploads/2012/08/EthicsGovernance-inLebanon-JULY-2004.pdf


ETHICS AND GOVERNANCE IN LEBANON july 2004

ETHICS AND GOVERNANCE IN LEBANON july 2004
http://nassersaidi.com/wp-content/uploads/2012/08/ETHICS-AND-GOVERNANCE-IN-LEBANON-july-2004.pdf


CG in the MENA countries-Transparency&Disclosure JUNE 2004

CG in the MENA countries-Transparency&Disclosure JUNE 2004
ttp://nassersaidi.com/wp-content/uploads/2012/08/CG-in-the-MENA-countries-TransparencyDisclosure-JUNE-2004.pdf


Fusions MAY 2004 (Arabic)

Fusions MAY 2004 (Arabic)
http://nassersaidi.com/wp-content/uploads/2012/08/Fusions-MAY-2004-Arabic.pdf


BankMergers- MAY 2004 (Arabic)

BankMergers- MAY 2004 (Arabic)
http://nassersaidi.com/wp-content/uploads/2012/08/BankMergers-MAY-2004-Arabic.pdf


Promesses Chatoyantes Pietre Performance OCT 2003

Promesses Chatoyantes Pietre Performance OCT 2003
http://nassersaidi.com/wp-content/uploads/2012/08/Promesses-Chatoyantes-Pietre-Performance-OCT-20031.pdf


Bright Promises, Dismal Performance- Aid, Cooperation & Post-Conflict Countries OCT 2003

Bright Promises, Dismal Performance- Aid, Cooperation & Post-Conflict Countries OCT 2003
http://nassersaidi.com/wp-content/uploads/2012/08/Bright-Promises-Dismal-Performance-Aid-Cooperation-Post-Conflict-Countries-OCT-2003.pdf


Mobilizing the Private Sector for CGovernance AUG 2003

Mobilizing the Private Sector for CGovernance AUG 2003
http://nassersaidi.com/wp-content/uploads/2012/08/Mobilizing-the-Private-Sector-for-CGovernance-AUG-20031.pdf


Strategies for Change in Lebanon & Syria- finance trade globalization and the new economy MAY 2003

Strategies for Change in Lebanon & Syria- finance trade globalization and the new economy MAY 2003
http://nassersaidi.com/wp-content/uploads/2012/08/Strategies-for-Change-in-Lebanon-Syria-finance-trade-globalization-and-the-new-economy-MAY-20031.pdf


Building Statistical Capacity Lebanon&Arabic countries APR 2003 (Arabic)

Building Statistical Capacity Lebanon&Arabic countries APR 2003 (Arabic)
http://nassersaidi.com/wp-content/uploads/2012/08/Building-Statistical-Capacity-LebanonArabic-countries-APR-2003-Arabic.pdf


Exchange Rates Regime and Lessons For the Arab countries dec 2002

Exchange Rates Regime and Lessons For the Arab countries dec 2002
http://nassersaidi.com/wp-content/uploads/2012/08/Exchange-Rates-Regime-and-Lessons-For-the-Arab-countries-dec-2002.pdf


Liberalization and Financial Integration of MENA Stock Markets OCT 2002

Liberalization and Financial Integration of MENA Stock Markets OCT 2002
http://nassersaidi.com/wp-content/uploads/2012/08/Liberalization-and-Financial-Integration-of-MENA-Stock-Markets-OCT-2002.pdf


Lebanon & Syria-Building a Partnership to Face Strategic Challenges AUG 2002 (Arabic)

Lebanon & Syria-Building a Partnership to Face Strategic Challenges AUG 2002 (Arabic)
http://nassersaidi.com/wp-content/uploads/2012/08/Lebanon-Syria-Building-a-Partnership-to-Face-Strategic-Challenges-AUG-2002-Arabic.pdf


Building the Lebanon-EU Partnership JUNE 2002

Building the Lebanon-EU Partnership JUNE 2002
http://nassersaidi.com/wp-content/uploads/2012/08/Building-the-Lebanon-EU-Partnership-JUNE-2002.pdf


Syrian Financial Sector Reform & Liberalization-Source of Modernization and Economic Growth MARCH 2002

Syrian Financial Sector Reform & Liberalization-Source of Modernization and Economic Growth MARCH 2002
http://nassersaidi.com/wp-content/uploads/2012/08/Syrian-Financial-Sector-Reform-Liberalization-Source-of-Modernization-and-Economic-Growth-MARCH-2002.pdf


The Barcelona Process- The EU agreement and the 'economy of fear'- the road ahead OCT 2001

The Barcelona Process- The EU agreement and the ‘economy of fear’- the road ahead OCT 2001
http://nassersaidi.com/wp-content/uploads/2012/08/The-Barcelona-Process-The-EU-agreement-and-the-economy-of-fear-the-road-ahead-OCT-2001.pdf


e-lebanon, A New Dawn for Lebanon- The challenges of rebuilding a modern, competitive economy polity& society MAY 2001

e-lebanon, A New Dawn for Lebanon- The challenges of rebuilding a modern, competitive economy polity& society MAY 2001
ttp://nassersaidi.com/wp-content/uploads/2012/08/e-lebanon-A-New-Dawn-for-Lebanon-The-challenges-of-rebuilding-a-modern-competitive-economy-polity-society-MAY-2001.pdf


A New Dawn for Lebanon- The Challenges of Rebuilding a Modern, Competitive Economy, Polity & Society MARCH 2001

A New Dawn for Lebanon- The Challenges of Rebuilding a Modern, Competitive Economy, Polity & Society MARCH 2001
http://nassersaidi.com/wp-content/uploads/2012/08/A-New-Dawn-for-Lebanon-The-Challenges-of-Rebuilding-a-Modern-Competitive-Economy-Polity-Society-MARCH-2001.pdf


Business Environment in Lebanon- APR 2000 (Arabic)

Business Environment in Lebanon- APR 2000 (Arabic)
http://nassersaidi.com/wp-content/uploads/2012/08/Business-Environment-in-Lebanon-APR-2000-Arabic.pdf


Reform Modrnization & Growth MARCH 1999

Reform Modrnization & Growth MARCH 1999
http://nassersaidi.com/wp-content/uploads/2012/08/Reform-Modrnization-Growth-MARCH-19991.pdf


Aid Trade & Cooperation Mare Nostrum Mare Pacifica AUG 1998

Aid Trade & Cooperation Mare Nostrum Mare Pacifica AUG 1998
http://nassersaidi.com/wp-content/uploads/2012/08/Aid-Trade-Cooperation-Mare-Nostrum-Mare-Pacifica-AUG-1998.pdf


Lebanon and the European Union at the Cross-roads- An Interim Assessment of the Partnership Agreement DEC 1996

Lebanon and the European Union at the Cross-roads- An Interim Assessment of the Partnership Agreement DEC 1996
http://nassersaidi.com/wp-content/uploads/2012/08/Lebanon-and-the-European-Union-at-the-Cross-roads-An-Interim-Assessment-of-the-Partnership-Agreement-DEC-1996.pdf


Lebanon's Future a Regional Capital Mkt SEPT 1994

Lebanon’s Future a Regional Capital Mkt SEPT 1994
http://nassersaidi.com/wp-content/uploads/2012/08/Lebanons-Future-a-Regional-Capital-Mkt-SEPT-1994.pdf


Expectations International Business Cycles and BOP AUG 1982

Expectations International Business Cycles and BOP AUG 1982
http://nassersaidi.com/wp-content/uploads/2012/08/Expectations-International-Business-Cycles-and-BOP-AUG-1982.pdf