UAE’s OPEC Exit: Strategic Shift to Energy Policy Independence, Weekly Insights 1 May 2026
UAE’s OPEC Exit: Strategic Shift to Energy Policy Independence, Weekly Insights 1 May 2026
1. UAE’s OPEC exit: Strategic Shift to Energy Policy Independence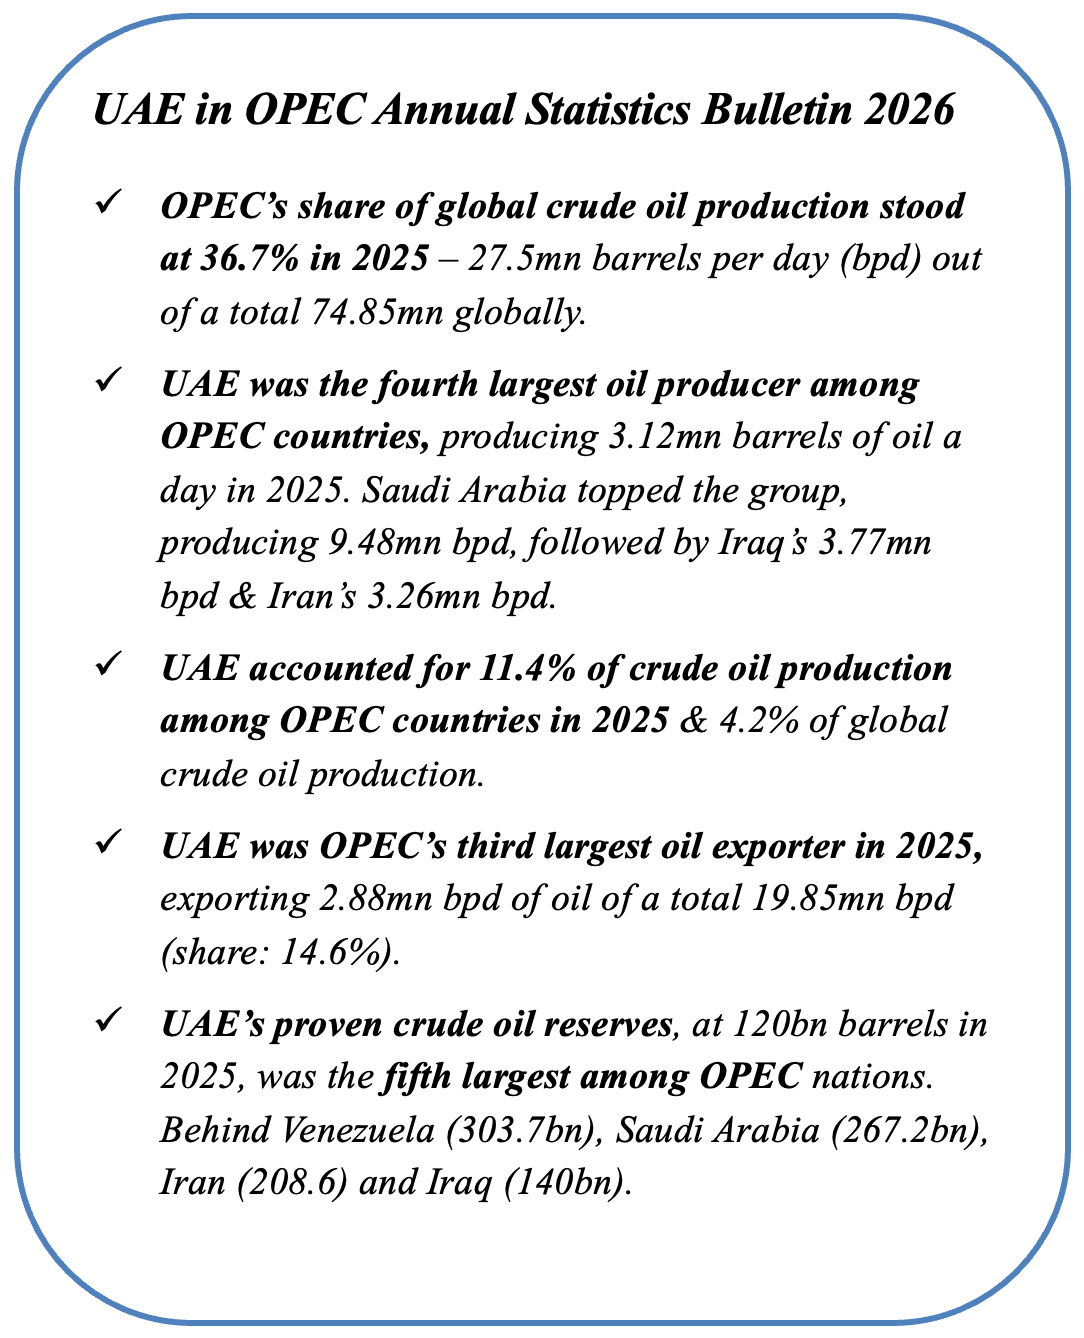
- The UAE has officially withdrawn from OPEC and OPEC+ (effective May 1st), ending a membership that began in 1967.
- The shift removes quota constraints, allowing UAE to expand its production capacity & monetize infrastructure investments.
- UAE’s target is 5 million barrels per day (bpd) by 2027, up from 3.4 million bpd pre-war.
The UAE’s decision is strategic: increased energy production efficiency and energy diversification, resulted in a rejection of OPEC quota constraints.
- Planned expansions to the Habshan-Fujairah pipeline (ADCOP) will allow the UAE to export crude directly to the Indian Ocean, bypassing the currently blocked Strait of Hormuz chokepoint.
- UAE’s strategy is built on a strong diversified energy mix –a foundation of clean and renewable energy, including the Barakah Nuclear plant and major solar installations like Al Dhafra and the Mohammed bin Rashid Al Maktoum Solar Park, which deliver power at record-low tariffs.
- The exit will also enable a green investment pivot – ADNOC can reinvest hydrocarbon profits into hydrogen and green data infrastructure, supporting a sustainable digital economy.
- Resilience at Lower Prices: UAE’s stance is supported by a fiscal break-even & strong sovereign wealth buffers, enabling it to withstand price volatility and pursue bilateral, long-term supply contracts.
2. The New Oil Order and Global Market Dynamics
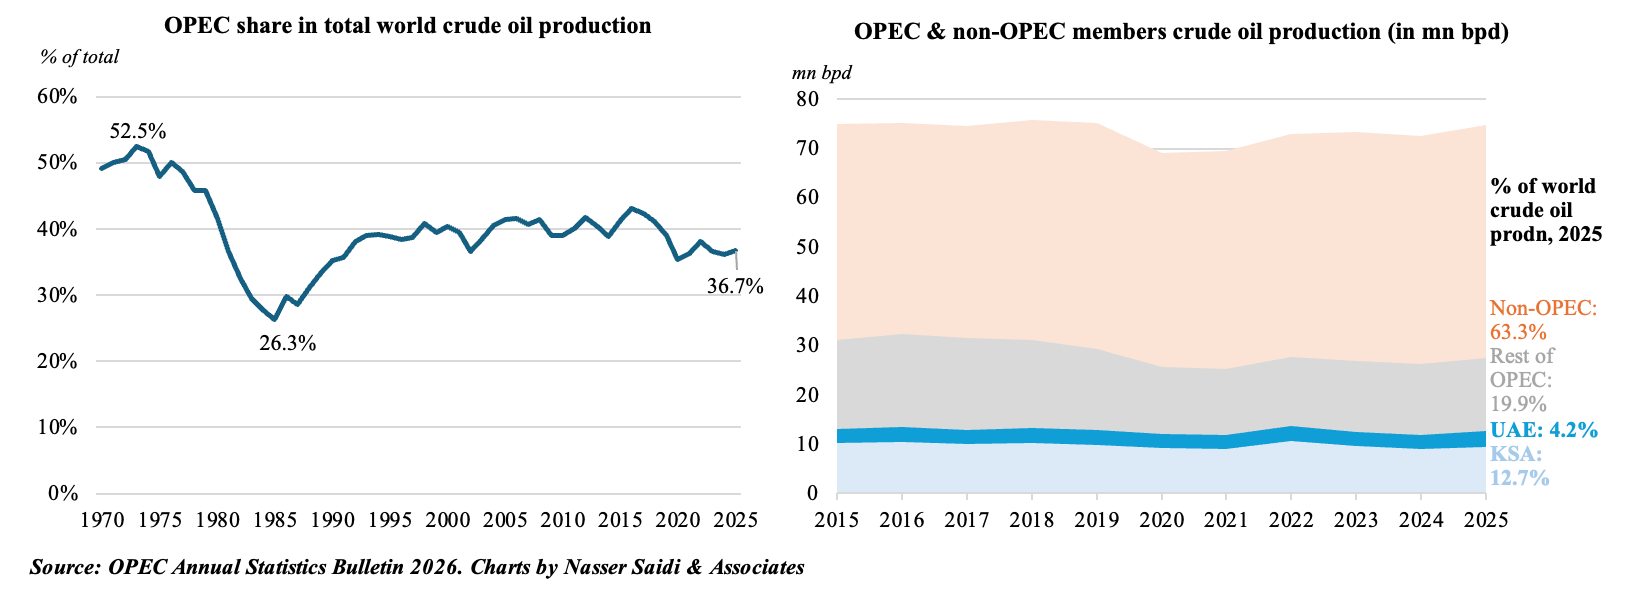
OPEC’s share of global crude production has been shrinking for decades. OPEC’s share of global crude oil production has been declining over time, from 52.5% in 1973 to around 36.7% last year. Why?
A. Supply side changes
- US shale revolution enabled it to dominate non-OPEC supply side, producing 13.58mn bpd & emerging as top petroleum exporter in ‘25
- Rising Global Share of Renewables:according to IRENA, renewable power accounted for almost 50% of global electricity capacity in 2025, a transition that regional conflicts will galvanize and accelerate.
B. Demand side contraction. China’s energy decoupling: state-led urban retrofitting & rapid EV adoption in China have reduced its fossil fuel dependence, bringing forward the projection for peak oil demand.
As both supply and demand dynamics shift, the ability of OPEC+ to control prices will be undermined:
- With oil in Venezuela now being controlled by the US, the potential for a US-pressured Venezuelan exit threatens the power of OPEC+ and OPEC as an organisation.
- Other OPEC members with spare capacity constraints, such as Iraq and Kazakhstan, may follow the UAE’s path as restrictive quotas clash with their domestic fiscal needs.
3. UAE outside the OPEC: What Next?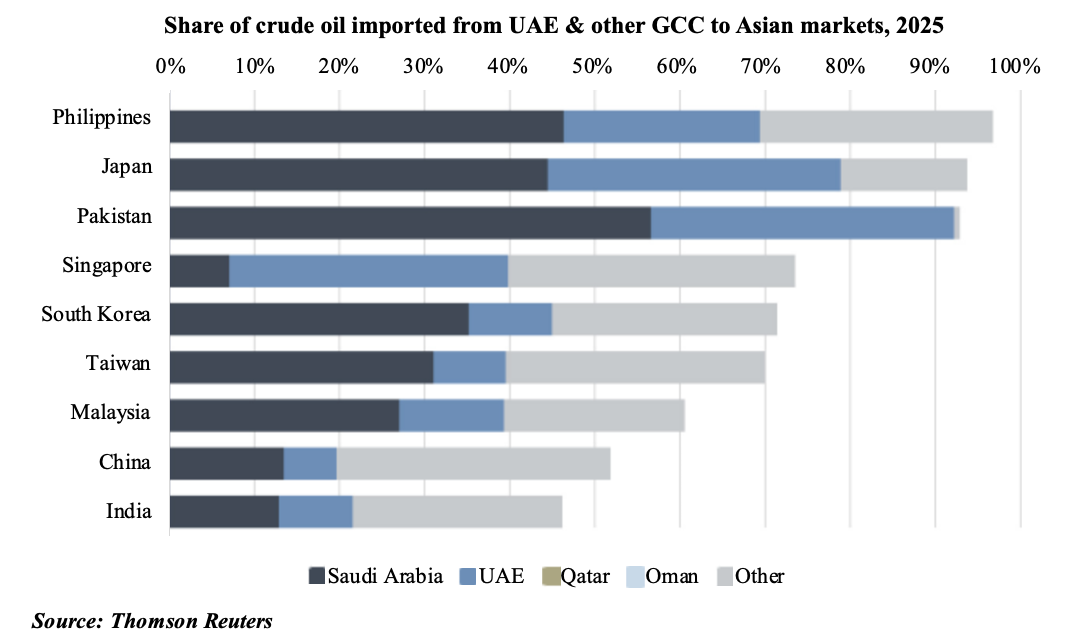
What next?
In the short-term, the effects of UAE’s departure will likely be muted – regional oil flows via the Strait have been throttled. But when the Strait of Hormuz eventually reopens, the world will not return to the “normal” of past years.
Synchronised surge in non-OPEC supply and the structural contraction in global demand will compromise the OPEC’s ability to support prices => downward repricing of crude, favouring diversified and resilient economies. OPEC+’s share will likely dwindle to less than 30% in real terms.
UAE is uniquely positioned to benefit:
- With fiscal break-even at near USD 45 per barrel & a more-diversified economy, UAE will be able to withstand volatile oil prices better than its GCC peers.
- UAE is likely to pursue long-term, bilateral supply contracts with Asia (among its largest partners) to secure future volume, modelled after its CEPAs and Qatar’s recent LNG agreements.
- Amid greater weaponisation of the USD, UAE could even opt to price its oil in Chinese yuan (especially if the USD liquidity remains tight).
- UAE SWFs (with deep pockets and global investments) can act as automatic stabilisers (given deep pockets & global investment portfolios) to absorb the shock to government spending if oil revenues fall sharply.
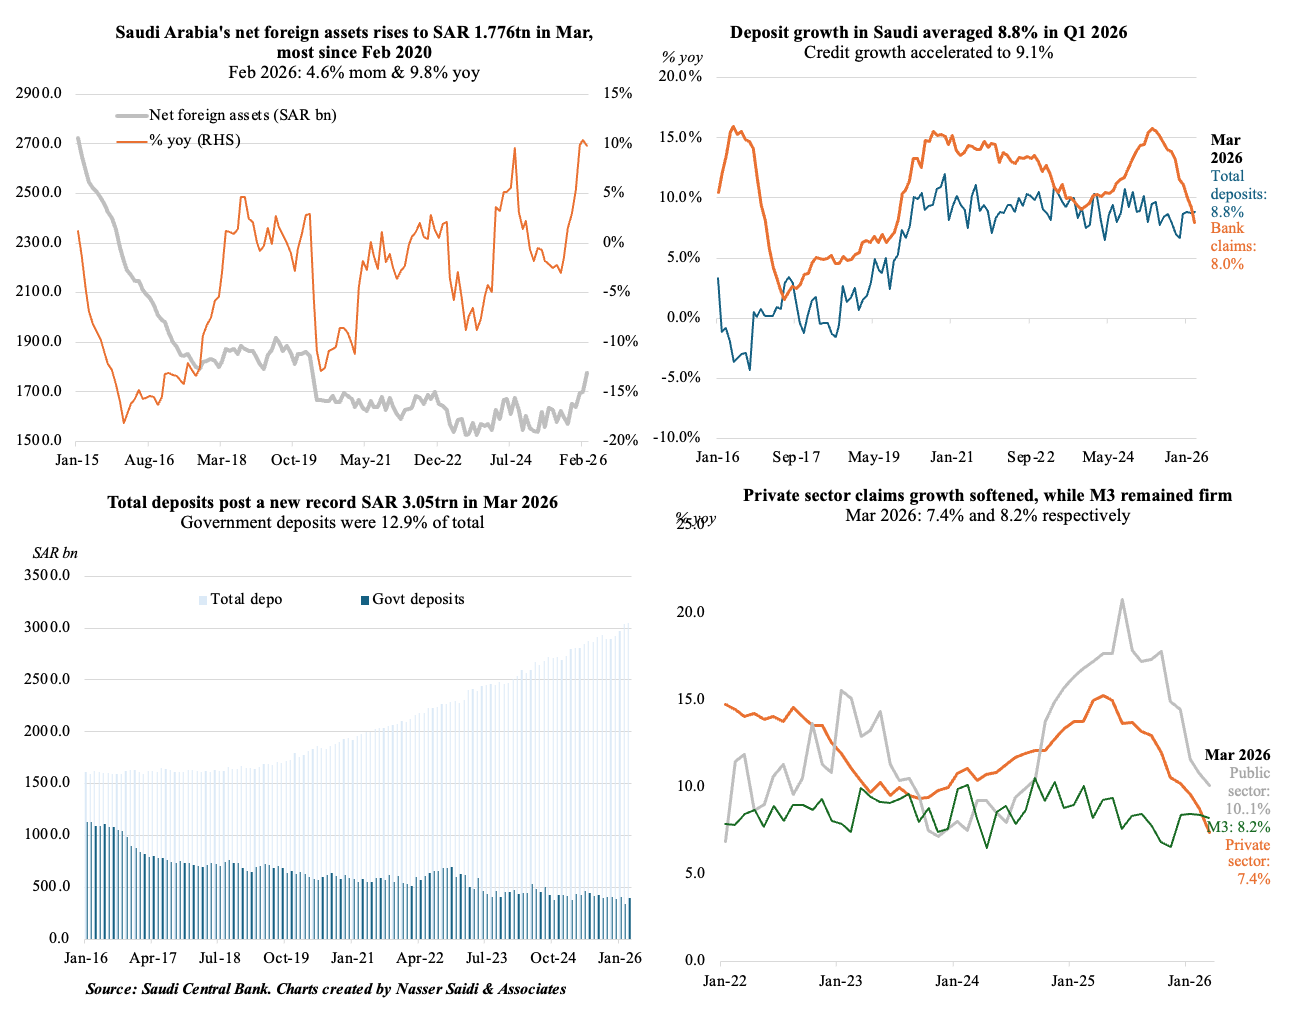
4. Saudi banking liquidity strong despite war: deposits rise to new record (SAR3trn+); private sector growth moderated; net foreign assets the highest since Feb 2020
Mar 2026 – Net foreign assets: 4.6% mom; Total deposits growth: 8.8% yoy; Credit growth: 8.0% yoy; M3 growth: 8.2% yoy
5. Impact of the war softens Saudi Q1 2026 GDP growth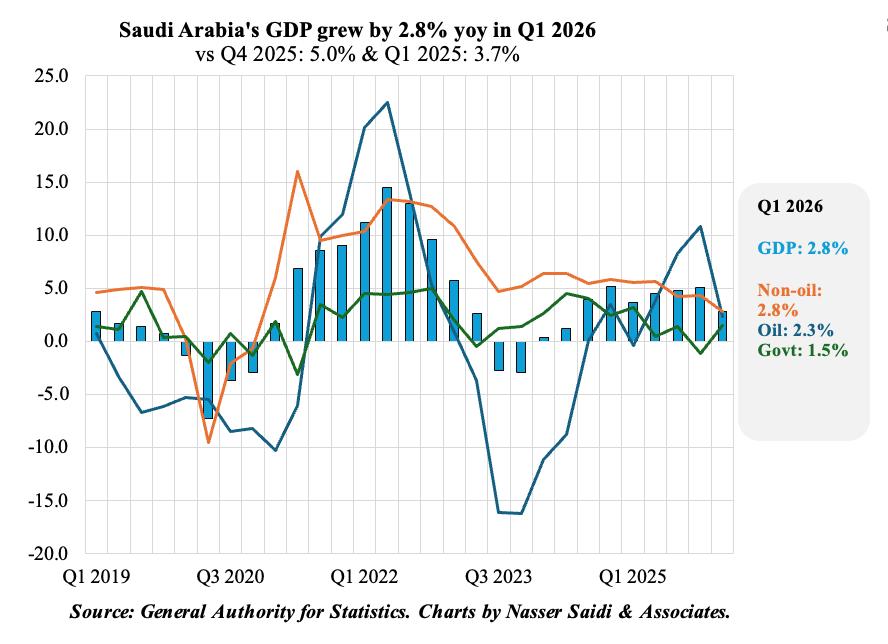
- Saudi Arabia’s real GDP showed a sharp deceleration in annual growth in Q1 2026, growing by 2.8% yoy – a significant slowdown from the previous quarter’s 5% growth.
- On a quarterly basis, the economy shrank by 1.5%, dragged down by oil sector activity (-7.2% qoq) as regional disruptions (due to the Hormuz blockade and war in Iran) took hold in March.
- Non-oil activities expanded by 2.8% yoy and contributed 1.7 percentage points (ppts) to overall growth, though this expansion was much slower than the 5.5% growth from a year ago (and Q4’s 4.3%). Oil activities added 0.7ppts, growing 2.3% yoy: the uptick was a result the OPEC+ decision to ease voluntary curbs that raised oil production levels.
- Impact of the War in Iran: While the conflict and damage to primary infrastructure disrupted trade and oil flows in the GCC region, the economic fallout for Saudi Arabia was less severe than for other neighbouring GCC states. This relative insulation stems from its ability to bypass the Strait of Hormuz.
- Saudi Arabia’s infrastructure resilience was thanks to the East-West Pipeline and Red Sea export terminals, which provided a critical buffer against the shipping blockades, alongside a more diversified industrial base.
- The IMF has lowered its 2026 economic growth forecast for Saudi Arabia to 3.1%; we expect this to be much lower. However, non-oil private sector activity and public investments (related to various giga projects and mega events such as the Expo 2030) should help maintain moderate economic momentum throughout the rest of 2026, depending on the war outcomes.
6. Abu Dhabi non-oil foreign trade edged up to a record-high in 2025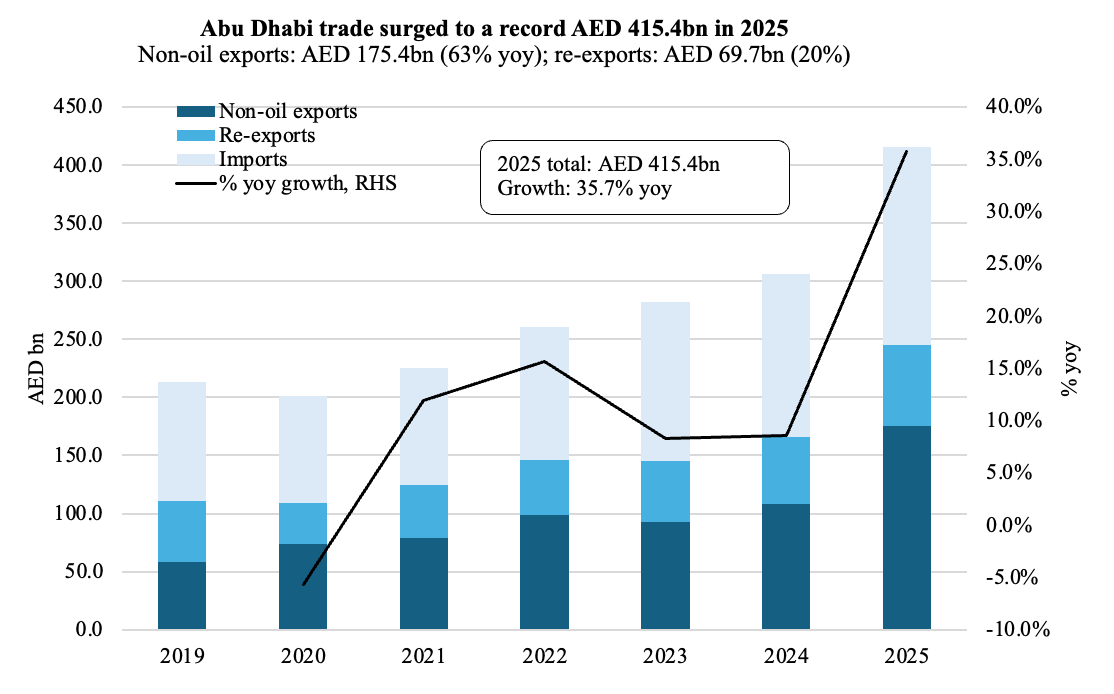
- Abu Dhabi’s non-oil foreign trade surged by 35.7% yoy to a record-high AED 415.4bn (USD 113.1bn) in 2025.
- The export-led growth stemmed from a 63% surge in non-oil exports (to AED 175.4bn) and 20% expansion in re-exports (to AED 70bn) while imports rose 22% (AED 170.4bn).
- Diversified logistics channels: Trade flows were evenly balanced across transport modes prior to the crisis, with land accounting for 35%, air at 33.5% & sea at 31.5%.
- The Iran conflict and the blockade of the Strait of Hormuz has stalled maritime trade, forcing a shift of non-oil trade toward alternative land routes, air freight and Red Sea ports.
- While maritime chokepoint blockades stranded regional oil supply, Abu Dhabi’s direct access to the Indian Ocean via the Habshan-Fujairah (ADCOP) pipeline (with an estimated current capacity of 1.5mn barrels per day) protects a significant portion of its crude from immediate shipping disruption.
- Future Trade Outlook: Future trade flows are pivoting toward increased resilience – including supply-chain localization, strategic food storage and multi-modal transit corridors over the Arabian Peninsula.
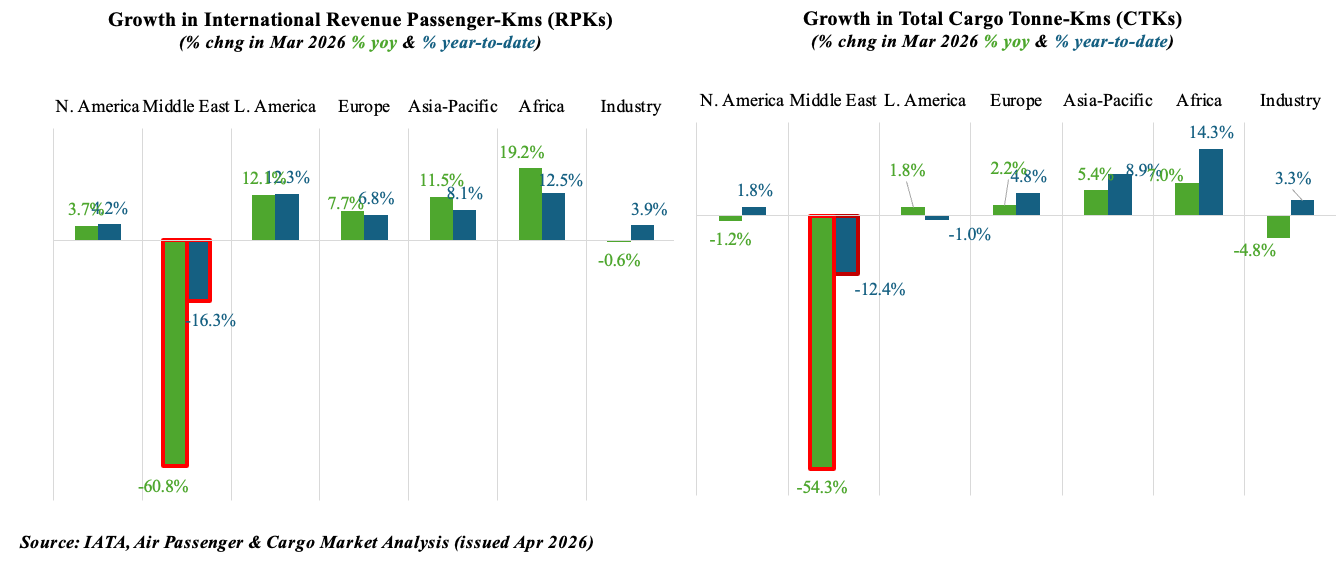
7. War-affected Middle East carriers see plunge in passenger & cargo movements
- Contraction in Air Cargo Demand:Global air cargo demand, measured in Cargo Tonne-Kilometres (CTK), declined by 4.8% yoy in March, as a result of multiple factors including the conflict in the Middle East, surge in jet fuel prices and some distortions from the Chinese New Year holidays. International traffic fell by 5.5% due to overlapping geopolitical and seasonal pressures.
- War & impact on Middle Eastern airlines: a steep 54.3% contraction was recorded in international cargo traffic by Middle Eastern carriers given restricted airspaces, operational uncertainty and deterioration in hub connectivity during the conflict. The weakness was most severe in the Middle East-Asia (-58.6%) and Europe-Middle East (-57.6%) routes.
- Similarly, international passenger traffic carried by Middle East carriers contracted by more than half in March (-60.8% yoy). Global international passenger traffic (RPK) fell 0.6% yoy while overall global passenger traffic (international & domestic) grew by a modest 2.1% – the weakest post-pandemic performance as a result of the disruption to airline operations. RPK growth in the Middle East-Asia route tumbled 55.9%.
- Jet fuel prices rose by 106.6% yoy to their highest level in over 23 years; this increased cargo yields up by 18.9%.
- Industry-wide cargo capacity (ACTK) dropped by 4.7% yoy, nearly matching the decline in demand, while global seat capacity is expected to decline in Apr (an estimated 0.7% drop) before an anticipated recovery in May (+2.0% yoy).
Powered by:
![]()