Conflict & Consequence: The Iran War & the Reshaping of Middle East Economies, Weekly Insights 27 Mar 2026
1. Immediate impacts of the war on Iran / Middle East conflict
- The war in Iran continues for the fourth week. Its outcome is still unclear, as it is dependent on length (duration of the conflict) + width (how many countries & sectors are affected by it, directly & indirectly) + breadth (by the scale of destruction).
- The closure of the Strait of Hormuz has been the main point of contention in the Iran war and wider conflict in the Middle East. Not only has oil and gas production been halted across the region, but the past weeks have also seen a push to open alternative export routes, be it via the Yanbu port in the West of Saudi Arabia or UAE’s Fujairah.
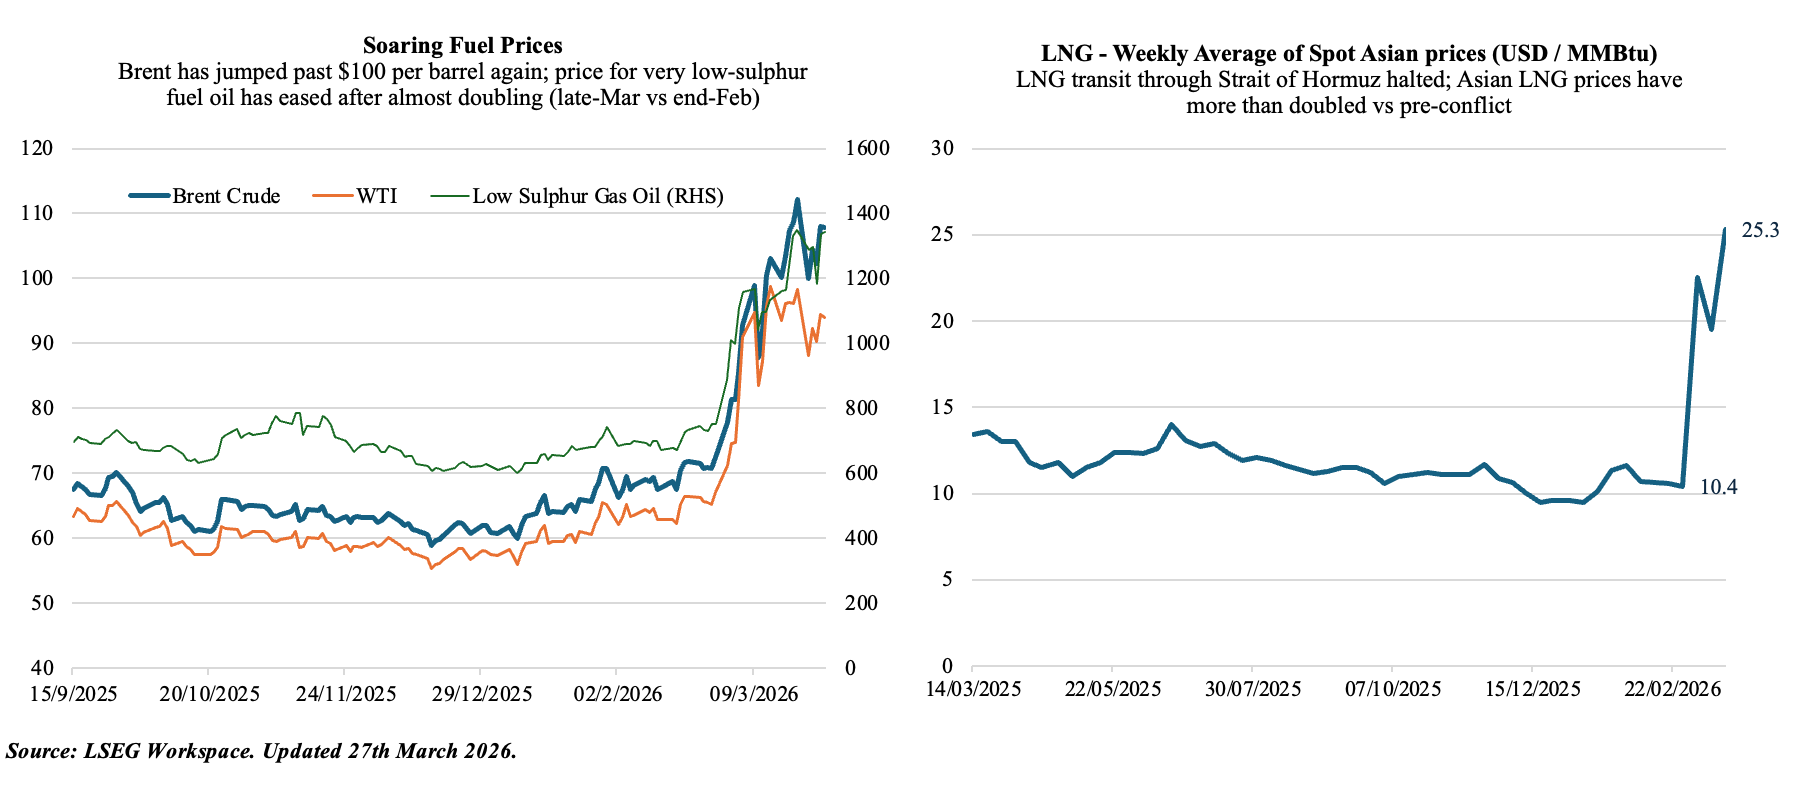
- The US deadline for opening the Strait has been pushed forward again until April 7th: however, with the energy crisis spreading globally, Brent has risen to USD 110 a barrel; the average spot Asian prices for LNG has more than doubled to USD 25.3 / MMBtu. Cost of marine fuel used by ships has eased in recent days (after almost doubling compared to pre-war). Jet fuel costs have also surged to an average of USD 197 per barrel as of the week ending 20 Mar, from USD 99.4 a barrel as of 27 Feb.
2. Fuel Oil Shipments Largely Disrupted via Strait of Hormuz
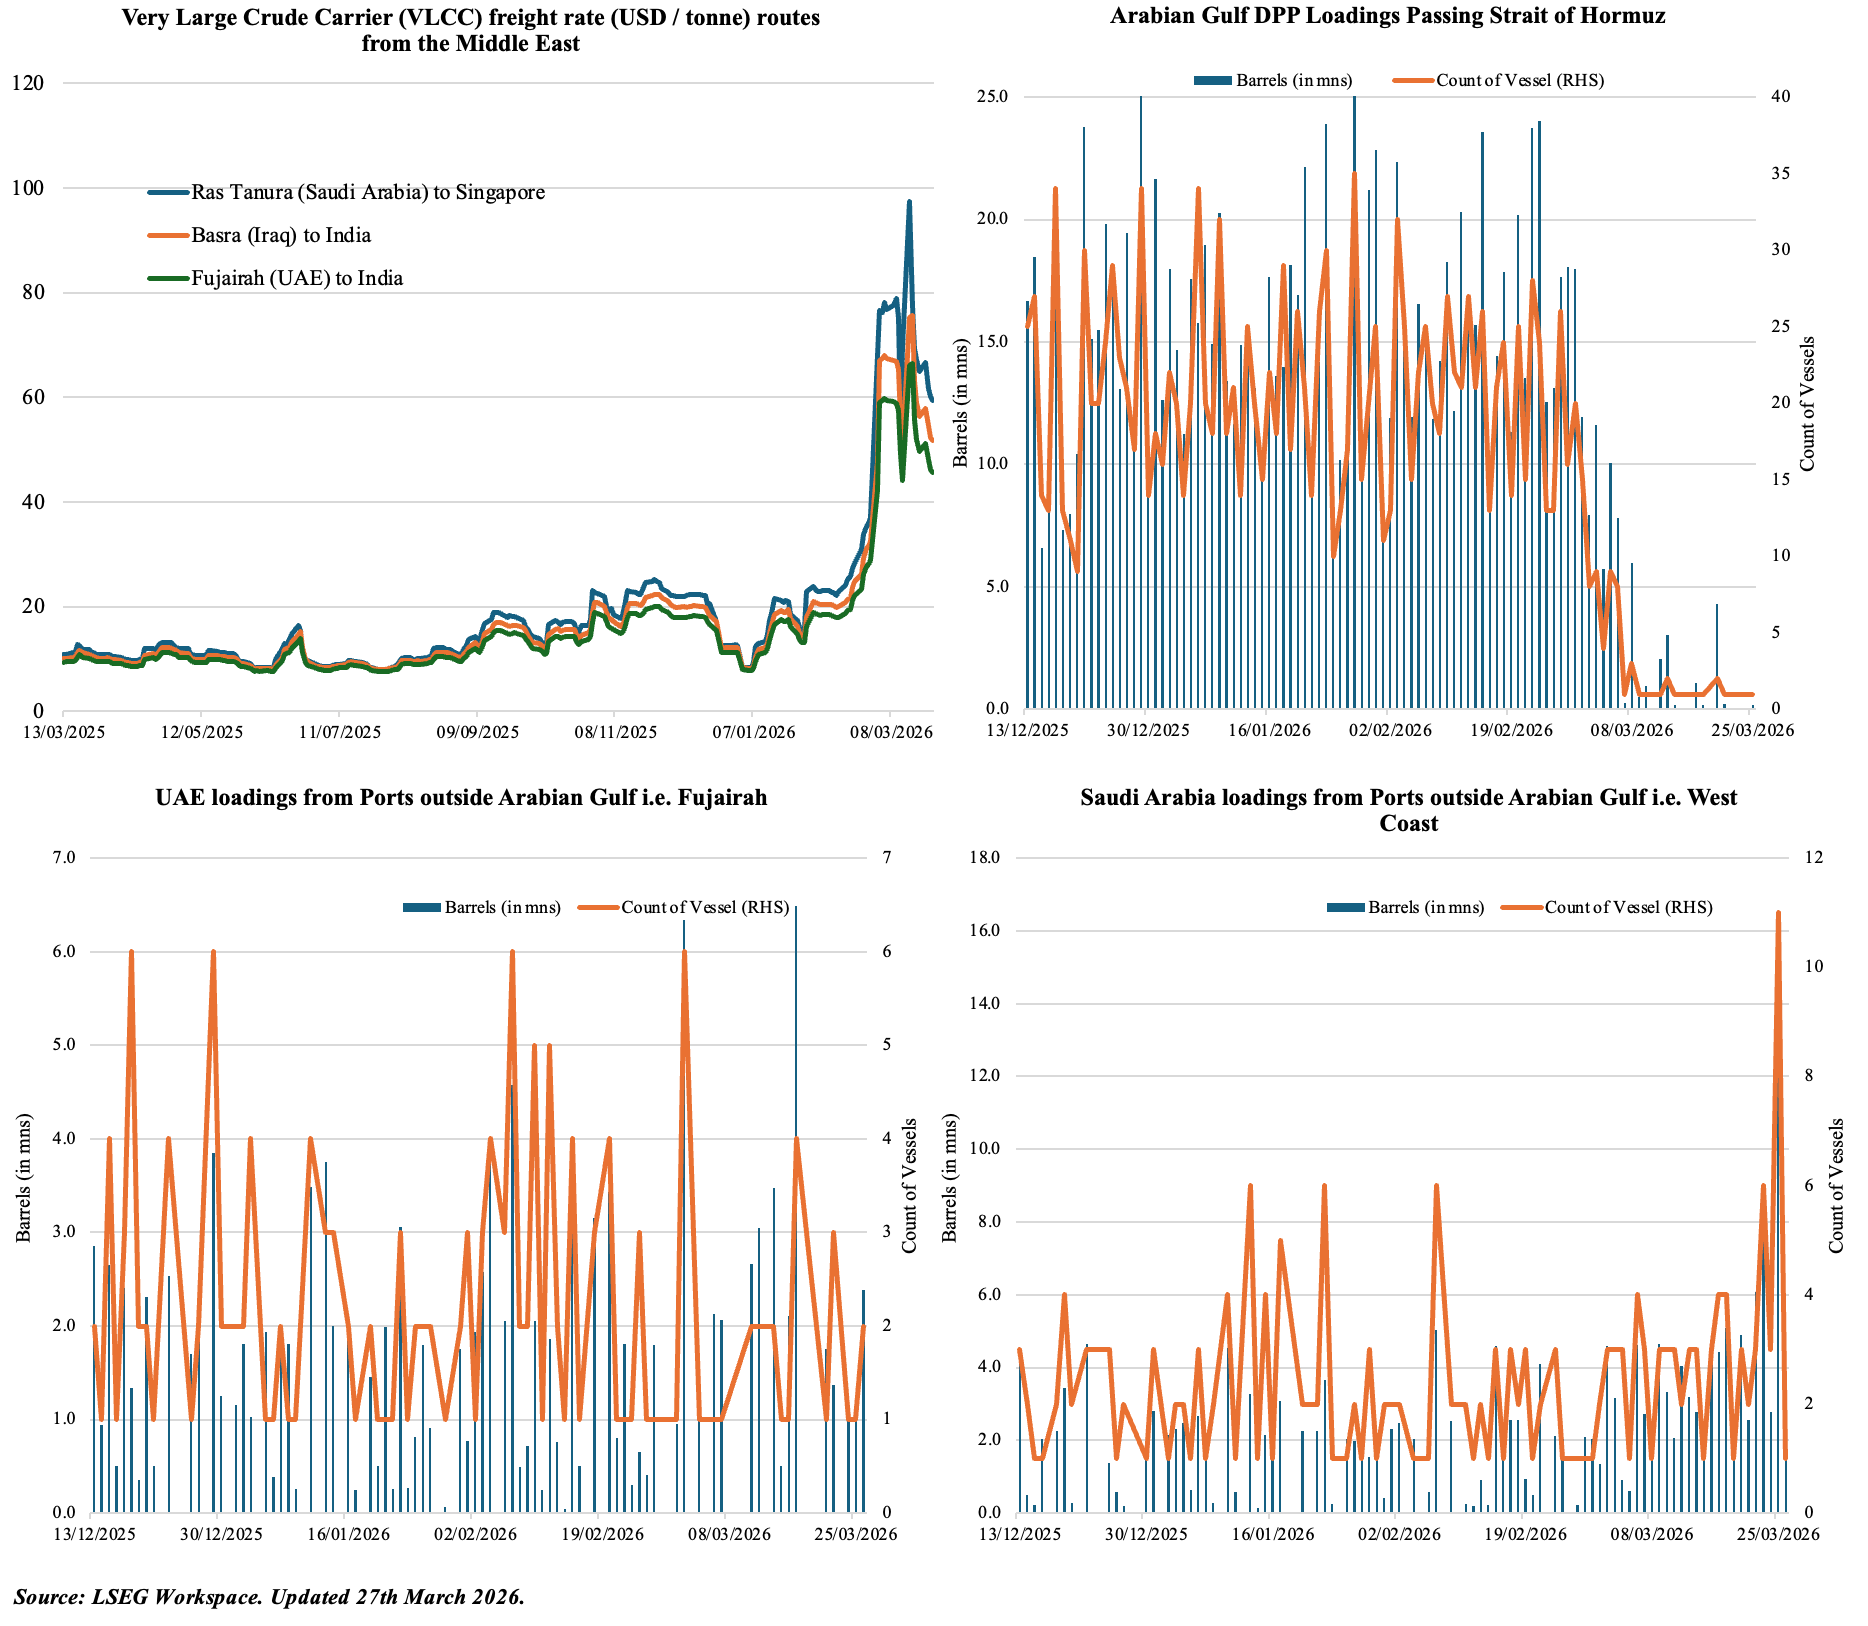
- Only about 100+ ships have passed through the Strait since start of March
- Spike in container freight rates + vessel re-routing + high war-risk insurance premiums + cargo demand=> pressure on supply chains => rising costs.
- Alternative export routes are gaining traction but still significantly below pre-war supplies. including Saudi utilization of the East-West Pipeline (via the Yanbu port in West KSA) and UAE’s Fujairah port.
3. UAE CB’s proactive resilience package: not waiting for the crisis to deepen
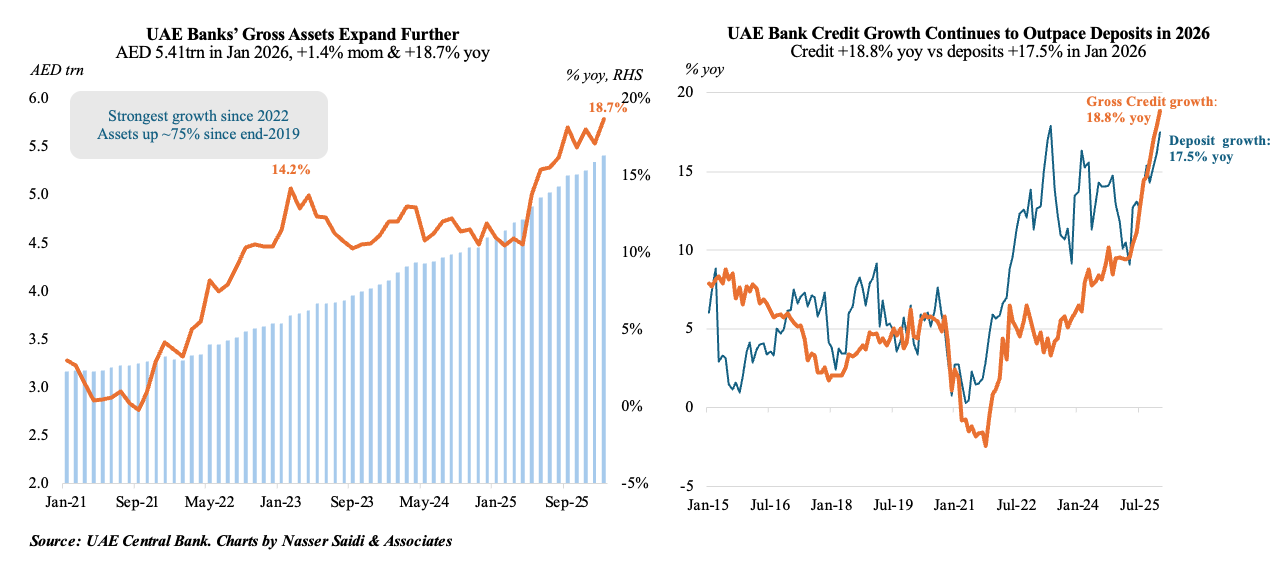
- UAE gross banking assets grew 1.4% mom and 18.7% yoy to AED 5.41trn in Jan 2026.
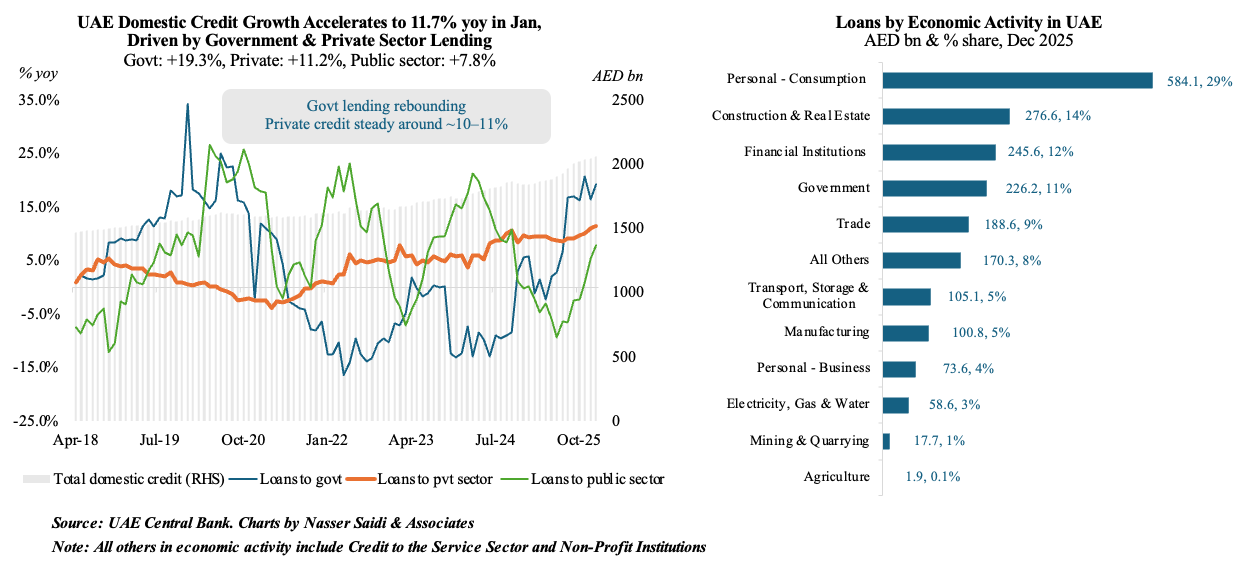
- Gross credit expanded by 1.1% mom to AED 2.598trn in Jan. Growth was primarily domestic, led by a 2.5% monthly surge in government sector credit and a 0.6% rise in private sector lending. Total deposits in Jan rose 0.9% to AED 3.337trn. Notably, resident deposits grew by 1.2% (to AED 3.046trn), successfully offsetting a 2.4% decline in non-resident deposits, demonstrating strong domestic confidence.
- The CBUAE’s own foreign assets crossed the AED 1.084trn threshold by end-Jan, providing a massive external backstop against currency or liquidity shocks.
- In response to the ongoing Iran-US & Israel conflict and threats to regional infrastructure, the CBUAE board approved a five-pillar resilience framework on Mar 17th. This proactive resilience package signals that the UAE is not waiting for the crisis to deepen, instead opting to move proactively and mitigate emerging risks and stabilise the growth outlook. This also reflects lessons from past crises in managing systemic risk (2008 crisis) and the anticipatory move in 2020 (a AED 100bn comprehensive Economic Support Scheme for pandemic-affected retail & corporate customers).
4. UAE CB’s proactive resilience package: key pillars
In response to the ongoing Iran-US & Israel conflict and threats to regional infrastructure, the CBUAE board approved a five-pillar resilience framework on Mar 17th. Key pillars of the UAE central bank resilience package are:
- Monetary policy measures: Banks can access up to 30% of their cash reserve requirements & tap into term liquidity facilities in AED & USD.
- Liquidity & Funding Relief: Temporary relief in banks’ stable funding & liquidity ratios => more flexibility in managing daily operations.
- Capital Buffer Relief: Banks can temporarily utilize their capital buffers – specifically the Capital Conservation Buffer (CCB) and the Countercyclical Capital Buffer (CCyB) – to increase lending capacity.
- Credit risk management: Banks can postpone the classification of loans as “high risk” for customers directly impacted by the conflict, preventing automatic credit tightening.
- Additional support: Banks are instructed to continue supporting customers and the national economy with financing services.
The CB is undertaking its role and function as a liquidity provider and lender of last resort. This means businesses (especially SMEs) can continue to access financing and also ensures that economic activity doesn’t slow sharply due to a “credit crunch”. Because the private money market is limited in size, it is appropriate that the CB intervene to provide liquidity in the interbank & money markets.
5. Oman Q1 2026 growth to be cushioned by relative safety, logistics/trade, tourism
- In the backdrop of the conflict in the Middle East, Oman’s ports in Salalah and Duqm are operating as primary regional logistics hubs, absorbing trade redirected from the volatile upper Gulf corridor. Oman and Dubai have activated a “green corridor” for sea and air shipments via faster and more efficient customs procedures.
- Unlike regional peers facing double-digit GDP contractions due to shut-ins, Oman’s relative safety will likely see growth supported by trade & logistics during Q1. Anecdotal evidence points to a “safe haven” surge in hotel bookings during Eid, with strong regional and domestic travel (70% of its nearly 64k guests (+60% yoy) came from the Gulf).
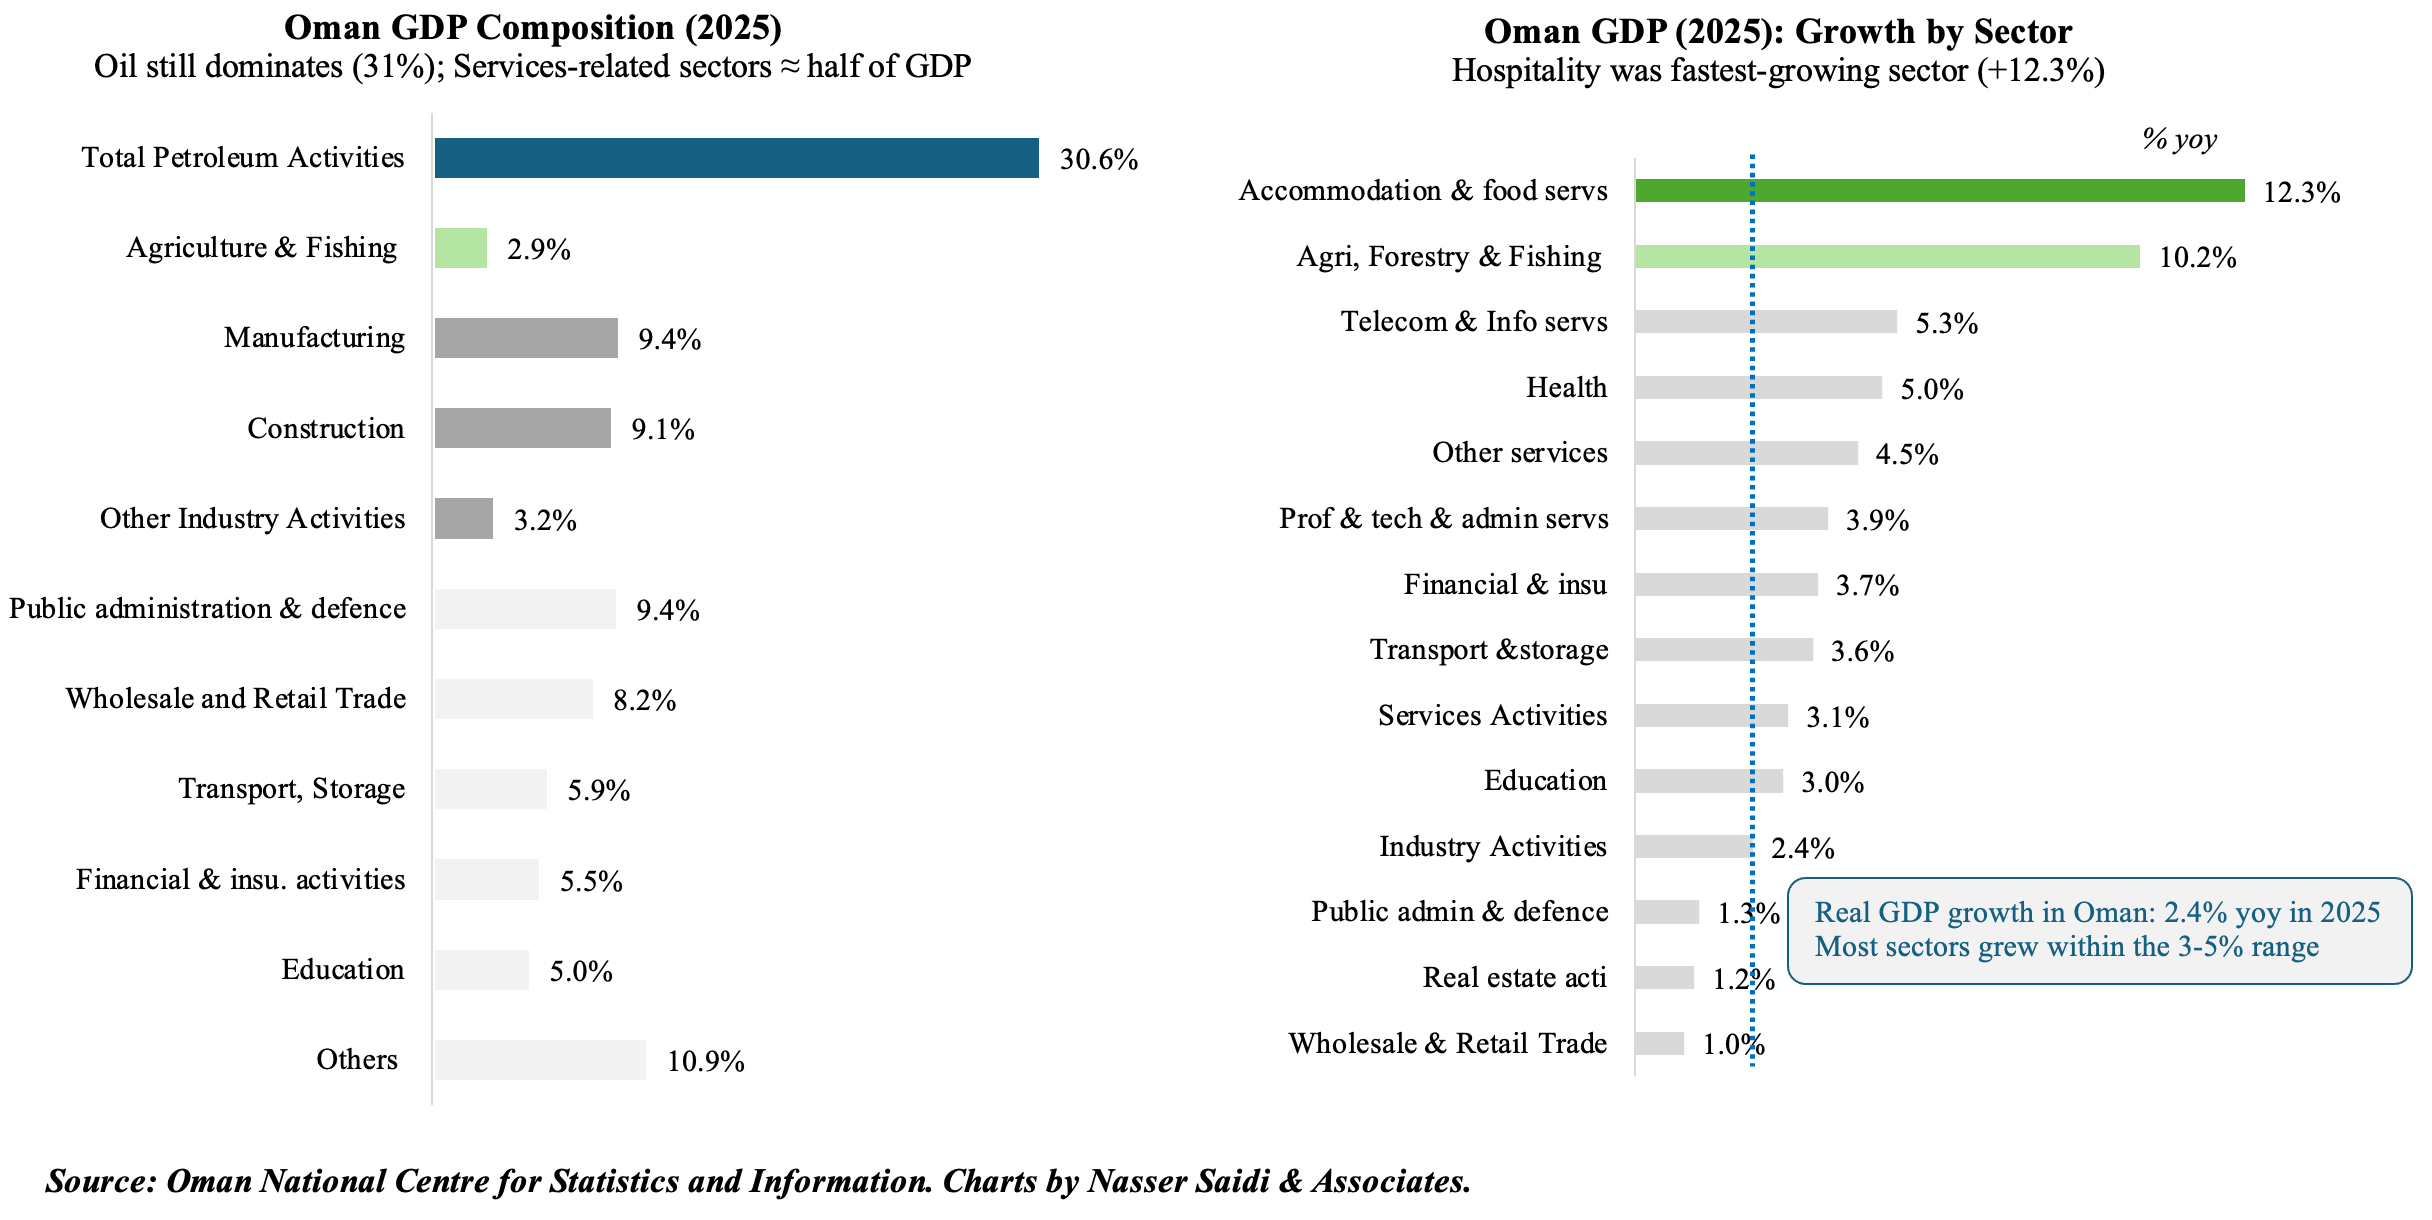
- Real GDP in Oman grew by 2.4% yoy to OMR 39.3bn in 2025, with the non-oil sector supporting the increase (3.1%) and accounting for more than 70% of total GDP.
- Among non-oil sector, services and industry activities grew by 3.1% and 2.4% while agriculture & fishing surged 10.2%. Key drivers included hospitality (+12.3%), agriculture and fisheries (+10.2%), financial (3.7%) and transport/logistics (+3.6%) sectors. Petroleum sector activity rose by 1.1% (Q4: a very strong 3.4% uptick), with natural gas and crude petroleum growing 0.6% & 1.2% respectively.
6. Saudi record re-exports boosts Jan trade; supplies being diverted from Hormuz
- With the Strait of Hormuz nearly closed, shippers are utilising Saudi Arabia’s internal logistics network (for example, its Red Sea and land-bridge connections) to move goods that would otherwise be stranded. The East-West pipeline was carrying 1.3mn barrels per day to Yanbu in Jan: a figure that has more than tripled to 4.4mn bpd in the five days to Mar 24th to offset the Hormuz closure. Around 56mn bpd of KSA crude oil are stored on tankers & stranded currently; at least 40 VLCC tankers carrying 2mn barrels each are anchored near Yanbu.
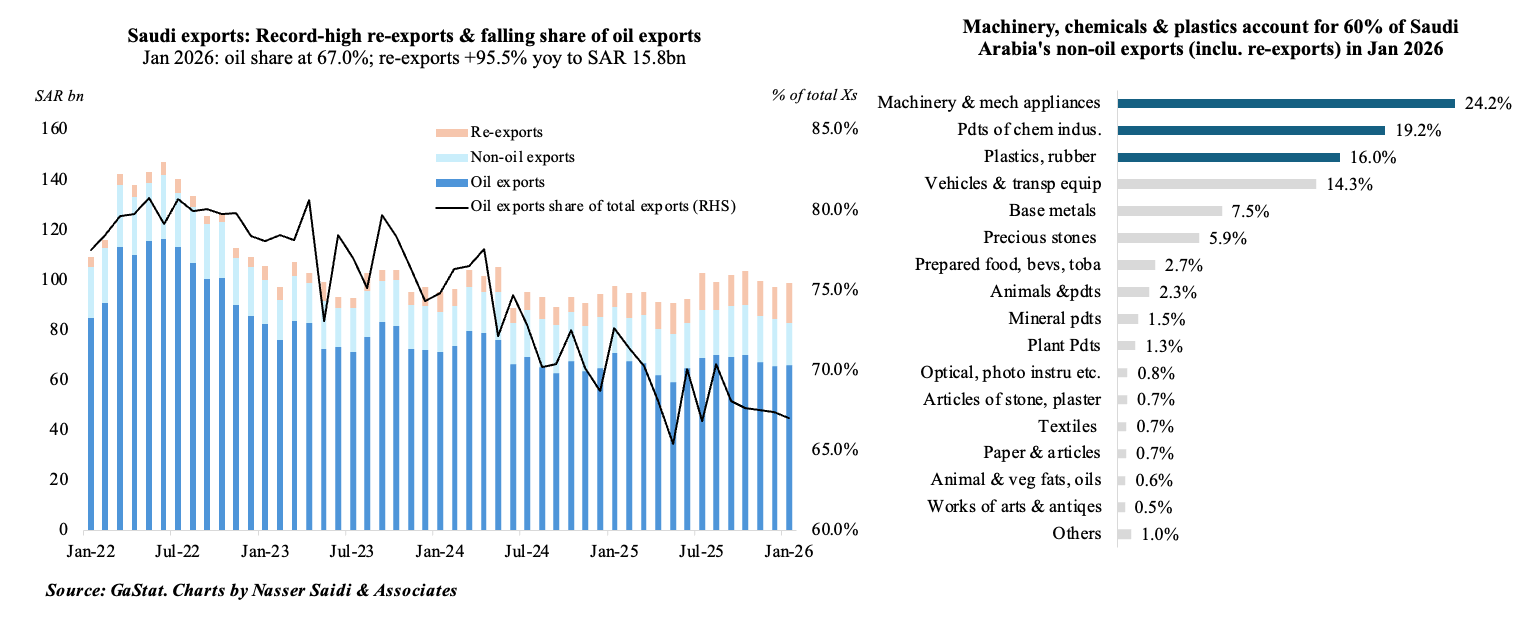
- Non-oil exports (including re-exports) in Saudi Arabia accelerated 22.1% yoy to SAR 32.57bn in Jan 2026. While national non-oil exports saw a slight contraction, re-exports surged by a staggering 95.5% to a record-high SAR 15.8bn.
- Machinery was the largest segment of total non-oil exports (24.2%), followed closely by chemicals & its products (19.2%) and plastics, rubber and their articles (16.0%). These are the high-value industrial inputs required to keep regional manufacturing operational.
- The high volume of trade with the UAE (SAR 11.59bn in non-oil exports alone) highlights the integration of the two economies even pre-conflict. UAE accounted for 36% of non-oil exports; share of non-oil exports to GCC was 44.1%. Jeddah Islamic Seaport and King Abdulaziz International Airport handled a combined 30% of non-oil exports in Jan.
- Overall exports grew 1.6% mom and 1.4% yoy to SAR 98.7bn in Jan, though the share of oil exports continued to decline (67%). Imports fell by 3.3% mom to SAR 81.4bn in Jan, resulting in a narrower trade surplus, SAR 17.3bn.
7. US Treasury yields ticked up. KSA, UAE US Treasuries holdings among top 20 globally in Jan; Kuwait hits new record-high
- With the ongoing US-Iran negotiations, there has been a recent uptick in yields across the curve as markets price in a potential “higher-for-longer” monetary stance.
- The yield on the 10-year Treasury rose to 4.46%, its highest since the war began.
- Overall foreign holdings of US Treasuries grew by 8.0% yoy to USD 9.31trn in Jan. This compares to Dec’s reading of USD 9.271trn.
- While Japan continued as the dominant holder of US Treasury securities (USD 1.225trn, its largest reading since Jul 2022). China’s holdings fell 9% since the beginning of 2025 to USD 694.4bn by Jan.
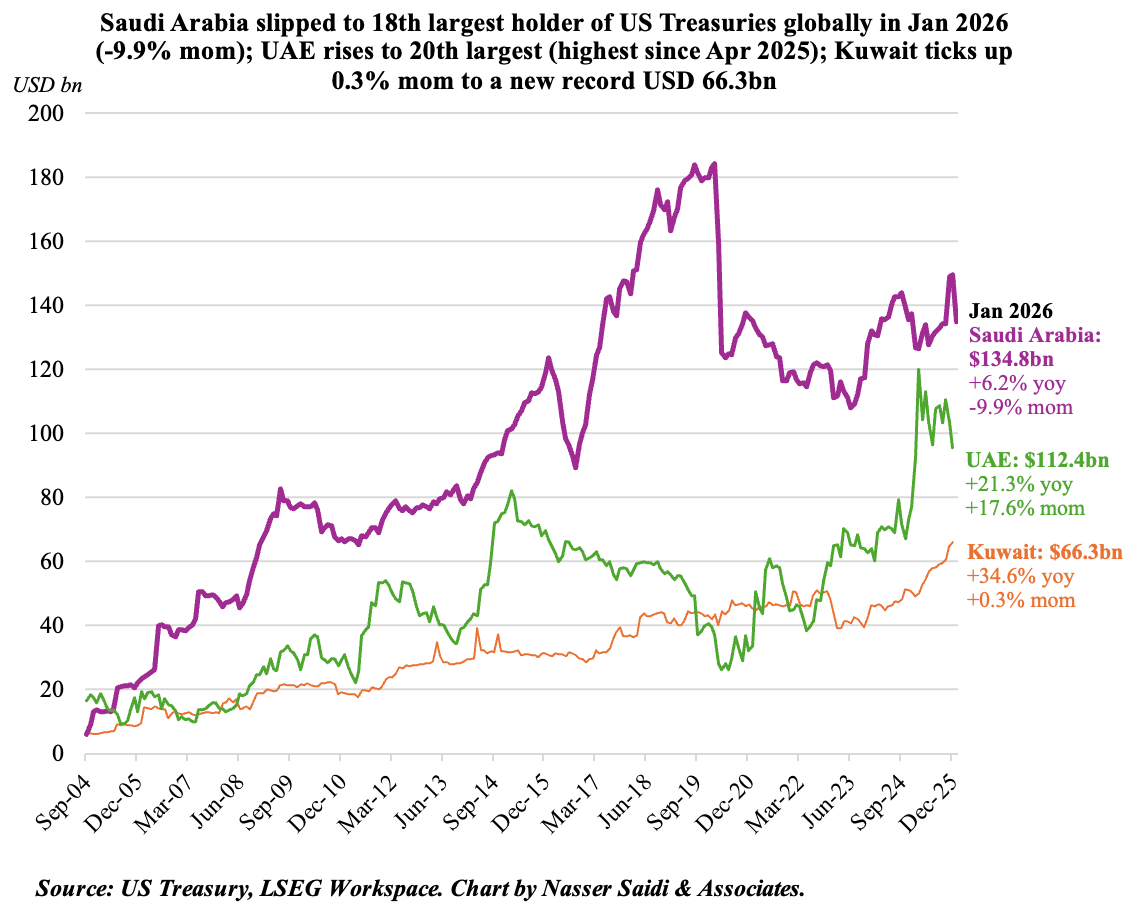
- Saudi Arabia’s holdings of US Treasuries grew by 6.22% yoy to USD 134.8bn in Jan, though in monthly terms it dipped by USD 14.7bn. Saudi ranked 18th globally, falling one place as South Korea increased its holdings (to USD 141.3bn).
- UAE increased its holdings to USD 112.4bn (17.6% mom and 21.4% yoy), the highest since Apr 2025, to become the 20th largest holder globally.
- Kuwait’s holdings rose to a new record high of USD 66.3bn.
Powered by:
![]()