The Middle East Conflict Sends Global Shockwaves, Weekly Economic Commentary 16 Mar 2026
Download a PDF copy of the weekly economic commentary here.
Markets
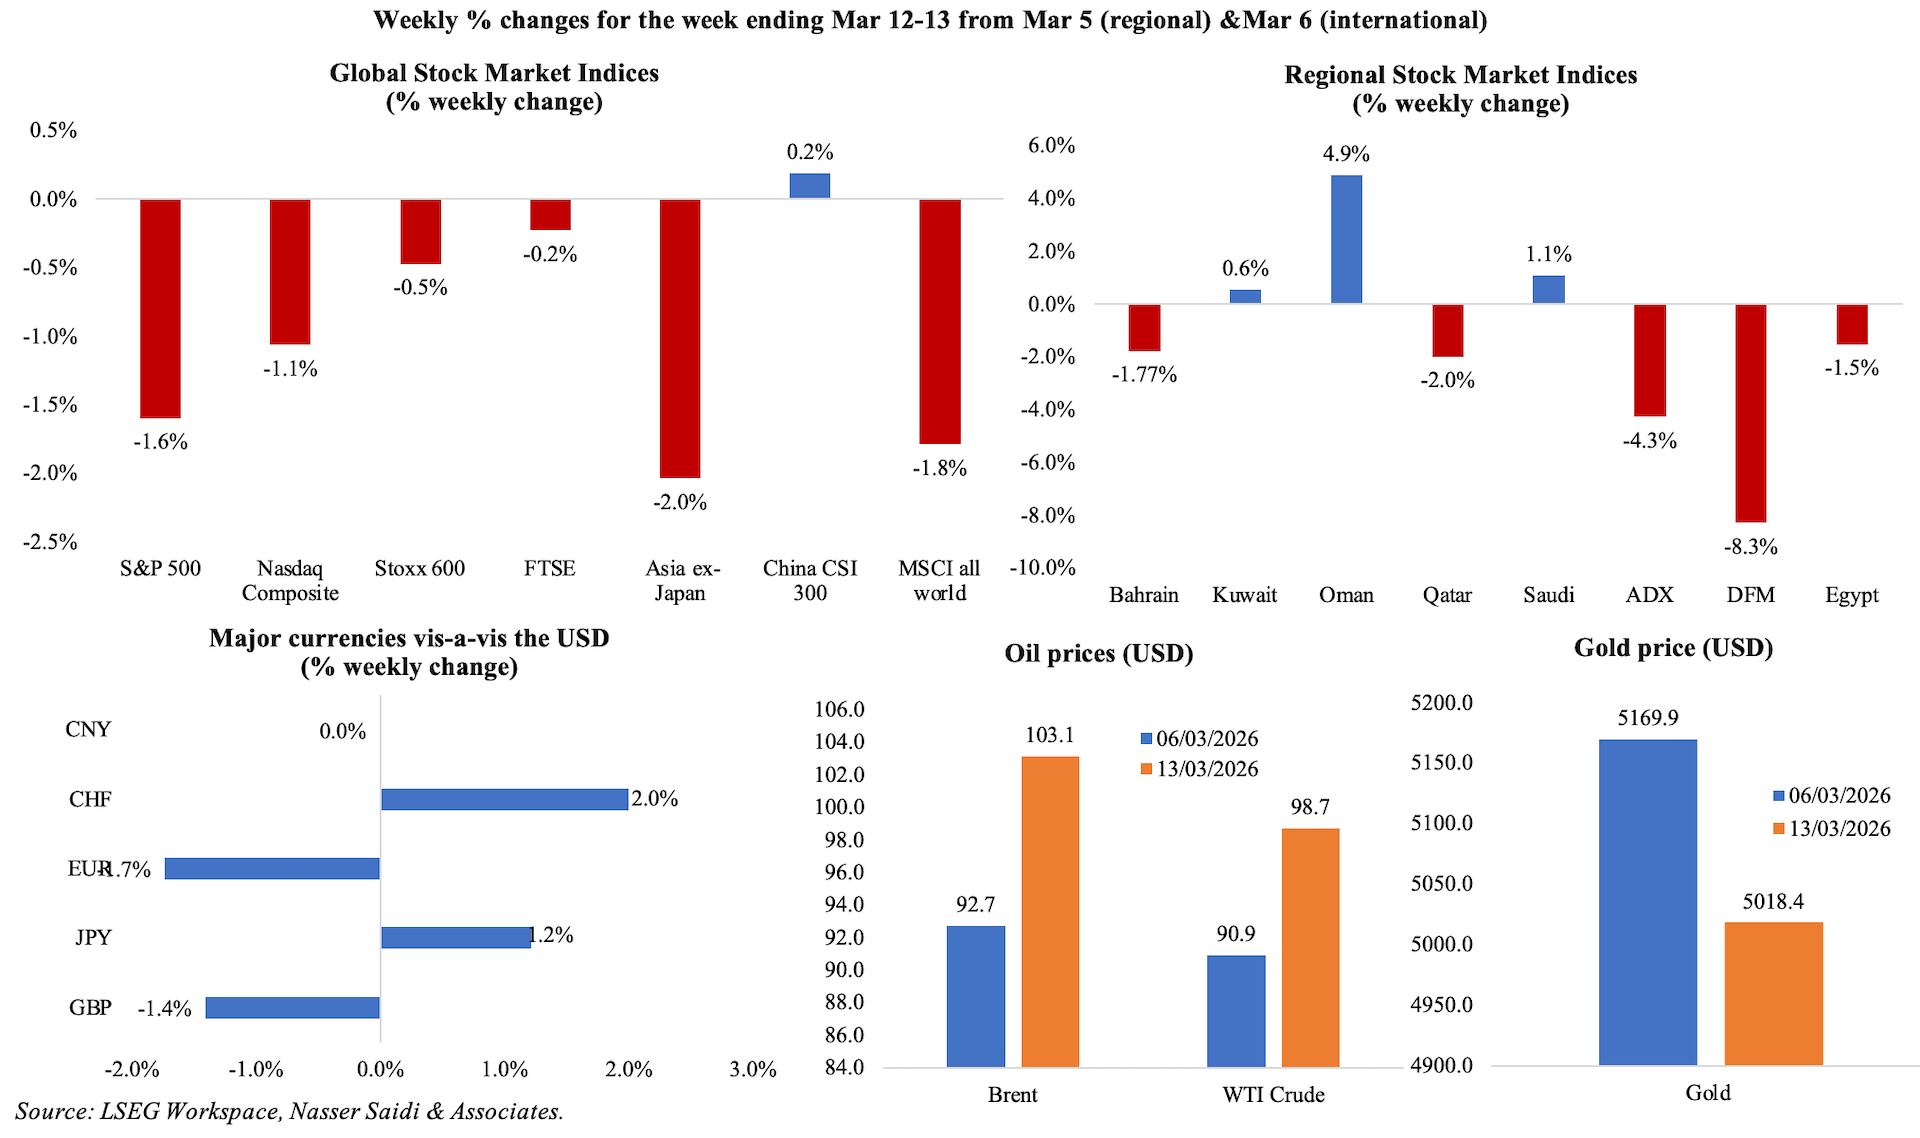
Global equities declined amid heightened geopolitical tensions in the Middle East: S&P 500 fell 1.6%, the Nasdaq dropping over 1.0%, Europe’s STOXX 600 slipping about 0.5% and Asia ex-Japan plunging 2.0% as investors turned cautious. Risk sentiment weakened further as higher energy prices revived inflation concerns and reduced expectations for near-term US rate cuts. In the Middle East, UAE stocks came under pressure as fears of a prolonged regional conflict weighed on sentiment (Dubai’s DFM fell 8.3%), while energy-linked stocks such as Saudi Arabia’s Aramco (which rallied to nearly 13% on Thursday) saw support from the surge in crude prices. Currency markets reflected a flight to safety, with the USD strengthening against major peers; the euro and pound softened while the Japanese yen weakened to the weakest since Jul 2024. Brent prices surged above USD 100 per barrel (for the first time since Aug 2022 and from around USD 60 at start of 2026) amid supply concerns. Gold price fell more than 1% on the week thanks to a stronger USD.
Economic Consequences from the conflict in the Middle East & Policy Responses
The US-Israel-Iran conflict continues into the third week, with the closure of the Strait of Hormuz (chokepoint for approximately 20% of global petroleum and 25% of LNG flows), leading to a scarcity shock and raising Brent crude to over USD 100 a barrel (and rising). This is an existential concern for Asia (especially for China, India, Japan, and South Korea), which absorb over 80% of the Strait’s seaborne exports; sector-wise, the impact is most acute in the logistics, petrochemical, and agricultural sectors. Even with a ceasefire, it could take 24-36 months before the regional energy architecture gets back on track.
Early estimates from the Trump administration place costs of the conflict with Iran for the US at more than USD 11bn in just six days. This spending includes military operations, logistics and associated support costs, underscoring the fiscal burden that could be placed on the US government budget if the conflict is extended. The IEA’s 32 member countries released 400mn barrels of oil to combat rising oil prices (out of a stockpile of more than 1.1bn barrels), with the US contributing 172mn. Wood Mackenzie estimates that Saudi has lost USD 4.5bn in oil & gas revenues since the start of the war, with losses across GCC totalling USD 15.1bn. A prolonged closure / disruption of flows via the Strait of Hormuz (which carries roughly 20% of global oil consumption) would tighten supply and elevate price volatility; the release of strategic petroleum reserves and rerouted shipments could eventually offer only some mitigation.
For central banks, this represents a policy nightmare as energy-driven headline inflation is expected to spike amid supply chain disruption (higher if the conflict rages on for longer). The US Fed, ECB, BoE and others are meeting this week to decide on policy: all are widely expected to hold interest rates. The surge in energy prices has prompted traders to scale back their expectations for rate cuts from the Fed (one or two 25bps cuts versus the two or three that were anticipated before the war). There are also expectations for interest rate hikes before end of the year (by the ECB and BoE).
Regional Developments Post-conflict
- The UN estimates that up to 3.2mn people have been internally displaced within Iran since the outbreak of the conflict, highlighting the severe humanitarian impact of the war and strain on domestic infrastructure and social services. Over the medium term, reconstruction costs and population displacement could significantly weigh on Iran’s economic recovery prospects.
- TheInternational Energy Agency (IEA) warned that the world could face the largest oil supply disruption on record if conflict across the Middle East intensifies, potentially exceeding previous shocks such as the 1973 Oil Crisis. Global supply is expected to drop by 8mn barrels per day (bpd) in Mar (roughly 8% of world demand).
- OPEC confirmed an increase in Saudi crude production ahead of the conflict: output in Jan and Feb stood at 10.10mn bpd and 10.882mn bpd respectively. OPEC+ averaged 42.72mn bpd in Feb (+445k bpd vs Jan). A prolonged conflict risks overwhelming spare capacity.
- Aluminium Bahrain (Alba) initiated a “controlled and safe shut down” of roughly 19% of its aluminium production capacity (three aluminium smelting lines) due to raw material supply disruptions linked to instability in the Strait of Hormuz. Aluminium is a key export sector for Bahrain, meaning production cuts could affect industrial output and trade balances.
- Egypt also raised fuel prices as part of its subsidy reforms, though these risk feeding into broader inflation pressures across transportation and production costs. In the coming months, inflation is likely to remain volatile, particularly if global energy and food prices rise amid regional conflict.
- Since the conflict and disruptions to shipping routes, Egypt (a) offered to lease out 10 oil storage facilities along the Red Sea (estimated at 29mn barrels) as a contingency measure; (b) introduced customs facilitation measures (for example, exempted advanced registration of goods) for cargo ships bound for Gulf markets, allowing the country to become an alternative logistical hub for rerouted trade flows; and (c) delayed a planned international bond issuance amid rising global risk premiums and uncertain investor demand due to heightened market volatility.
- Revenues from the Suez Canal have seen a cumulative loss of USD 10bn since 2020, according to Egypt’s President, given shipping disruptions and security concerns in the Red Sea. Lower transit volumes have reduced a crucial source of foreign currency earnings; this will now increase.
- Fitch Ratings stated that the Middle East conflict is unlikely to trigger widespread downgrades of GCC corporate ratings, citing strong government support and corporates’ robust liquidity. However, sectors directly exposed to logistics, tourism and aviation face higher operational risks.
- Air cargo rates across the Middle East have surged sharply (around 70% on some routes), reported Reuters, with businesses increasingly shifting to air transport to bypass maritime bottlenecks and security risks. While this shift supports airline revenues, it raises logistics costs for global supply chains and inflationary pressures (should the disruption persist for longer).
- The conflict in the Middle East has increased jet fuel prices significantly – up to USD 150-200 per barrel from USD 85-90 per barrel – reflecting tightening supply conditions and rising risk premiums across energy markets. Higher aviation fuel costs are putting pressure on airline operating margins, and if this fuel price volatility is sustained, it could translate into higher airfares and slower recovery in aviation demand.
- Iraq intends to maintain crude output at around 4mn barrels per day despite disruptions caused by the regional conflict, according to the oil ministry, also emphasising that production infrastructure remains largely intact.
- The United Nations launched a USD 308mn emergency appeal for humanitarian support in Lebanon, where around 800k people have been displaced by the conflict. The crisis compounds the country’s existing economic fragility following years of financial instability, and places additional pressure on public services.
- Anecdotal evidence suggests a surge in hotel booking and occupancy in Oman this month as travel-disrupted passengers and expatriates relocated temporarily from higher-risk areas across the GCC. The country’s relative neutrality and perceived stability have positioned it as a temporary safe haven; this will support occupancy rates and short-term tourism revenues.
- Supply interruptions inQatar’s LNG production have pushed global helium prices higher, given that helium is extracted as a by-product of natural gas processing. Qatar last year produced about 63mn cubic metres of helium (of 190mn globally), making disruptions significant for industries ranging from semiconductors to medical imaging.
- Saudi crude exports through the Red Sea are expected to reach record highs in Mar, with shipments via Yanbu averaging 2.2mn barrels per day (bpd) in Mar 1-9 (Feb: 1.1mn bpd) amid the blockade of the Strait of Hormuz. The surge reflects efforts to reroute exports away from the Strait of Hormuz amid geopolitical disruptions, leveraging Saudi’s east-west pipeline infrastructure. While this provides an alternative outlet for crude flows, it only partially offsets the scale of supply normally shipped through Hormuz (about 6mn bpd). The port has capacity to handle more than 4.5mn bpd though it has rarely loaded more than 2.5mn bpd in the past. Looking ahead, this highlights the strategic importance of Red Sea export capacity – which could become an increasingly critical buffer against disruptions in the region’s shipping lanes.
- DP World confirmed that operations at Jebel Ali Port remain fully functional despite regional conflict, though inbound vessel traffic has declined as shipping companies reroute vessels to avoid the Strait of Hormuz. The company is implementing mitigation strategies, including alternative routing and supply-chain adjustments, while some traffic shifts toward Red Sea ports. Among UAE’s other ports Khorfakkan can handle 5mn twenty-foot equivalent units (TEUs) and Fujairah less than 1mn TEUs versus Jebel Ali’s 15.6mn TEUs last year.
- Oil loading operations at Port of Fujairah restarted after a drone strike over the weekend forced a temporary halt to some export activities. The port is a key regional energy hub outside the Strait of Hormuz and serves as a major outlet for UAE crude and refined product storage. According to Kpler data, it exported more than 1.7mn bpd of crude oil and refined fuels on average last year, equivalent to about 1.7% of daily world demand.
- Flights from the UAE are slowly on the rise: Emirates disclosed 369 flights operating on Sunday, the most since the war began and 70% of its pre-conflict levels. Etihad had 100 flights operating on Sunday.
- The UAE successfully raised USD 300mn through its AED-denominated Treasury bond auction – the first such offering since the onset of the regional conflict. Total bids reached AED 4.9bn (an oversubscription of 4.4 times), underscoring strong investor demand and continued confidence in UAE’s credit profile and macroeconomic stability despite heightened geopolitical risk. Over time, sustained issuance could help establish a more liquid local-currency yield curve and strengthen the UAE’s domestic capital markets.
Macroeconomic Developments in the MENA region
- Annual urban consumer inflation in Egypt increased to 13.4% in Feb (Jan: 11.9%), driven primarily by price hikes in food (4.6% from 1.9%) and housing & utilities (31.7% from 29.8%) among other service prices. In monthly terms, prices ticked up by 2.8% (Jan: 1.2%), the fastest increase since Feb 2024. Core inflation accelerated to 12.7% yoy (Jan: 11.2%).
- Egypt plans to list around 20 state-owned enterprises on the local stock exchange this month as part of its privatization and capital-market deepening agenda, revealed the assistant to the prime minister and CEO of the State-Owned Enterprises Unit. This aims to attract foreign investment, improve governance and reduce government’s role in commercial sectors.
- Egypt’s trade deficit widened by 12.2% yoy to USD 4.9bn in Dec, as exports and imports grew by 6.8% (to USD 4.6bn) and 9.6% (to USD 9.5bn) respectively.
- Passenger car imports into Egypt jumped 11.5% yoy to USD 2.9bn in 2025, reflecting recovering consumer demand and easing restrictions on vehicle imports. Auto sales in the country grew by nearly 39% yoy to 14,100 vehicles in Jan.
Macroeconomic Developments in the GCC
- Oman’s crude oil output rose 3.7% yoy to about 31mn barrels in Jan, reflecting steady production (2.2% to 1.024mn bpd) and ongoing upstream investment. Stable oil output combined with elevated prices could support Oman’s fiscal revenues if the conflict drags on.
- Saudi Arabia’s GDP expanded by 5.0% yoy in Q4 2025, supported by broad-based gains across oil (10.8%), non-oil (4.3%); government activities contracted by 1.2% in Q4 2025 – suggesting a strategic shift toward private-sector-led growth and more disciplined fiscal policy. For the full year 2025, real GDP grew by 4.5%, significantly outperforming 2024’s 2.7% growth, primarily driven by the reversal of previous OPEC+ production cuts. Saudi non-oil PMI is likely to soften in Mar-Jun 2026 as input prices for construction and technology imports rise, potentially slowing the pace of giga projects. Saudi Arabia’s benefits from the USD 100 per barrel oil price will depend on export volumes via the East-West pipeline. We expect the government/ PIF to utilise any oil revenue gains towards boosting resilient infrastructure & greater localised defence spending (localization rate stood at 24.9% of total military spending in 2024 vs 4% in 2018).
- Consumer price inflation in Saudi Arabia eased to 1.7% yoy in Feb, the lowest level in a year, reflecting stable food prices that offset persistent pressures from housing rents. Housing-related costs rose 4.1%, driven primarily by a 5.1% increase in rents, while prices of transport (1.4%) and hospitality (1.9%) posted moderate gains.
- Saudi industrial production grew by 10.4% yoy in Jan, the strongest reading since Oct 2022, driven largely by stronger output in mining and quarrying (13.3%) as well as improved performance in non-oil activities (5.3%). Within non-oil manufacturing, the fastest growth was recorded by chemicals (10.6% yoy) – possibly that the extra O&G produced is also feeding into downstream industries (petrochemicals). The renewed momentum is thanks to energy-related output and industrial activity after earlier supply constraints tied to production cuts.
- Saudi Arabia’s industrial and mining sectors continued expanding, with the government issuing 1,660 new industrial licenses in 2025, representing an investment of SAR 76bn (USD 20.5bn). The Ministry of Industry and Mineral Resources issued 29 new mining licenses in Jan – including 21 quarry licenses for building materials, seven exploration permits, and one mining exploitation license – raising the total number of active licenses to 2,934. Authorities are positioning mining as a key pillar of economic diversification, leveraging estimated mineral wealth valued at USD 2.5trn.
- S&P Global Ratings affirmed Saudi Arabia’s sovereign rating at A+ with a stable outlook, highlighting strong fiscal buffers, manageable debt levels and continued non-oil economic growth. Saudi Arabia’s ability to reroute crude shipments via the Red Sea was cited as a factor supporting resilience amid regional geopolitical tensions; fiscal policy flexibility and Vision 2030-driven diversification were also identified additional stabilizing factors.
- Dubai Residential REITannounced an AED 1.1bn dividend payout for 2025, reflecting robust rental income and strong occupancy across its residential portfolio. This highlights the resilience of Dubai’s residential real estate market following several years of rapid population and demand growth.
- S&P affirmed the UAE’s sovereign credit rating at AA/A-1+ with a stable outlook, citing strong fiscal buffers, growing diversification and policy flexibility amid regional conflict. UAE’s consolidated net financial assets, estimated at 184% of GDP in 2026, and its low general government debt (of around 27% of GDP) are seen as key buffers to shocks.
Global Developments
US/Americas:
- US GDP grew by a 0.7% annualised rate in Q4, revised down from the previous estimate of 1.4% (Q3: 4.4%), largely due to lower government spending (partly because of the record 43-day shutdown). Final sales to private domestic purchases, which excludes government, trade and inventories, grew by 1.9% (revised down from 2.4%). The ongoing Iran war will impact Q1’s results.
- Inflation in the US remained unchanged at 2.4% in Feb while core inflation was also flat at 2.5%. Energy prices ticked up 0.5% yoy and housing-related inflation was steady at 3.0%. The March reading is bound to show a significant jump: petrol prices (that fell 5.6% yoy in Feb) have risen more than 20% since the US launched the war in Iran.
- The core Personal Consumption Expenditures (PCE) price index rose slightly to 3.1% yoy in Jan (Dec: 3.0%), the biggest gain since Mar 2024. PCE inflation eased to 2.8% (Dec: 2.9%), with services inflation higher due to healthcare and transportation services.
- Personal income grew by 0.4% mom in Jan (Dec: 0.3%), thanks to wages and annual cost-of-living adjustments for seniors and recipients of Social Security Administration benefits. Personal spending also grew by 0.4% mom in Jan while real consumer spending inched up by 0.1%. The saving rate increased to a six-month high of 4.5% (Dec: 4.0%).
- Durable goods orders in the US were flat in Jan (Dec: -0.9%) while excluding transportation equipment, orders inched up 0.4%. Non-defence capital goods excluding aircraft was also flat (Dec: +0.8%), suggesting that firms remain cautious about expanding capital expenditure amid uncertain demand conditions and financing costs.
- Trade deficit in the US narrowed to USD 81.8bn in Jan (Dec: USD 99.3bn), as goods exports increased 8.1% (to USD 195.5bn) and imports fell 1.0% (to USD 277.3bn). Goods and services surplus also narrowed to USD 54.4bn (from USD 72.9bn), with exports up 5.5% to a record high USD 302.1bn and exports and imports of services jumping to record highs of USD 106.7bn and USD 79.3bn respectively.
- NFIB business optimism index slipped to 98.8 in Feb (Jan: 99.3), indicating a modest softening in confidence among small business owners. The index remains close to its long-term average but suggests that firms continue to face headwinds from labour quality (about 15% cited this as their single most important problem; the last time this was identified as top issue was in Apr 2020) and supply chain disruptions (59% reported so) among others.
- Existing home sales grew 1.7% mom to 4.09mn in Feb; however, unsold inventory rose by a much quicker 2.4% to a total of 1.29mn (or about 3.8 months of supply). Building permits fell by 5.4% to 1.376mn – single family housing permits fell 0.9% mom and 11.6% yoy to 873k while permits for multi-housing plunged 13.4% – suggesting that developers remain cautious about future construction amid elevated construction costs. The divergence between improving sales and declining permits highlights the uneven nature of the housing recovery.
- Housing starts increased 7.2% yoy to 1.487mn in Jan, supported by a surge in starts for projects with five-units or more (+29.1% to 524k) while single-family starts dropped 2.8% mom and 6.5% to 935k. Though mortgage rates have declined, leading to a gradual improvement in homebuying, the war is leading to rising cost pressures.
- Michigan consumer sentiment index declined to 55.5 in Mar (Feb: 56.6), with part of the survey conducted after the Iran war started. It was noted that the interviews prior to the start of the war were showing an improvement, that was fully wiped out by the later responses. The one- and five-year inflation expectations stood at 3.4% (unchanged) and 3.2% (from 3.3%).
- JOLTS job openings increased to 6.946mn in Jan (Dec: 6.55mn), the largest monthly gain since Oct 2024, signalling a renewed increase in labour demand. With 7.37mn persons unemployed in Jan, there were 0.94 jobs available per unemployed worker, much lower compared to pre-pandemic levels. The 2025 data was revised down: annual average job openings level was 7.1 million, a decline of 571k from 2024.
- Initial jobless claims slipped by 1k to 213k in the week ended Mar 7, with the 4-week average down by 4k to 212k. Continuing jobless claims fell by 21k to 1.85mn in the week ended Feb 28.
Europe:
- Industrial production in the eurozone fell by 1.5% mom in Jan (Dec: -0.6%), the sharpest decline since Apr 2025, given declines across the board in non-durable consumer goods (-6.0% vs +0.4%), capital goods (-2.3%), durable consumer goods (-1.9%) and intermediate goods (-1.9%). IP fell by 1.2% yoy, the first yearly decline in a year, and following Dec’s 2.2% gain. Ongoing economic uncertainty are weighing on investment and output decisions: output fell in Germany (-1.3%), Italy (-0.6%) and Spain (-0.5%) but rose in France (0.5%).
- Eurozone Sentix investor confidence plunged to -3.1 in Mar (Feb: 4.2), a rapid deterioration in investor sentiment. With the survey conducted Mar 5-7, it reflects the uncertainty resulting from the US-Israel war on Iran that has impacted oil flows amid the Strait of Hormuz blockade. Expectations fell to 3.5 (from 15.8), while the index measuring the current situation also fell (to -9.5 from -6.8).
- German factory orders plunged 11.1% mom in Jan (Dec: 6.5%), the first drop since Aug, partly due to a 39.4% plunge in fabricated metal products alongside sharp declines in machinery & equipment (-13.5%) and base metals (-15.1%). Both domestic and foreign orders tumbled (-16.2% and -7.1% respectively). Orders grew by 3.7% yoy in Jan (Dec: 11.7%).
- Industrial production in Germany unexpectedly fell in Jan, by 0.5% mom and 1.2% yoy (Dec: -1.0% mom and 0.4% yoy), highlighting the persistent weakness in manufacturing sector. Production fell across fabricated metal products, except machinery & equipment (-12.4% mom), pharmaceutical products (-11.9%) and computer, electronic & optical products (-6.8%) while energy production increased (10.3%).
- Exports from Germany fell by 2.3% mom in Jan (Dec: 4.0%) while imports contracted 5.9% (Dec: 1.3%), widening the trade surplus to EUR 21.2bn – the highest level since mid-2024. The largest export partners were the US (+11.7% mom to EUR 13.2bn), UK (-2.6% to EUR 6.8bn) and China (-13.2% to EUR 6.3bn).
- UK GDP was flat in Jan, as the services sector failed to grow and production contracted (-0.1%) while construction inched up (0.2%). This flat reading highlights persistent challenges from weak consumer spending, high borrowing costs and subdued business investment. In the three months to Jan, the economy ticked up 0.2% from the previous 3 months. Industrial production and manufacturing grew by 0.4% yoy and 1.3% respectively in Jan.
- UK like-for-like retail sales grew by 0.7% yoy in Feb (Jan: 2.3%), with consumer spending momentum weakened due to the wet weather. This was the weakest growth in 9 months. Food sales increased 2.9% (vs. 12-month average of 3.8%) while non-food sales fell 0.4%.
Asia Pacific:
- Inflation in China climbed to 1.3% yoy in Feb (Jan: 0.2%), the most since Jan 2024, reflecting higher prices of both food (1.7% from Jan’s -0.7%) and non-food (1.3% from 0.4%) during the Lunar New Year holidays. Core inflation, at 1.8% yoy, was the highest since Mar 2019. Producer price remained in deflation: the index fell 0.9% yoy in Feb, the least since Jul 2024, and at a slower pace than Jan (-1.4%). Prices for production materials fell at a slower pace (-0.7% from Jan’s -1.3%) as did consumer goods prices (-1.6% versus -1.7%).
- Exports from China surged by 21.8% yoy in Jan-Feb, thanks to the surging demand for electronics. Even though exports to the US fell more than 10%, that to EU and Asean countries jumped by 27.8% and 29.4% respectively. Imports accelerated by 19.8% in Jan-Feb (Dec: 5.7%), causing the trade surplus to clock in at USD 213.62bn (Dec: USD 114.11bn).
- New loans in China fell to CNY 900bn in Feb (Jan: 4.21trn), reflecting the typical seasonal slowdown following the start-of-year credit surge and given the reduced business activity and loan demand during the Lunar New Year holidays. M2 money supply continued to expand at a solid 9% yoy pace, indicating that liquidity conditions remain supportive. Outstanding yuan loans grew 6.0% (Jan: 6.1%), a record low, as household borrowing slowed while outstanding total social financing (TSF) – a broad measure of credit and liquidity – rose 8.2%.
- Japan’s GDP growth accelerated by a 1.3% annualised rate in Q4 (initial estimate: 0.2%); GDP was up 0.3% qoq (Q3: 0.1% qoq). The upticks were supported by private consumption (0.3% from initial estimate of 0.1%) and improved businesses capital expenditure (1.3% vs initial estimate of 0.2%). External demand was unchanged, but domestic demand contributed 0.3 percentage points from an initial estimate of zero contribution.
- Labour cash earnings in Japan grew by 3% yoy in Jan (Dec: 2.4%), the most in six months. Base pay increased by 3.0%, the most in 33 years; inflation-adjusted real wages grew by 1.4%, rising for the first time in 13 months, clocking the fastest rise since May 2021.
- Japan’s leading economic index ticked up to 112.4 in Jan (Dec: 110.3), the highest reading since Jul 2022, as per the flash estimate. Coincident index also improved, rising to 116.8 (from 114.3), the most since Feb 2025. Consumer sentiment rose to its highest level in 21 months.
- Machine tool orders in Japan jumped by 24.2% yoy in Feb (Jan: 25.3%), driven by a 29.8% surge in foreign orders. The sustained strength in orders highlights solid investment demand from manufacturing sectors both domestically (6.2% in Jan-Feb) and internationally (32% in Jan-Feb), particularly in industries linked to advanced manufacturing and technology.
- Current account surplus in Japan stood at JPY 941.6bn in Jan (Dec: JPY 7288bn; Jan 2025: deficit of JPY 344.6bn), reflecting seasonal factors and shifts in investment income flows. Despite the decline in the overall surplus, trade surplus widened to JPY 3145bn (Dec: JPY 2697.1bn) thanks to a jump in exports to China; shipments of semiconductors & other electronic devices and nonferrous metals surged 39.2% mom and 36.0%. The travel surplus shrank to JPY 590.1bn (Jan 2025: JPY 658.6bn), as foreign visitors to Japan declined.
- Retail inflation in India grew to 3.21% in Feb (Jan: 2.74%), though remaining comfortably within the central bank’s target range (2% to 6%), driven by higher prices of food (3.47%), personal care products (19.6%) and education (3.3%). With the shortage of cooking fuel due to the war in Iran (causing some restaurants & eateries to shutdown), Indian firms have raised prices of cooking gas for the first time in about a year: this will be reflected in the next reading.
- South Korea’s GDP contracted in Q4, falling by 0.2% qoq, it was at a milder pace than the previous estimate (-0.3%) but much lower than Q3’s 1.3% gain. In yoy terms, GDP grew by 1.6% (from previous estimate of 1.5% and Q3’s 1. 8%). Data point to a fragile recovery, with domestic demand facing headwinds from a weak won, household debt and slow investment.
Media Review:
Echoes of 2022? Markets look back to Russia play book for Middle East conflict
https://www.reuters.com/world/europe/global-markets-iran-2022-graphic-2026-03-13/
The Iran war may be about to escalate
https://www.economist.com/middle-east-and-africa/2026/03/15/the-iran-war-may-be-about-to-escalate
Gulf states’ SWF strategies amid Iran’s attacks
https://www.reuters.com/world/middle-east/some-gulf-states-reviewing-sovereign-investments-offset-economic-shock-iran-war-2026-03-11/ https://www.zawya.com/en/business/investment/uae-says-no-change-to-investment-plans-as-gulf-states-review-swf-strategies-mva0i03c
Powered by:
![]()