Progress of Economic Diversification in the Middle East & GCC: Weekly Insights 6 Feb 2026
Progress of Economic Diversification in the Middle East & GCC: Weekly Insights 6 Feb 2026
1. Measuring Economic Diversification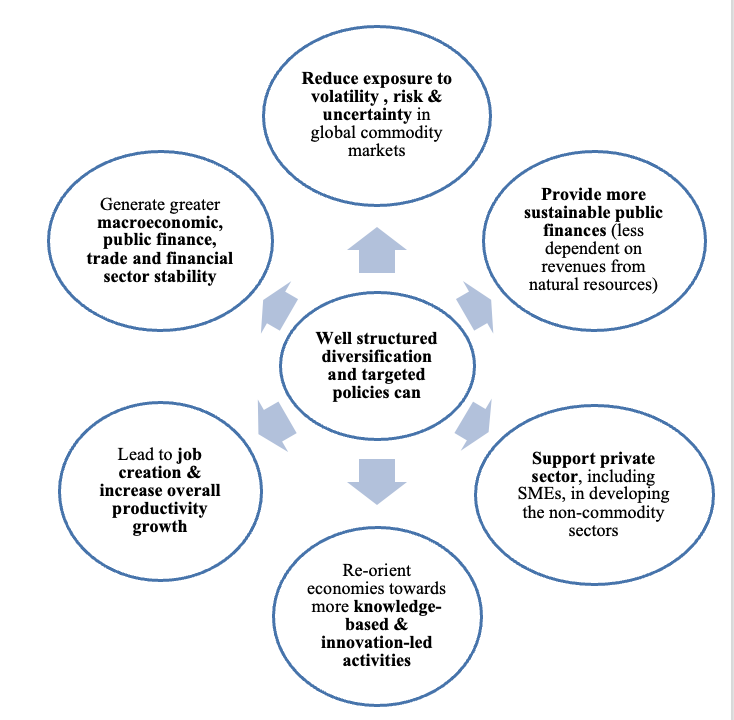
- Diversification is key to reducing macroeconomic risks, avoid ‘natural resource curse’, achieve a balanced economy, sustained economic growth, trade and development and job creation.
- Diversification visions and strategies exist. But there were NO harmonized, comparative, comprehensive, quantitative indicators to measure their progress and guide strategy and policy
- The Global Economic Diversification Index (EDI) fills this gap, by creating an index based solely on publicly available, quantitative measures with no qualitative/perceptions indicators. The overall Global EDI is composed of three sub-indices tracking
- Output diversification. As commodity exporters diversify, lower their dependence on resource rents and potentially score a higher score on the EDI
- Trade diversification. Greater trade diversifications reduces impact of trade-related & external shocks, increases economic linkages and product complexity
- Government revenue diversification. For non-diversified nations, when price of the commodity falls, there is a significant decline in government revenue, public spending, current account balance and international reserves: more volatility.
- The Global EDI 2026 tracks the performance of 117 nations (including major commodity exporters, not limited to just oil) over the period 2000-2024, across 25 indicators (including three digital indicators).
2. Economic Diversification Index by region
- North America, Western Europe and East Asia Pacific countries top EDI scores over the years. Other than Sub-Saharan Africa (which lags all other
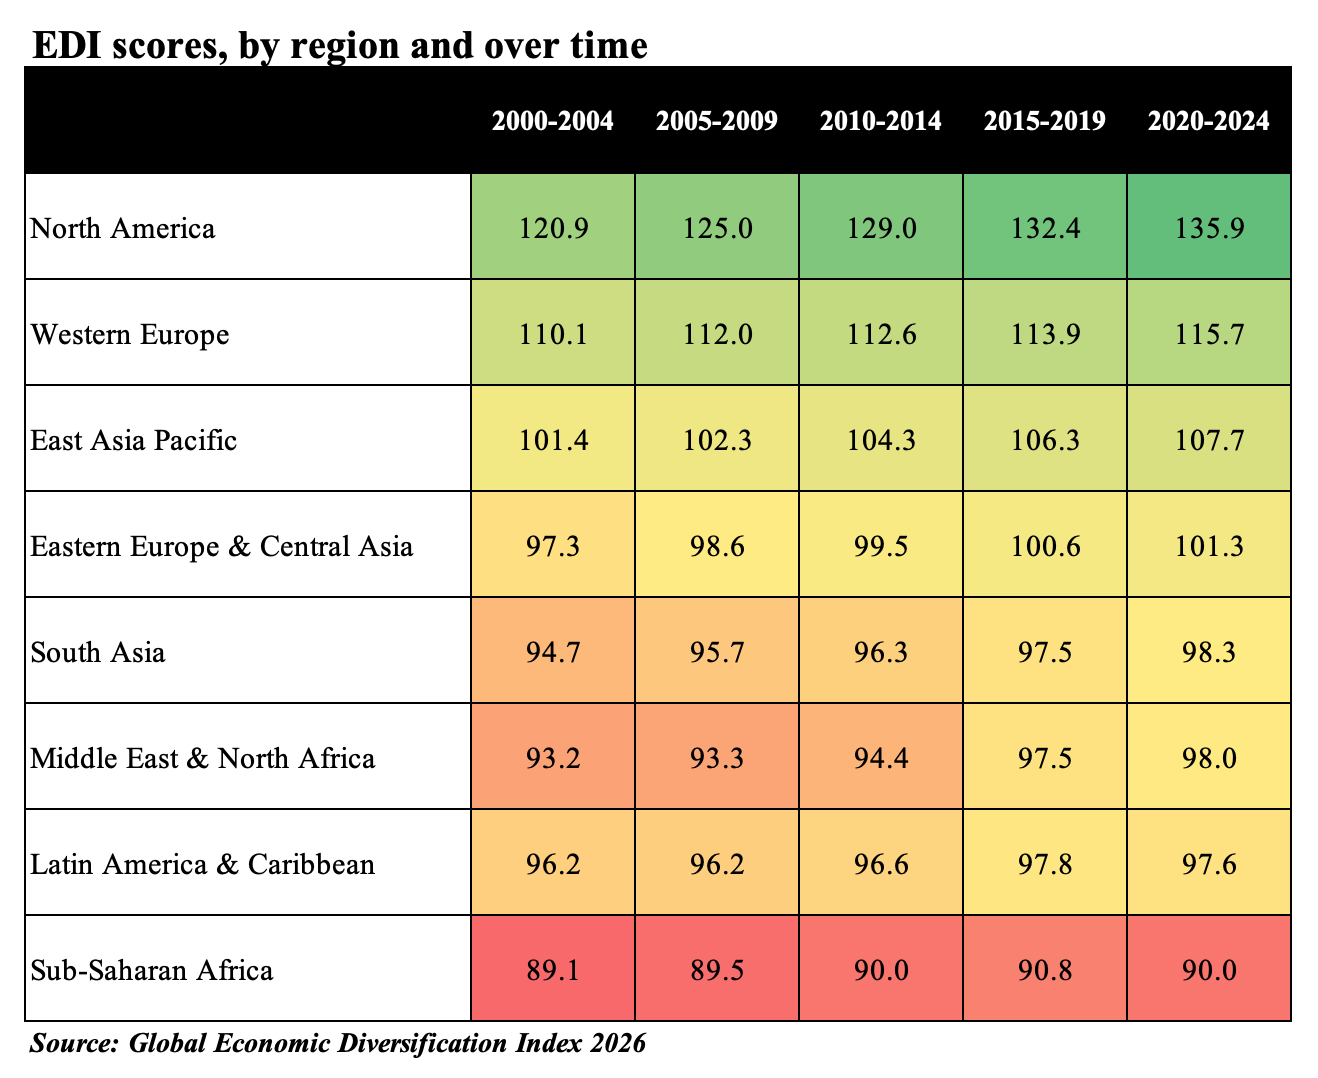 regions), Latam is the only regional group that has not “recovered” to its pre-Covid EDI score. A further breakdown by sub-indices shows that Latam is dragged down by performance of its trade sub-index. Even though structural reforms and diversification efforts undertaken by the GCC impacted MENA’s regional scores positively, it still lags five other regional groups.
 - US, China and Germany retain the top 3 ranks in the EDI for 2024, with the top 10 nations having less than a 10-point difference in scores (implying the strength of diversification). Twenty-five of the top 30 nations are high income, alongside four upper-middle income (China, Mexico, Turkey and Thailand) and one lower middle-income nation (India, ranked 20th, driven by its services export boom). Lowest EDI ranked countries are all highly commodity or natural resource-dependent, many either lower-middle or low-income nations, and many also landlocked. Among the “mid-diversifiers” e. countries ranked 51 to 70, the performance of Moldova, Indonesia, Armenia and Honduras stand out (when comparing 2024 vs 2000).
3. Economic Diversification Index in the MENA region
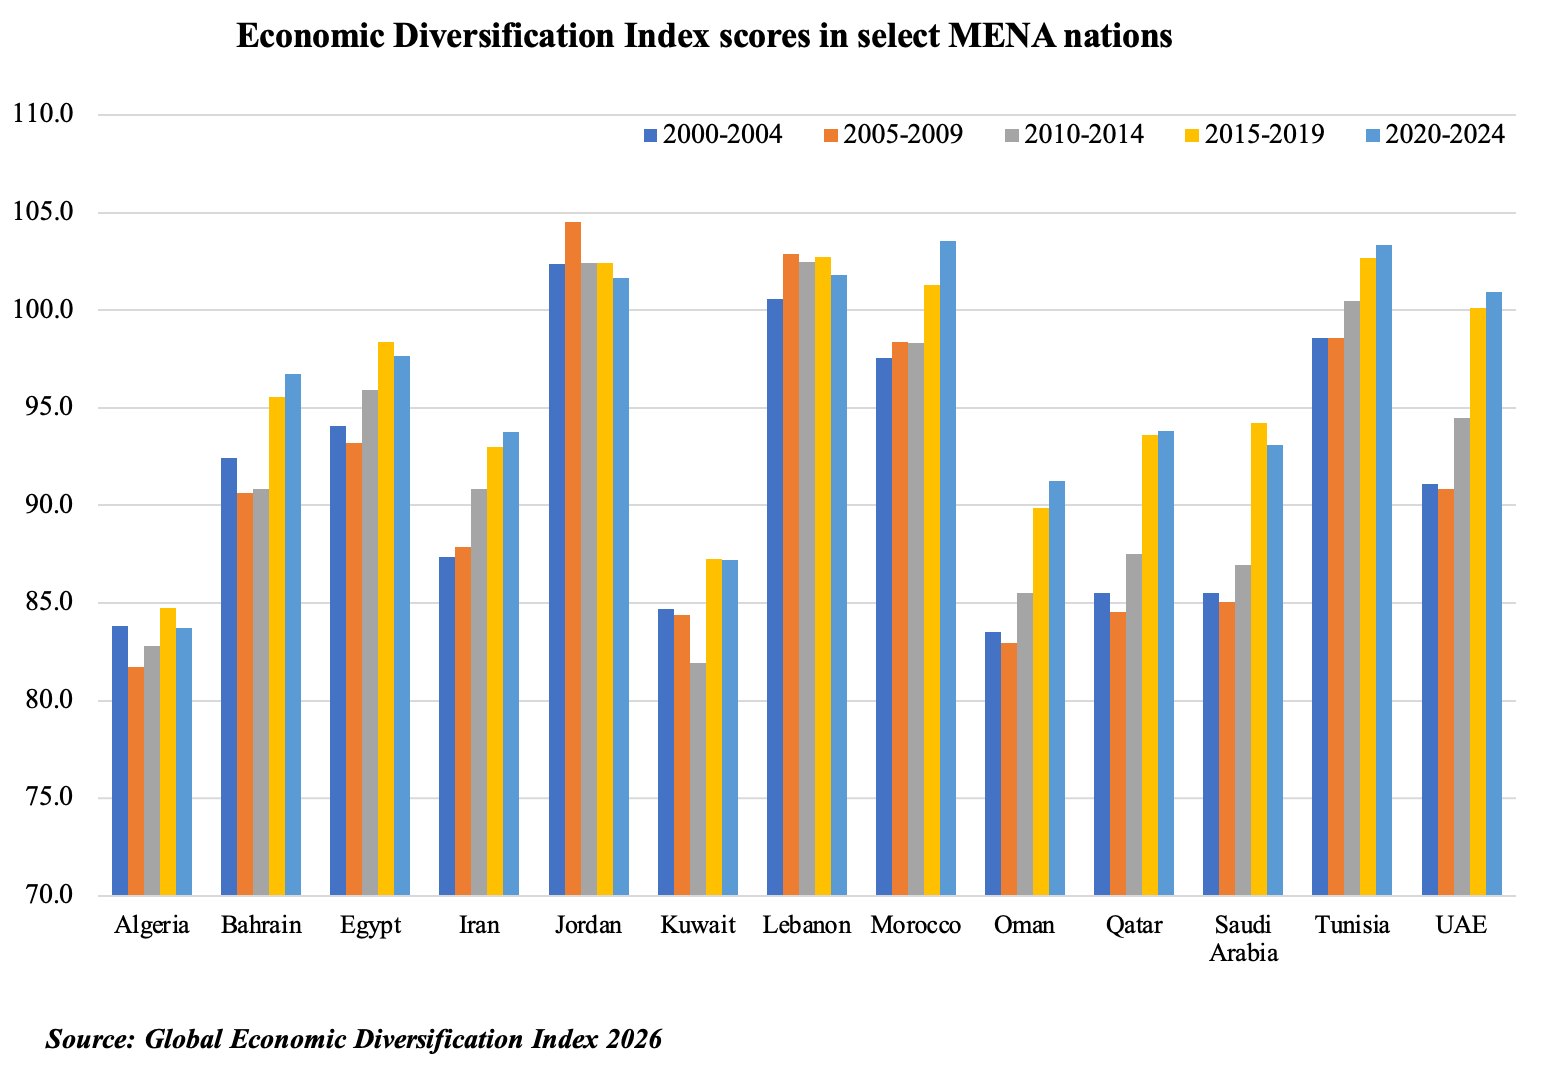
- MENA saw an improvement in the 2015-2019 years, given accelerated diversification plans of many oil-exporting nations.
- Trade diversification sub-index posted a steady improvement due to a combination of reduced dependence on fuel exports, reduced exports concentration and a change in the composition of exports. On the other hand, the revenue diversification sub-index showed only a marginal increase given lack of tax structures in many oil exporting nations.
- There is a large variation in performance within the MENA region group, with oil exporters having the lowest scores (though individual country-specific performance has varied over time). Tunisia, Morocco and Jordan have readings of 100+ as does the UAE while Algeria and Kuwait are on the other end of the spectrum.
4. Wide Disparities within Regional Economic Diversification scores
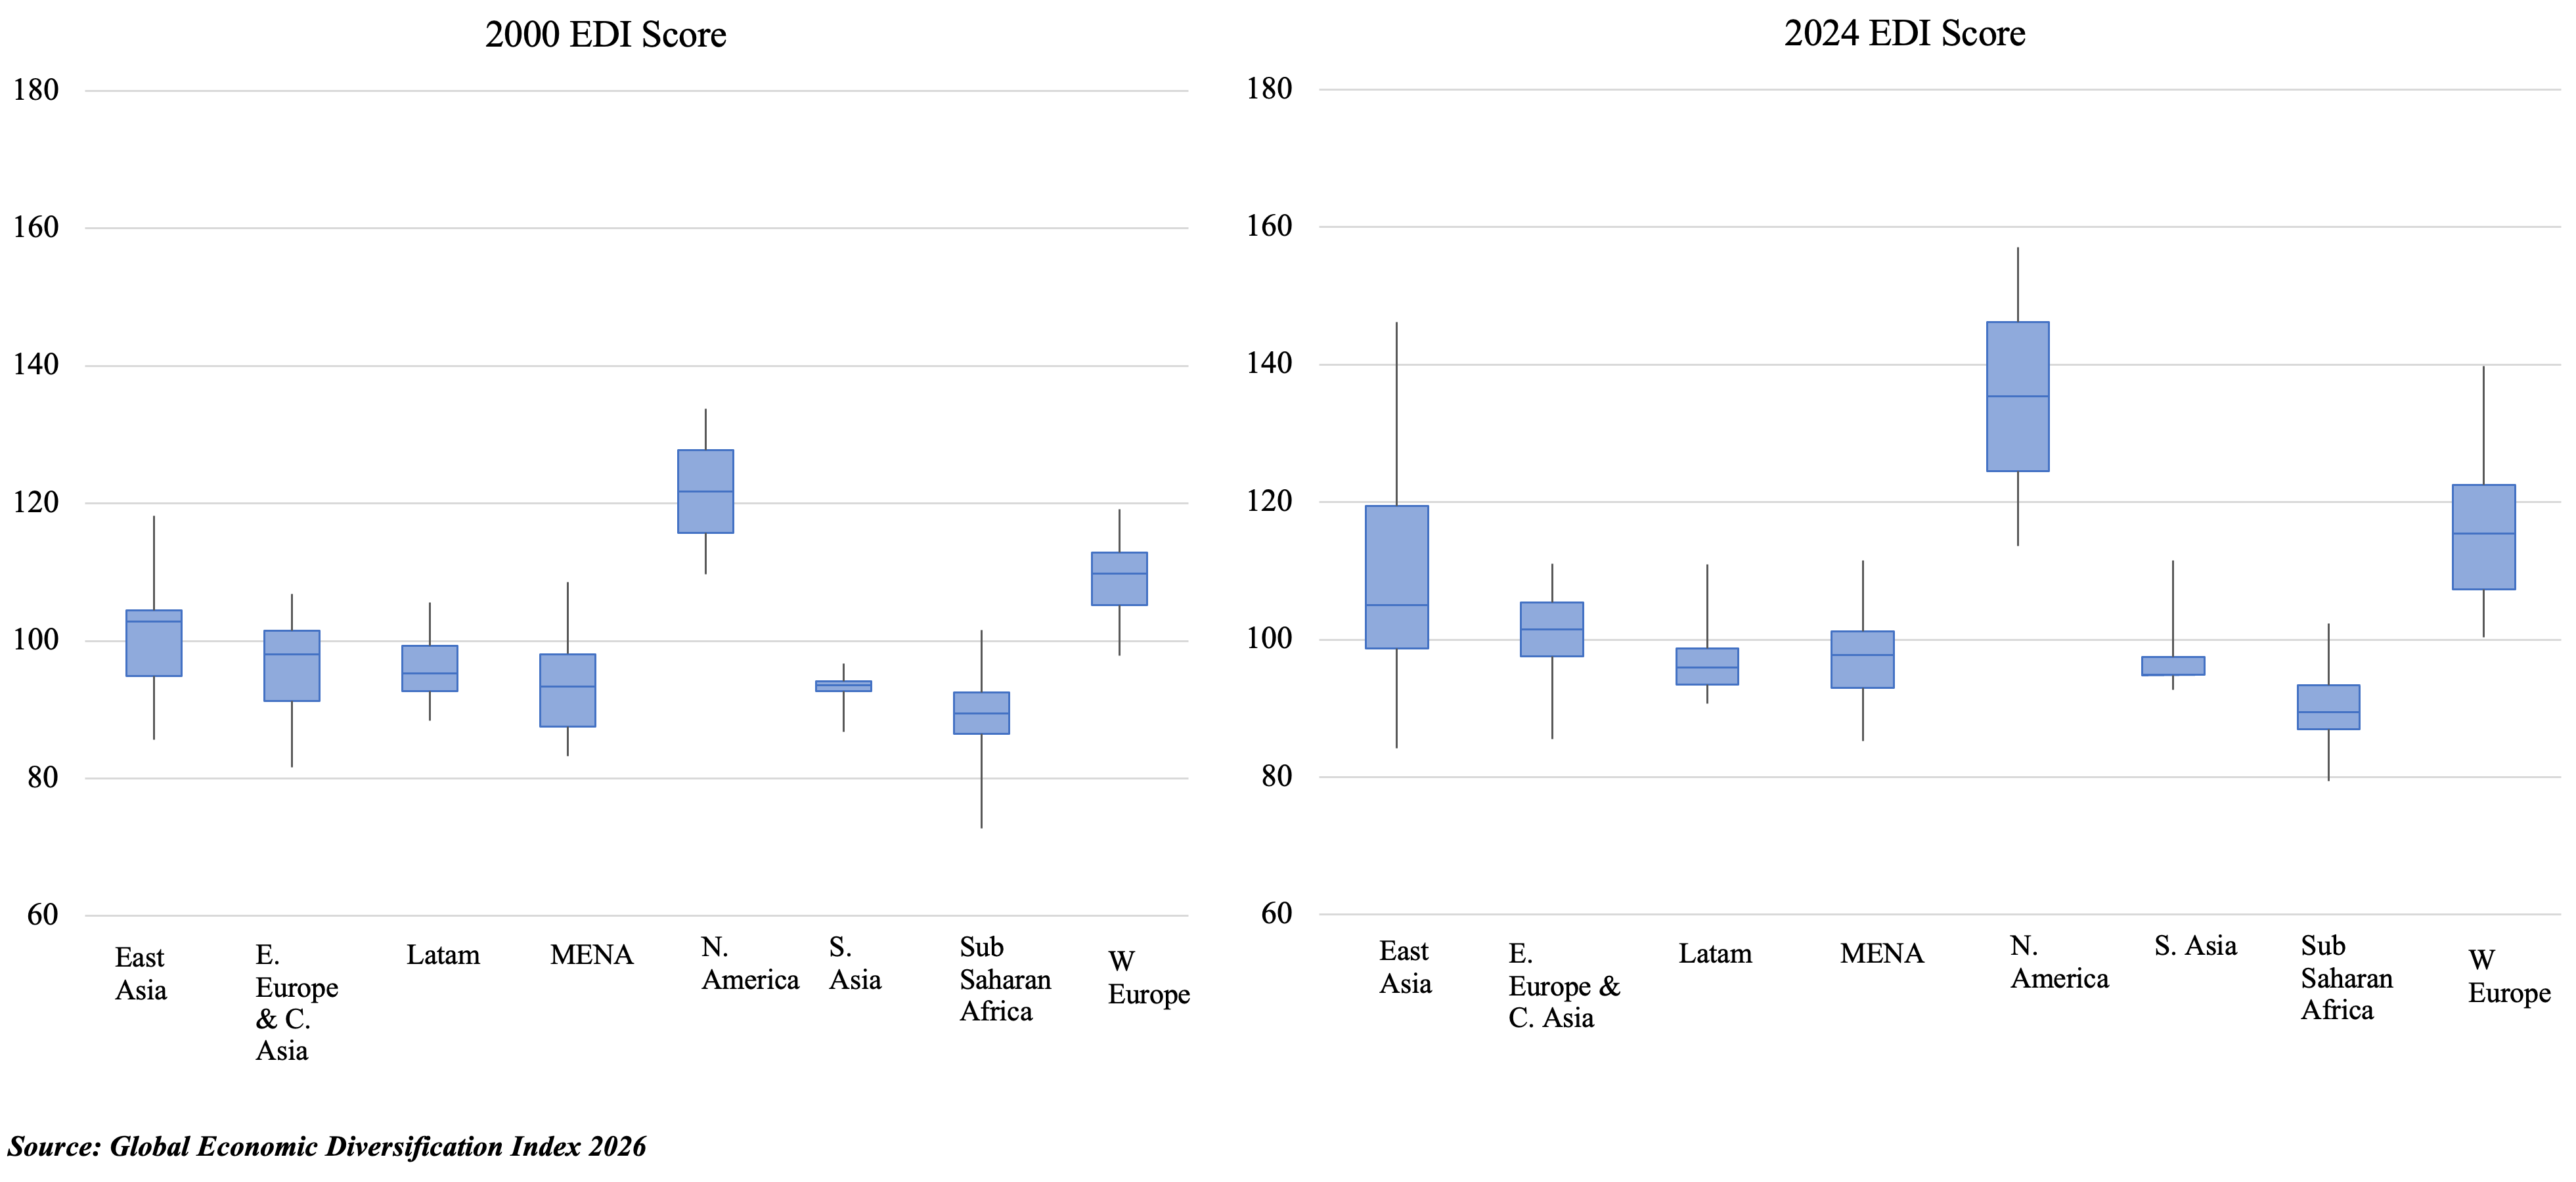
- Across all regions, the median score is the lowest in Sub-Saharan Africa for both 2000 and 2024, and the highest in North America. When comparing these years, all regions except Sub-Saharan Africa posted an increase in their median scores (represented by the horizontal line within each box). In 2024, the gap between the maximum and minimum score was the highest in East Asia (China was among the top ranked, while Mongolia’s score worsened compared to 2000). This gap has narrowed only in Sub-Saharan Africa, but more to do with a “levelling up” at the bottom rather than an improvement among the top countries.
- By comparing the inter-quartile range (height of the blue box), least variability is seen in South Asia in 2000 and the most in the MENA region (with variance likely driven by the dichotomy within the region between the resource-heavy states (e.g. GCC) and other oil importing/ labour-exporting nations). While the range narrowed in half of the eight regions (MENA by the most), signaling some convergence, it widened in East Asia & Pacific; also, distribution for East Asia is skewed to the right in 2023 (i.e. higher EDI scores are more spread out).
- Furthermore, the lower-income and commodity producing nations in the regional group score lower than the median value (e.g. Mongolia in East Asia & Pacific, Algeria in MENA or Bolivia in Latin America).
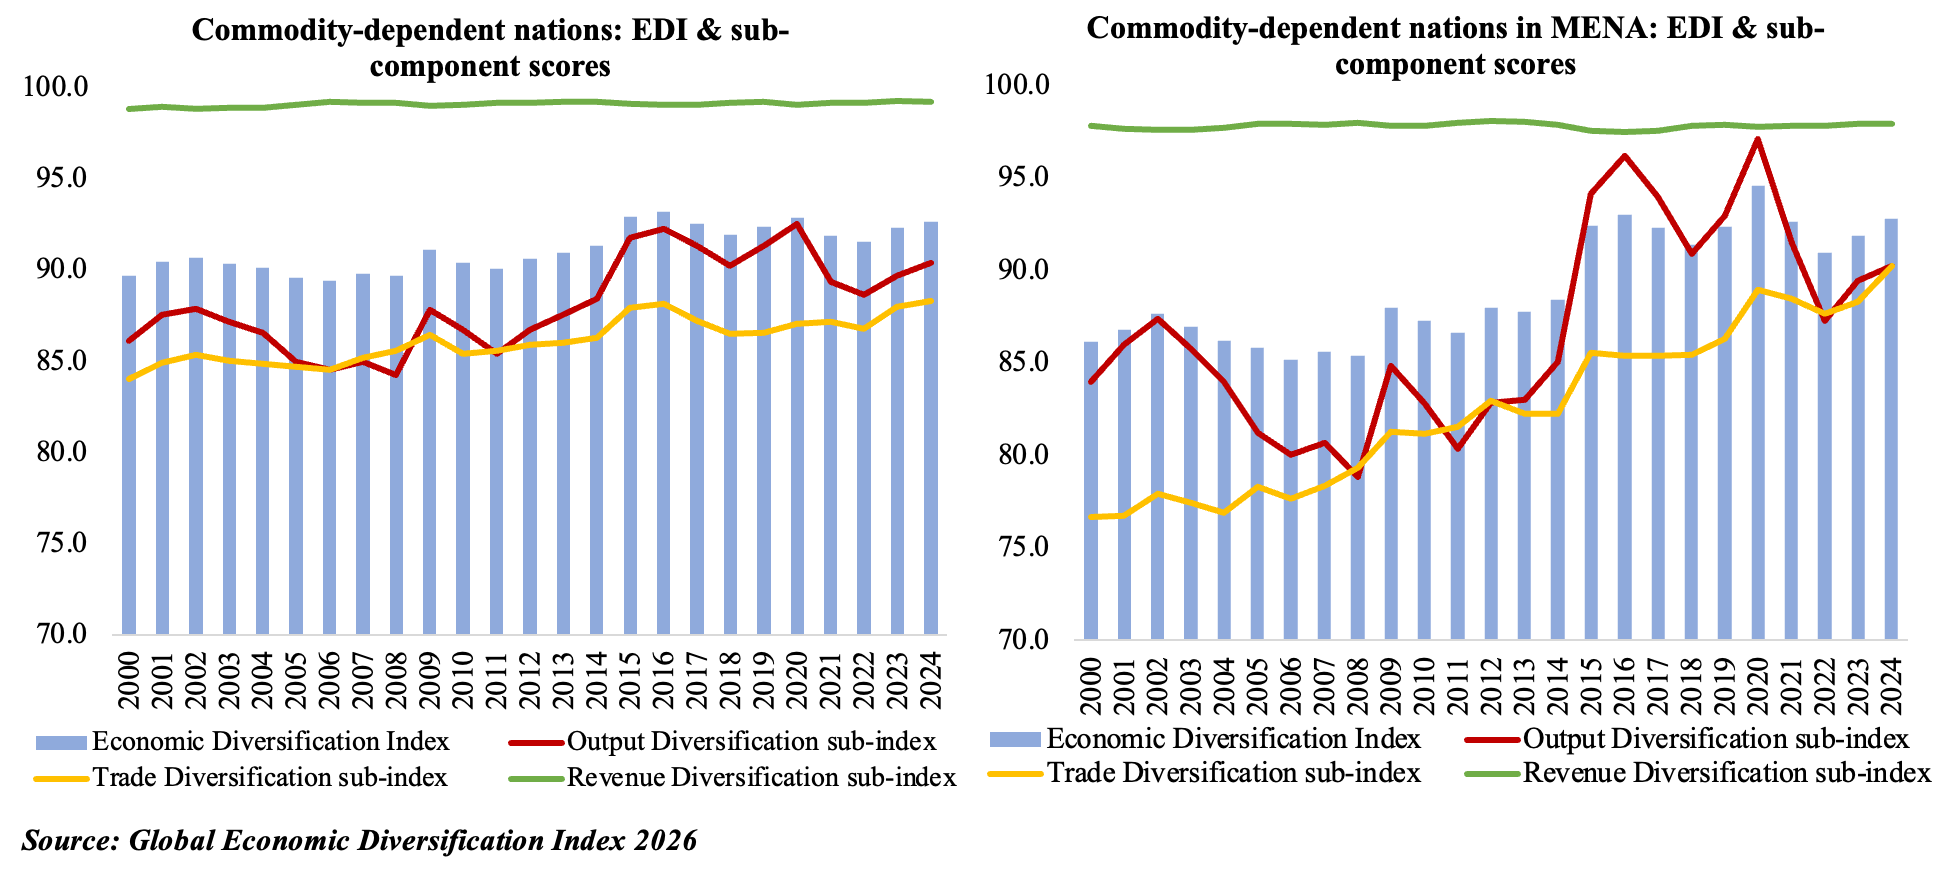
5. Commodity dependent nations & diversification trends over time
- Forty-two countries out of the 117 countries covered in this EDI report are commodity exporters, and within that, 45% are reliant on fuels. The list is dominated by high and upper-middle income nations in equal number, and among the high-income nations fuel-exporting MENA dominate. The low-income nations are largely exporters of minerals, ores and metals in addition to agricultural goods (such as Uganda and Ethiopia). Sub-Saharan African nations account for around one-third of the total, followed by Latin America and the Middle East (the latter two together accounting for over 40% of the total).
- Including all commodity producers’, there has been an increase in their overall score (from 90.3 in 2000-04 to 92.6 and 92.3 in the five years pre- and post-pandemic ). Gains were recorded in output and trade diversification sub-indices (volatile in the former), while revenue diversification has dragged down overall diversification gains (more so in the MENA region, where a few nations still lack tax structures).
- Mexico and Malaysia are relatively more diversified and ranked higher than others; UAE is up more than 45 places in 2024 compared to 2000 while Qatar climbed 24; both Saudi Arabia and Oman rose 17 ranks during the duration. The trapped or worse off countries are some parts of Latin America and Sub-Saharan Africa where structural transformation has stalled. Chile dropped from a rank of 57 to 75, as the economy re-concentrated on mining & extraction as a result of the “green rush”.
- MENA region commodity exporters, shows a substantial increase in average EDI scores from 86.8 in 2000-04 to 92.6 in 2020-24, largely due to the steady expansion in the trade sub-index (up more than 10 points in the initial period versus 2020-24).
6. GCC’s Economic Diversification performance
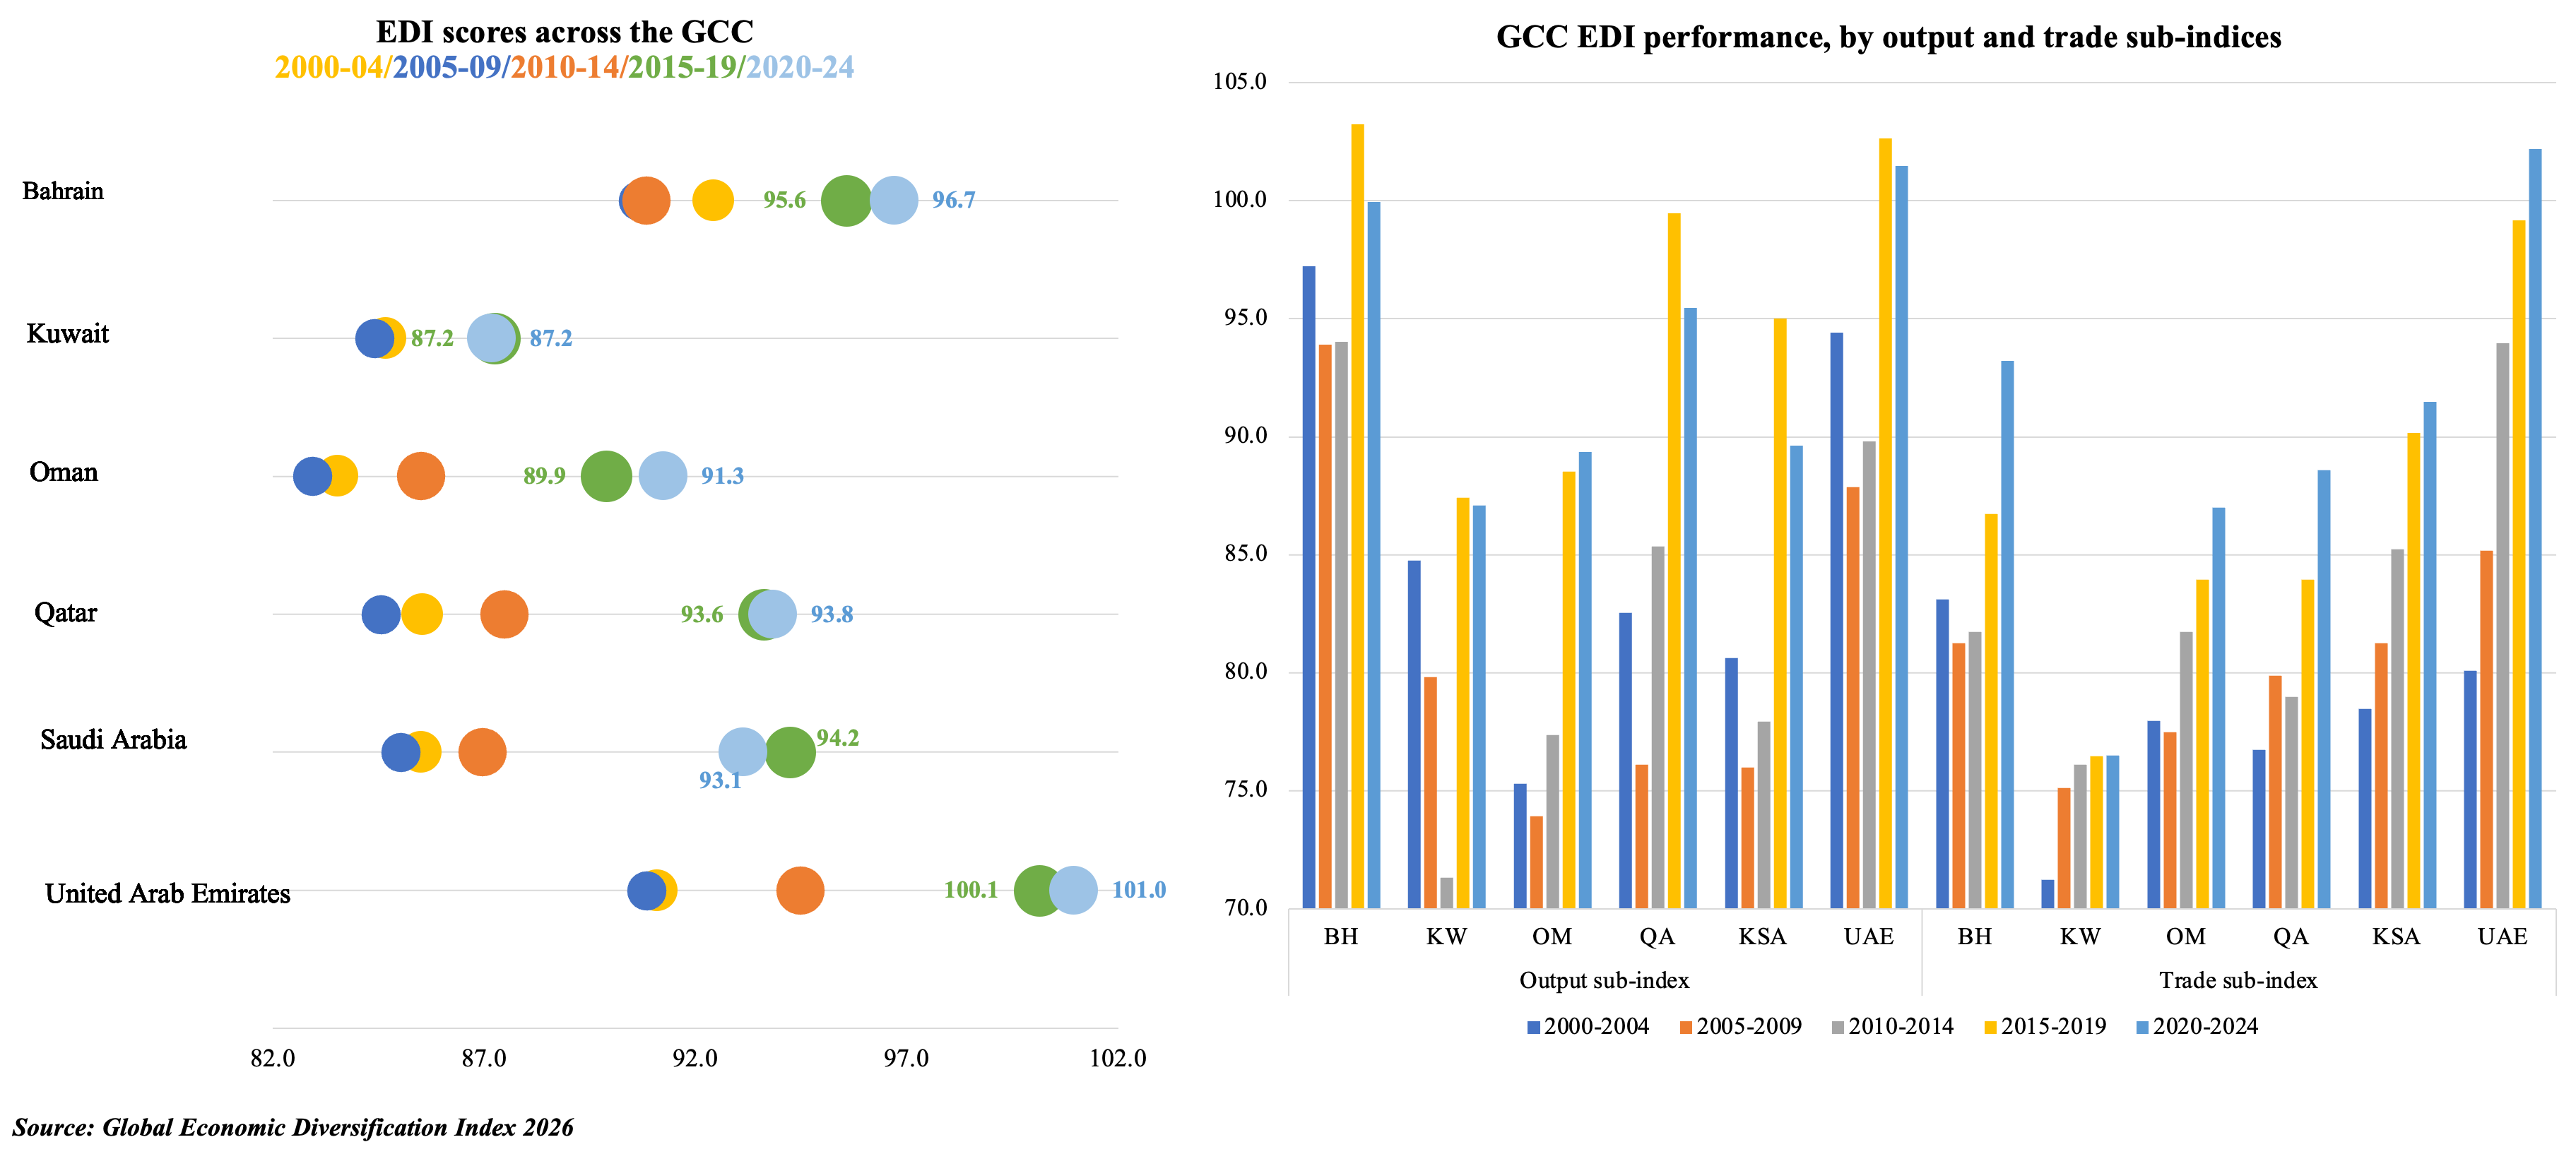
- Bahrain & UAE continue to be frontrunners of economic diversification in the GCC, with UAE outperforming in the trade sub-index (supported by recent bilateral trade agreements & non-oil exports push). In the output sub-index, Oman is the only GCC country that has posted a higher score in 2020-24 vs its pre-pandemic reading (partly given the surge in medium & high-tech manufacturing data).
- Saudi Arabia’s slight decline below pre-pandemic levels can be traced to its output sub-index, where the decline is evident in services as share of GDP (46.5% in 2020-24 vs 50.3% in 2015-19), share of medium and high-tech manufacturing (less than 30% vs 36.2% in 2015-19) and manufacturing value added per capita (about USD 2700+ from close to USD 3000).
- Kuwait remains the regional laggard, displaying the highest structural rigidity. Its diversification metrics have stagnated, showing the least improvement between the initial (2000-04) and final (2020-24) reference periods.
- In 2024, the GCC demonstrated remarkable macroeconomic resilience, despite the headwinds of OPEC+ production cuts. A robust non-hydrocarbon expansion was supported by the GCC’s robust domestic demand (supported by a strong project pipeline and implementation) and strong services sector performance. This effectively insulated regional economies from geopolitical spillovers (Red Sea disruptions) and trade fragmentation (US tariffs). Kuwait and Saudi Arabia clocked in an increase in non-hydrocarbon revenue, “primarily reflecting non-hydrocarbon tax base expansions and revenue collection efficiency improvements”, according to the IMF.
7. Trade Concentration is a Structural Barrier to Diversification & Resilience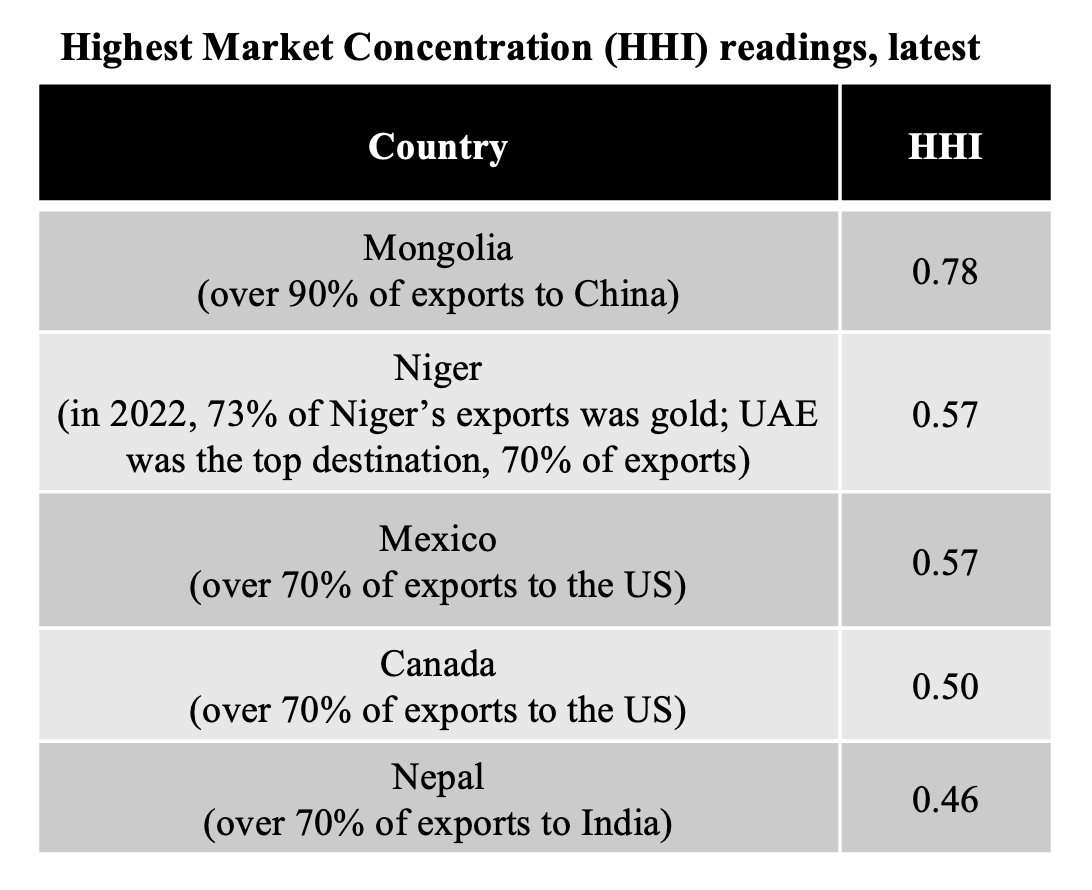
- In the current geopolitical environment characterized by intensifying economic fragmentation and the weaponisation of trade, it is in the best interests of commodity dependent nations to diversify its export base, exports and trade partners.
- One of the EDI indicators, the Herfindahl-Hirschman index (HHI) measures the dispersion of trade value across an exporter’s partners. A country with trade (export or import) that is concentrated in a very few markets will have an index value close to 1. Similarly, a country with a perfectly diversified trade portfolio will have an index close to zero.
- With the global energy transition came newer forms of concentration e. soaring demand for critical minerals (lithium, cobalt) have countries focus on increasing mining investments. While profitable in the short term, this dependence reinforces the “resource trap”. Economies have re-oriented policies around the extraction of such minerals without developing domestic processing capacity (which would have added value).
- Addressing market concentration demands a fundamental restructuring of trade patterns.
- The most effective way is to alter the structure of exports & move up the value chain i.e. quality upgrading within already produced goods and services. For example, instead of exporting raw cocoa or crude oil, policies should incentivize domestic processing.
- Move from single-market dependence to a diversified portfolio of trading partners. Greater regional integration also reduces partner concentration.
- Empirical studies also show: most countries which are less likely to diversify away from their comparative advantage are natural resource dependent; better institutions enable countries to diversify away from current comparative advantage; that in addition to diversifying the production structure, better access to infrastructure and services are also necessary for export diversification.
- Bottomline: Finding new commodities to export and/or increasing export complexity have been extensively discussed in economic literature. The 2024-25 period is not just about what countries trade, but also who they trade with. Absent this structural transformation, commodity exporters risk remaining trapped as price-takers.
8. Post-pandemic global economy is contending with a lasting structural change: accelerated adoption of digital technologies (captured via EDI+)
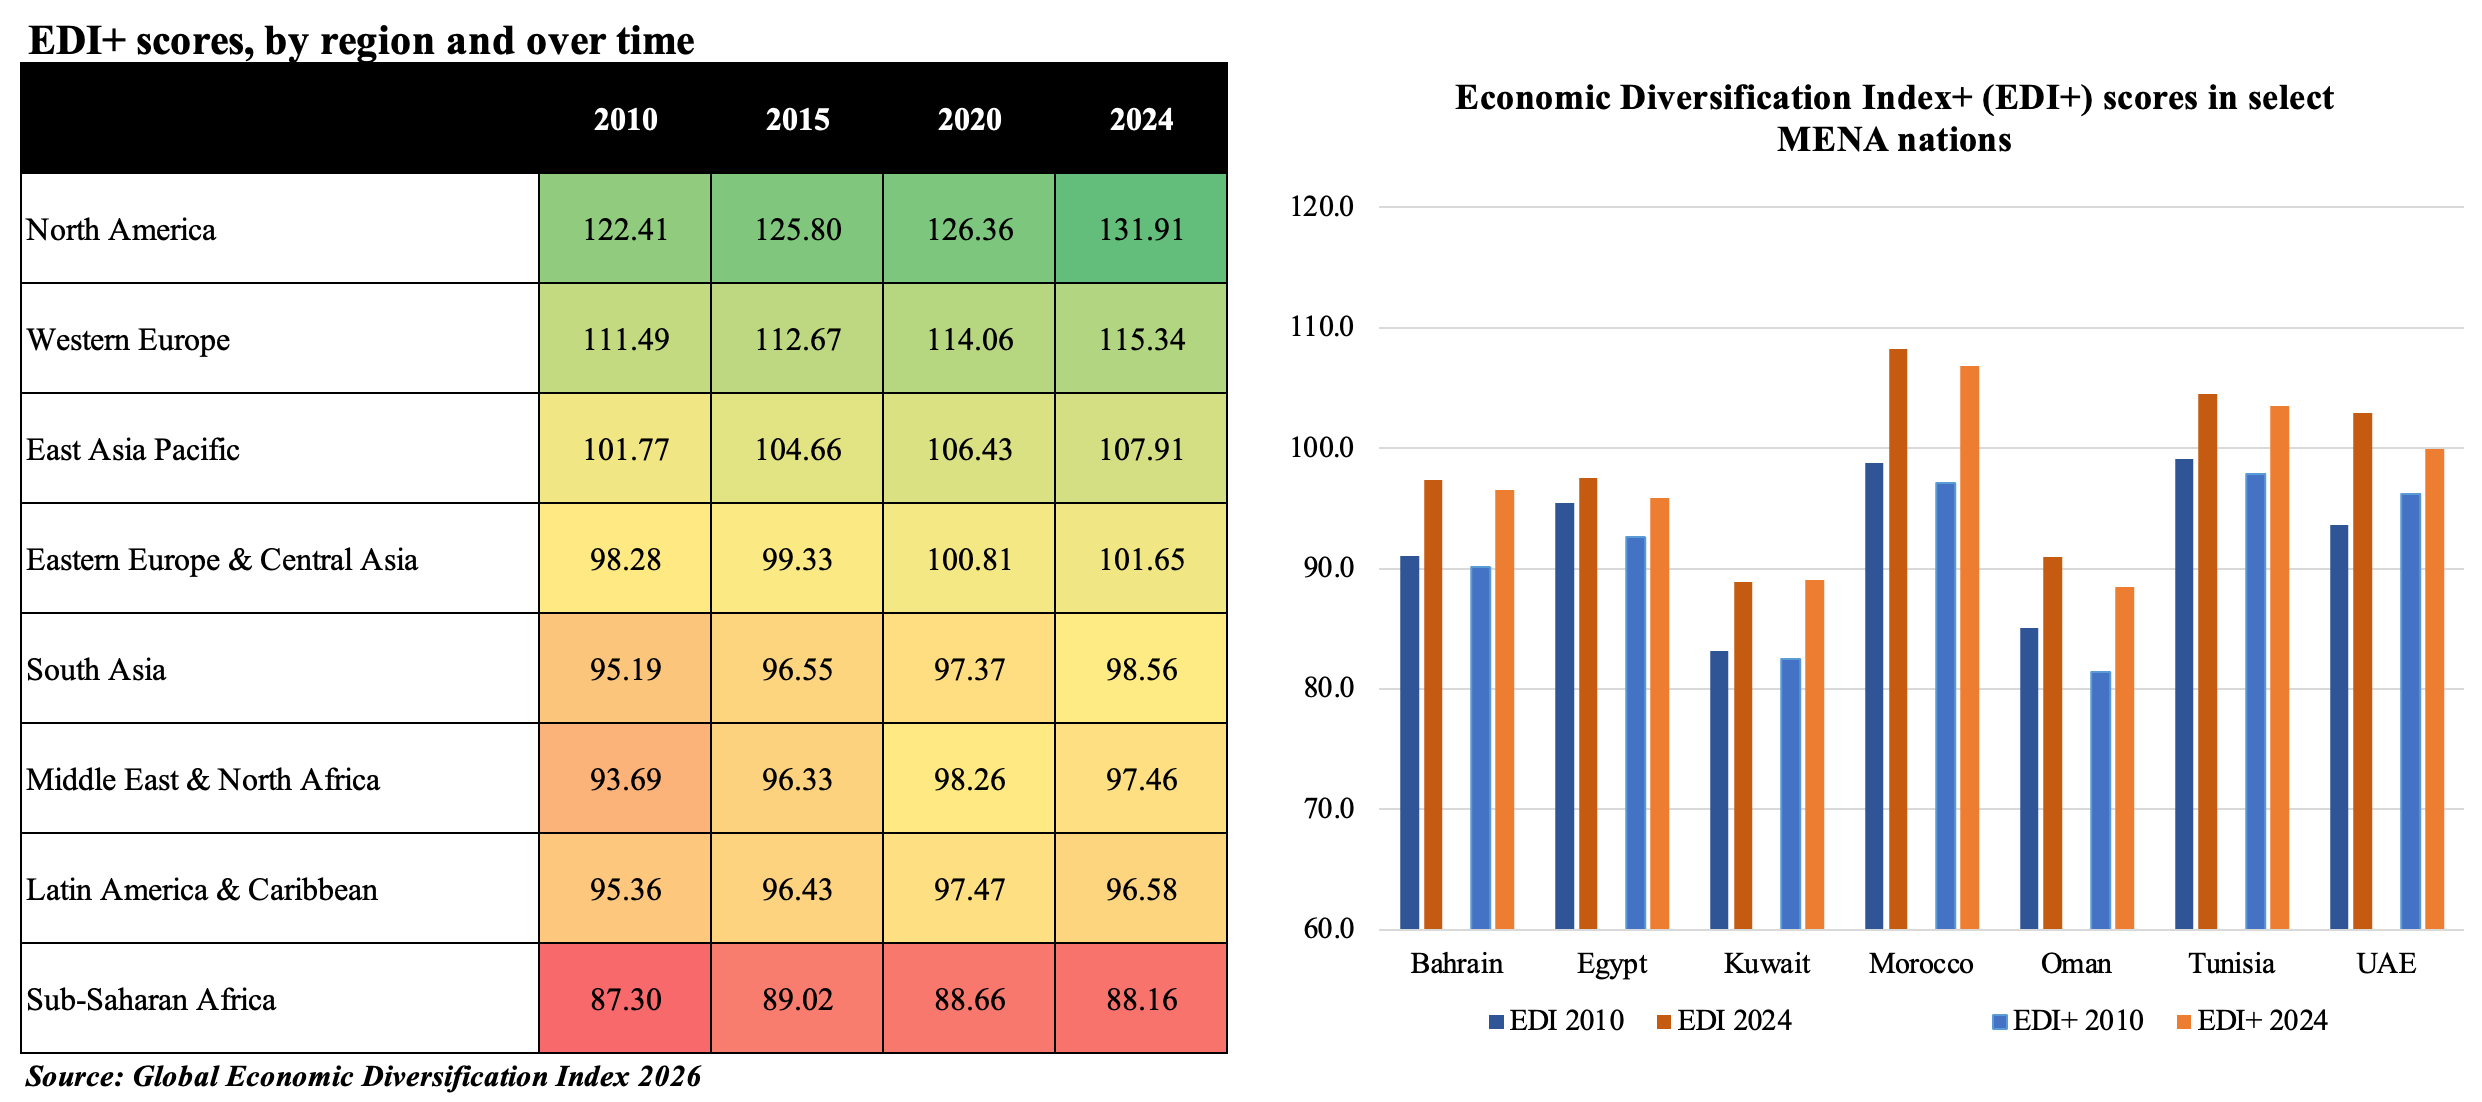
- Including 3 trade indicators that capture the growth of digitalization in trade activities – (a) Digitally deliverable services trade; (b) ICT goods exports as percentage of the economy’s total merchandise exports and (c) International trade in ICT services as a % of total trade in services (exports flow) – a “Trade+” & augmented EDI named “EDI+” is created.
- Regional EDI+ scores broadly mirror overall EDI scores. However, there is a narrowing of regional inequality when digital trade is included. Many developing nations are diversifying into the digital space and can catch up; but this is contingent on structural enablers such as the resilience of digital infrastructure, regulatory alignment and the continuous upskilling of the workforce.
- MENA, Latam and Sub-Saharan Africa regions posted a drop in overall score in 2024 versus 2020. While the top four ranked countries are the same in both the trade and trade+ sub-indices, of the bottom 20-ranked nations in the original trade sub-index, seven are worse-off when including digital indicators. This indicates that if adoption is delayed, existing digital divides only worsen performance (unless specific reforms are undertaken). Having the right infrastructure (both hard & soft) is critical to developing the digital economy
- Bottomline: commodity producers can strongly improve their rankings by investment in and adoption of new digital technology & services.
9. What next?
Economic diversification is a marathon, requiring structural change and reforms, not a sprint.
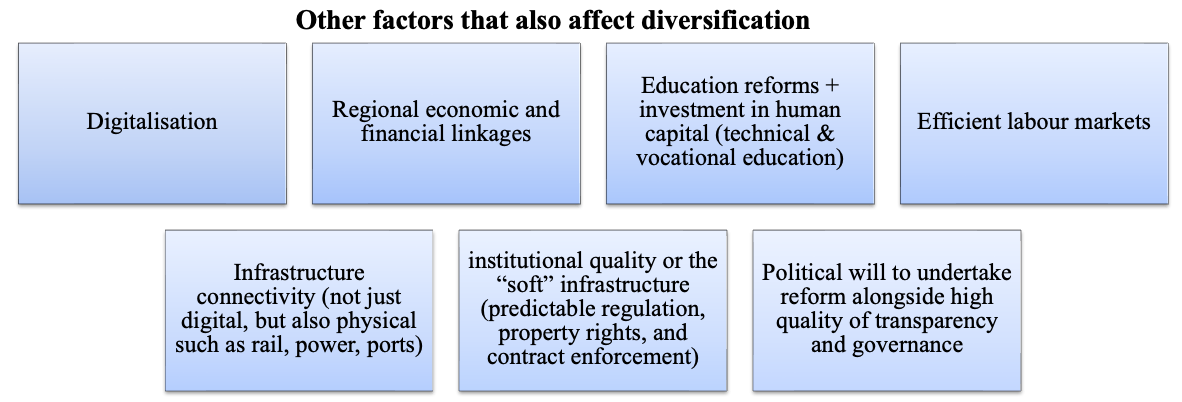
What are the non-digital pillars that commodity dependent countries can prioritise to achieve greater diversification in a world adjusting to a decarbonizing, fragmented global order?
- One, green transition & industrial strategy. Energy transition plans have increased the demand for critical minerals; but countries that export these minerals should emphasise value creation domestically. Commodity dependent countries should aim to become the drivers of green transition e.g., leveraging renewable energy endowments to power green processing. A word of caution: AI investments may backfire with critical materials producers becoming more concentrated and less diversified: copper, gold, silver, lithium etc
- Two, regional integration is a solution at times when “friend-shoring” and trade wars are fracturing global supply chains into blocs. Countries should ensure that diversification of partners is as embedded into policy as diversification of products.
- Three, fiscal sovereignty & a new financial architecture. This can be done by either (a) expanding the non-resource tax base; (b) sovereign wealth funds could evolve into active development funds act as strategic investors, de-risking domestic projects in infrastructure and new industries; (c) developing deep local currency bond markets will allow governments & firms to borrow in their own currency
Bottomline: There is no one-size fits all set of policies for diversification; need to build multiple growth engines.
Powered by:
![]()