Dubai Tourism Boom, Trade & Fiscal Deficits in Oman & GCC’s Strong Treasury Appetite, Weekly Insights 21 Nov 2025
Dubai tourism. Oman’s fiscal and trade deficit. Inflation in Qatar & Oman. GCC Treasury holdings.
Download a PDF copy of this week’s insight piece here.
Dubai Tourism Boom, Trade & Fiscal Deficits in Oman & GCC’s Strong Treasury Appetite, Weekly Insights 21 Nov 2025
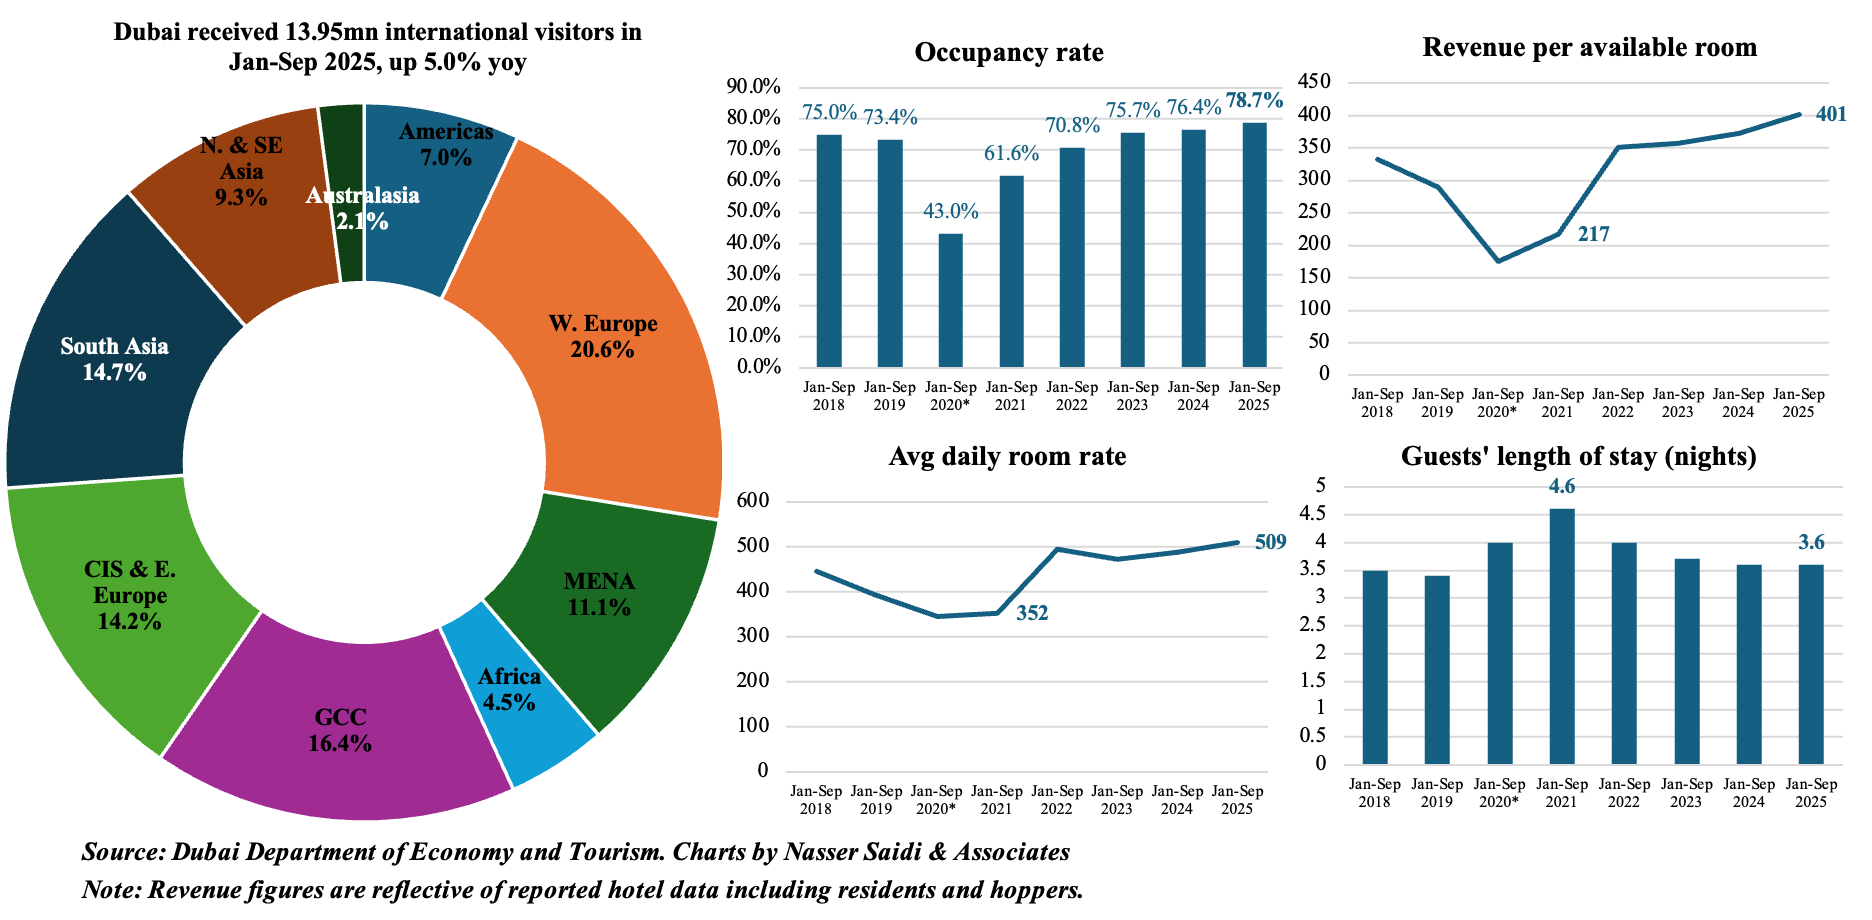
1. International visitors to Dubai rose 5.0% yoy to 13.95mn till end-Q3 2025
- Visitors into Dubai grew by 5.0% yoy to 13.95mn in Jan-Sep 2025, with its diversified source markets a key highlight. While visitors from the GCC & MENA region totaled 3.8mn visitors (or 27.5% of total), Western Europe had the largest share (20.6%). Though South Asia accounted for 14.7% of visitors, it posted a 9.6% drop to 2.1mn. Visitors from CIS & Eastern Europe grew by 8.9% to 1.99mn.
- At end-Sep, there were 152,342 hotel rooms (0.19% yoy) across 819 establishments (-0.85% yoy) in Dubai. Hotel occupancy rate stood at 78.7% & revenue per available room was AED 401 (7.8% yoy) remains the highest recorded in Jan-Sep in past years. Average daily room rates were AED 509 (4.5% yoy) & length of stay held steady at 3.6 nights. Rising ADR and RevPAR point to increasing willingness to pay.
- Q4 is always a strong quarter given the winter travel season and UAE as a major destination for MICE events (e.g. ADFW) and leisure events (e.g. Abu Dhabi F1 race). The WTTC expects UAE to receive 27.6mn international visitors in 2025, up 4.6% yoy, with inbound travellers spending USD 62.2bn (2024: USD 59.2bn). Infrastructure improvements (e.g. upcoming Etihad Rail) and plans to increase airline fleet (an order for 65 additional Boeing 777-9 aircraft was placed by Emirates this week) underscore the ambition to support both tourism and general connectivity. The upcoming GCC unified tourist visa will also enhance accessibility & lead to a further rise in visitors.
2. Oman posts a trade deficit of OMR 53mn in Sep 2025, the first since Dec 2015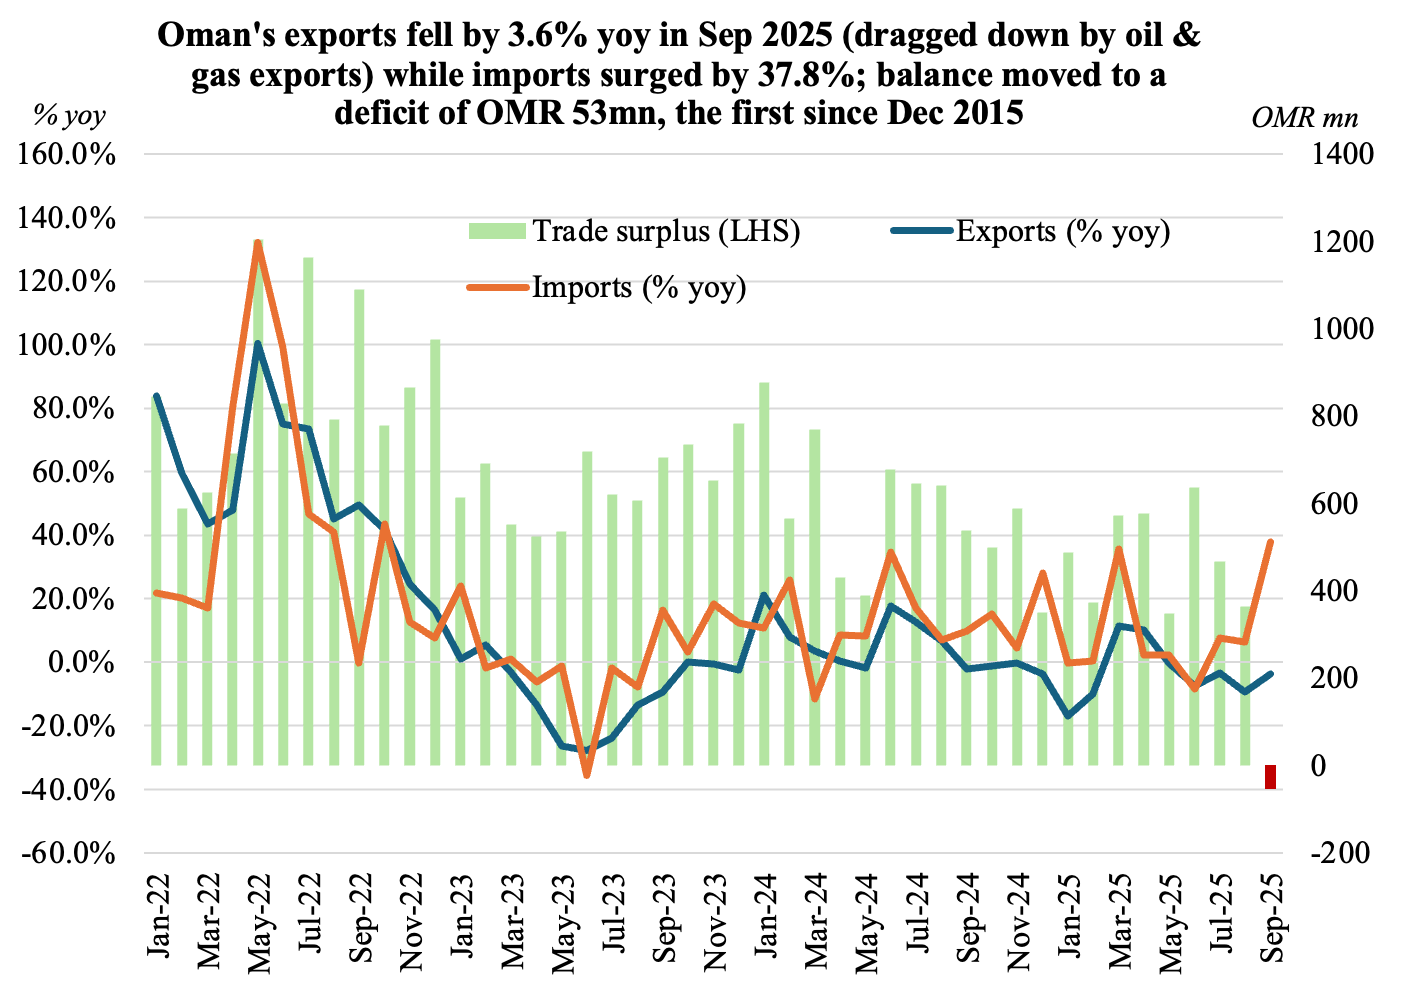
- Oman’s exports fell by 3.6% yoy (to OMR 1.86bn) in Sep while imports surged 37.8% (to OMR 1.91mn), resulting in a deficit of OMR 53mn. This was the first monthly deficit since Dec 2015. While the top five import products recorded only minor monthly gains, the others put together more than a doubled in value (to OMR 869mn in Sep from OMR 408mn in Aug).
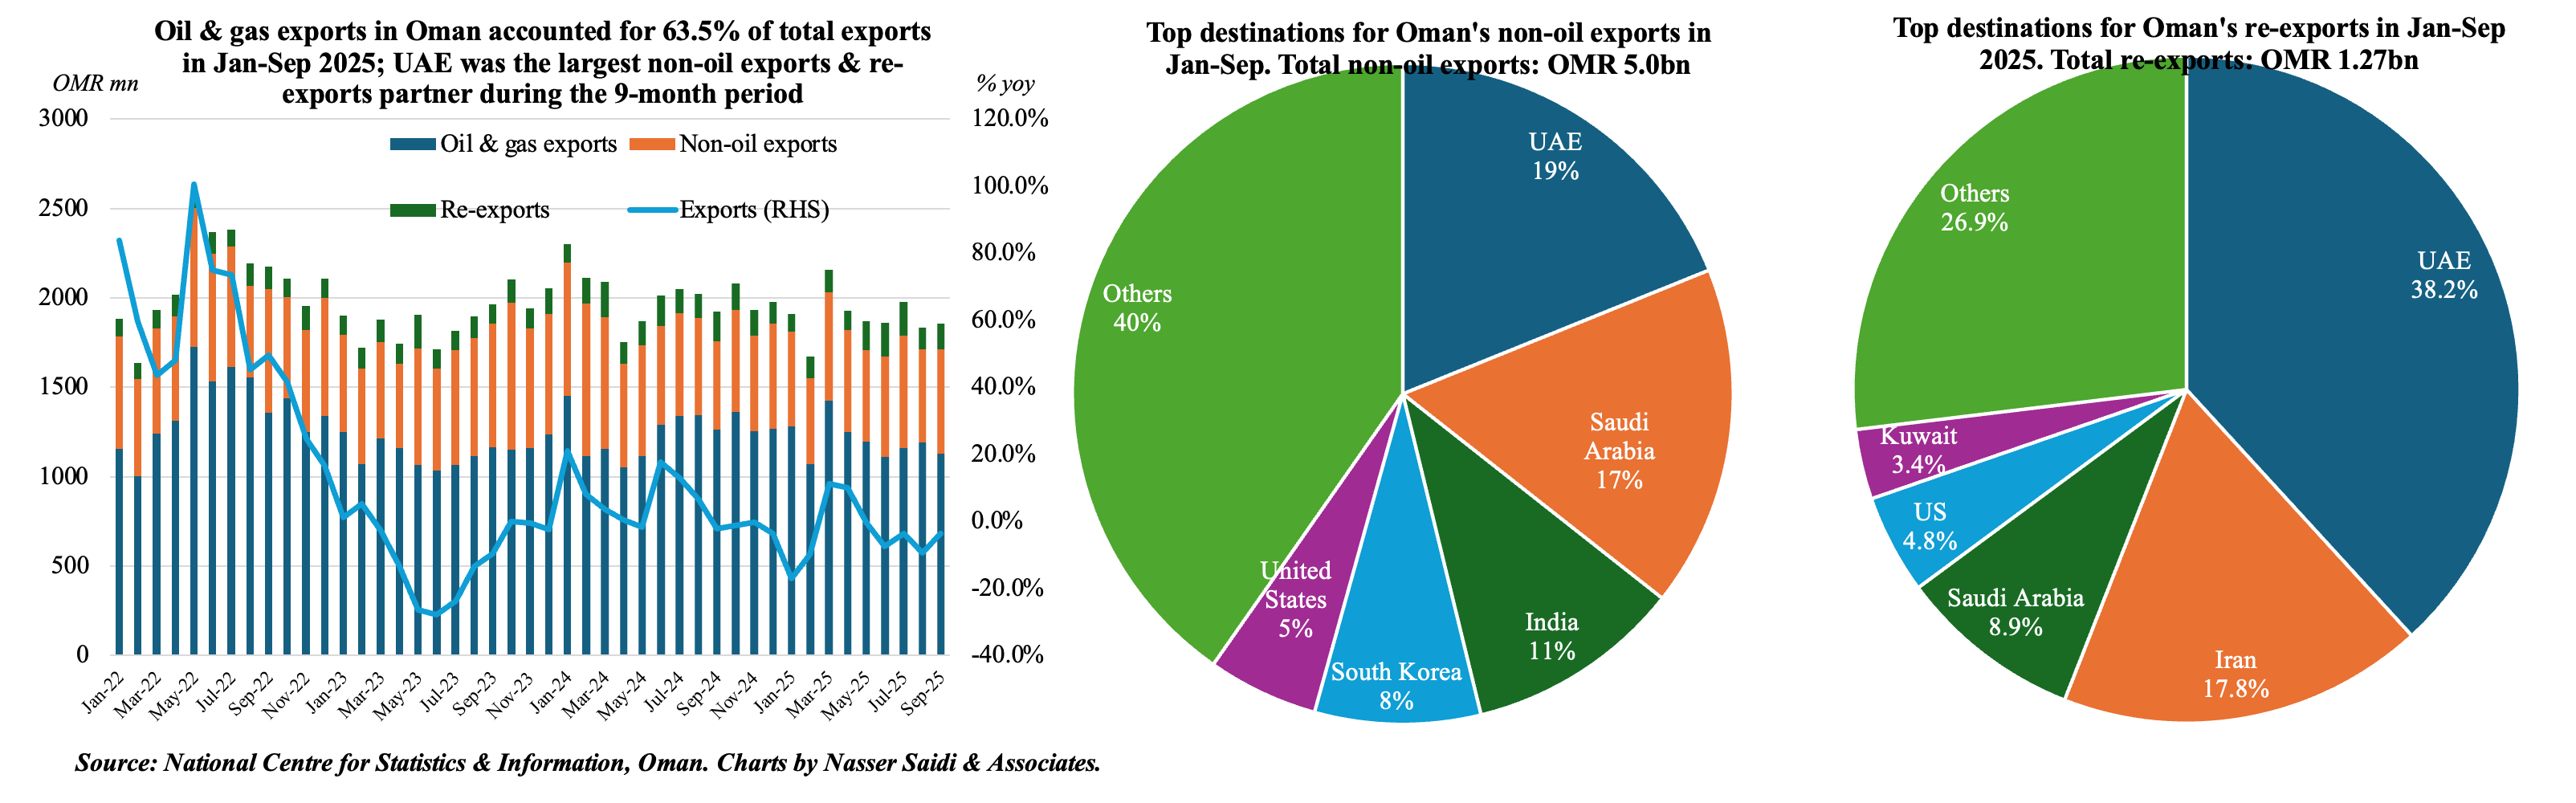
- Oil & gas exports continue to be under pressure. In Sep, oil exports fell by 10.5%, accounting for 60.9% of total exports. In Jan-Sep, it plunged 16.5% yoy to OMR 10.9bn, with a share of 63.5% of Oman’s total exports (Jan-Sep ’24: 69%).
- In Jan-Sep, exports fell by 9.1% to OMR 17.2bn & imports rose by 9.3% to OMR 13.3bn resulting in a narrower trade surplus (OMR 3.9bn vs OMR 6.7bn a year ago).
- Non-oil exports grew by 10.3% yoy to OMR 5.0bn in Jan-Sep, comprising mineral products (OMR 1.29bn, down 1.3% yoy, but accounting for 7.5% share of exports).
- Import structure reflects capex & industrial investment: transport equipment (29.5% to OMR 1.39bn in Jan-Sep) & electrical machinery/equipment (5.5% to OMR 2.2bn). This suggests continued investment in infrastructure, logistics & industrial capacity & could over time feed back into non-oil export sectors (e.g. industrial parks)
- Greater regional integration – UAE Oman’s largest non-oil trade partner: non-oil exports to UAE grew by 28.3% yoy to OMR 945mn in Jan-Sep, while re-exports were OMR 484mn (8.8% yoy). Oman’s imports originated mainly from GCC: UAE was Oman’s largest source of imports (OMR 3.07bn, or 23.1% of total); along with Kuwait & KSA, these 3 countries accounted for 38.8% of imports.
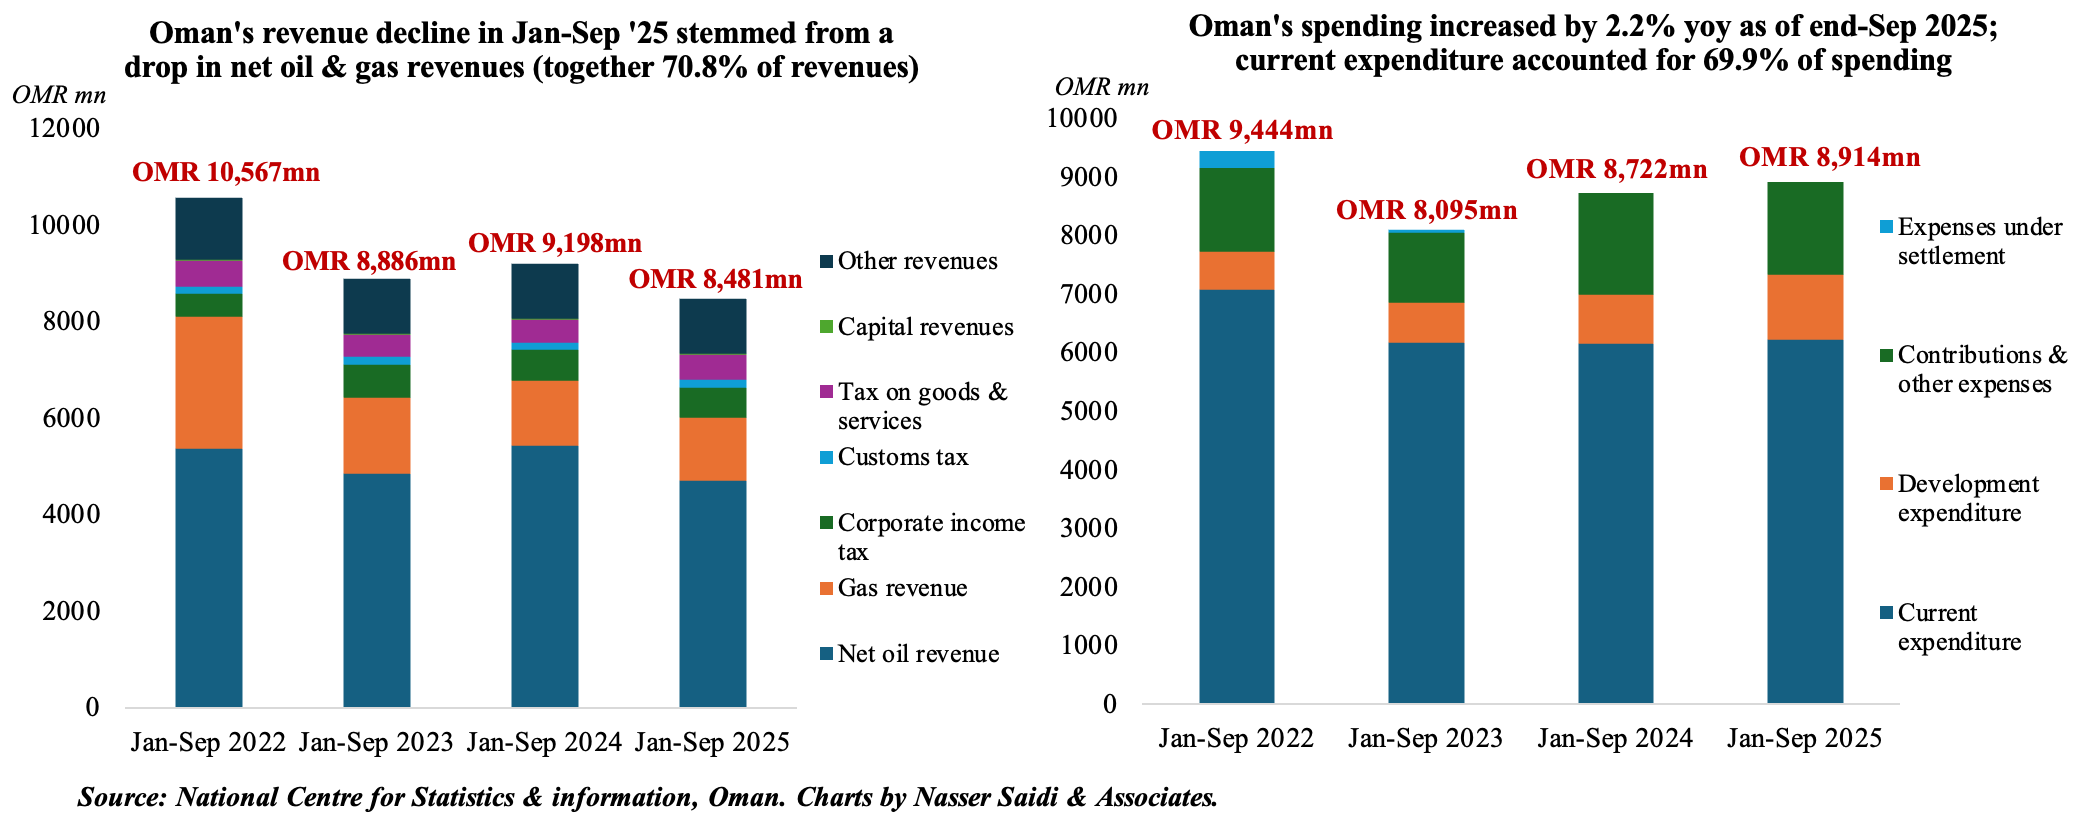
3. Oman’s fiscal deficit of OMR 433mn as of end-Q3 2025 stands in contrast to a surplus of OMR 476mn in Jan-Sep 2024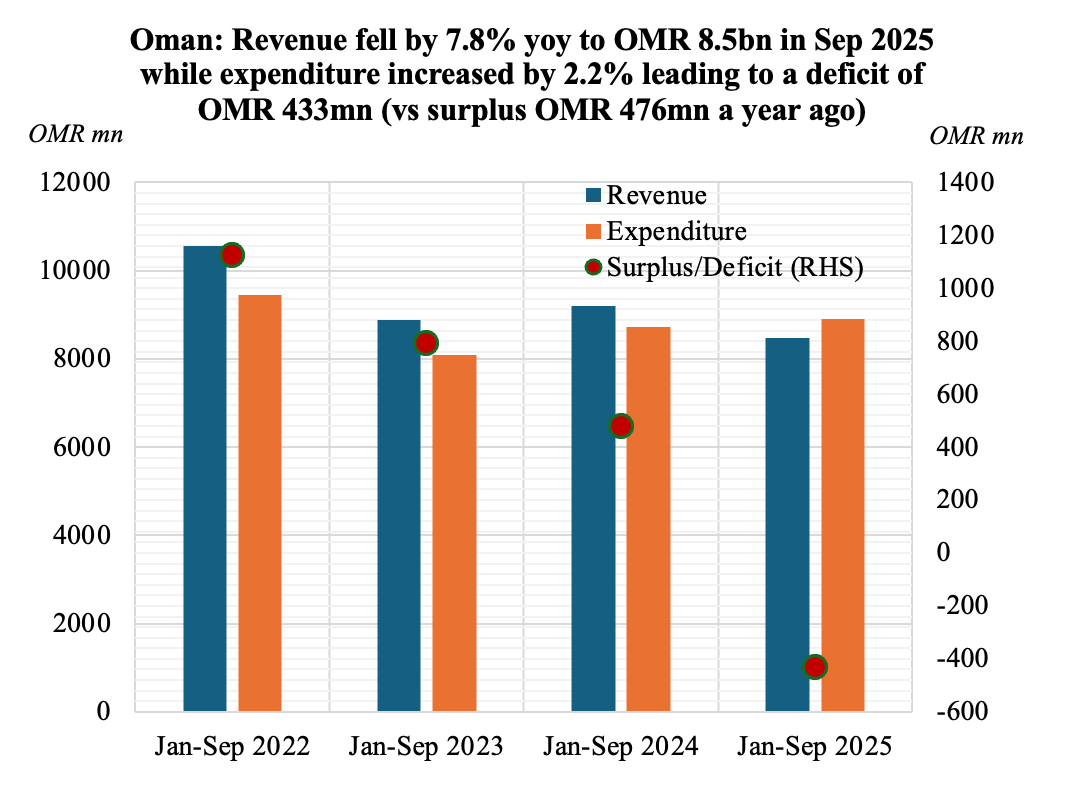
- Oman’s budget deficit of OMR 433mn in Jan-Sep 2025 compares to the projected deficit of OMR 620mn as per the budget). Revenues fell by 7.8% yoy to OMR 8.48bn alongside a 2.2% uptick in spending (to OMR 8.91bn).
- There was a sharp decline in net oil revenues (-13.36% yoy to OMR 4.71bn) and gas revenues (-3.6% to OMR 1.296bn). Net O&G together accounted for 70.8% of revenues as of end-Q3. Tax revenues grew by 3.3% yoy to OMR 1.299bn: corporate taxes and taxes on goods & services accounted for 47.3% and 38.9%.
- Expenditure grew by 2.2% in Jan-Sep 2025: current expenditure edged up slightly (1.2% yoy to OMR 6.23bn) alongside a 31.3% surge in development expenditure (to OMR 1.1bn) while contributions & other expenses slipped by 8.6% to OMR 1.58bn. Social protection system and electricity sector subsidy accounted for 50% of contributions & other expenses; oil subsides were 3.5% (vs 11.4% a year ago).
- While the reliance on oil remains a structural risk, Oman’s debt-to-GDP ratios are trending down, and long-term fiscal sustainability will depend on broadening its non-oil revenues (e.g. via income tax by 2028) & capitalizing on diversification.
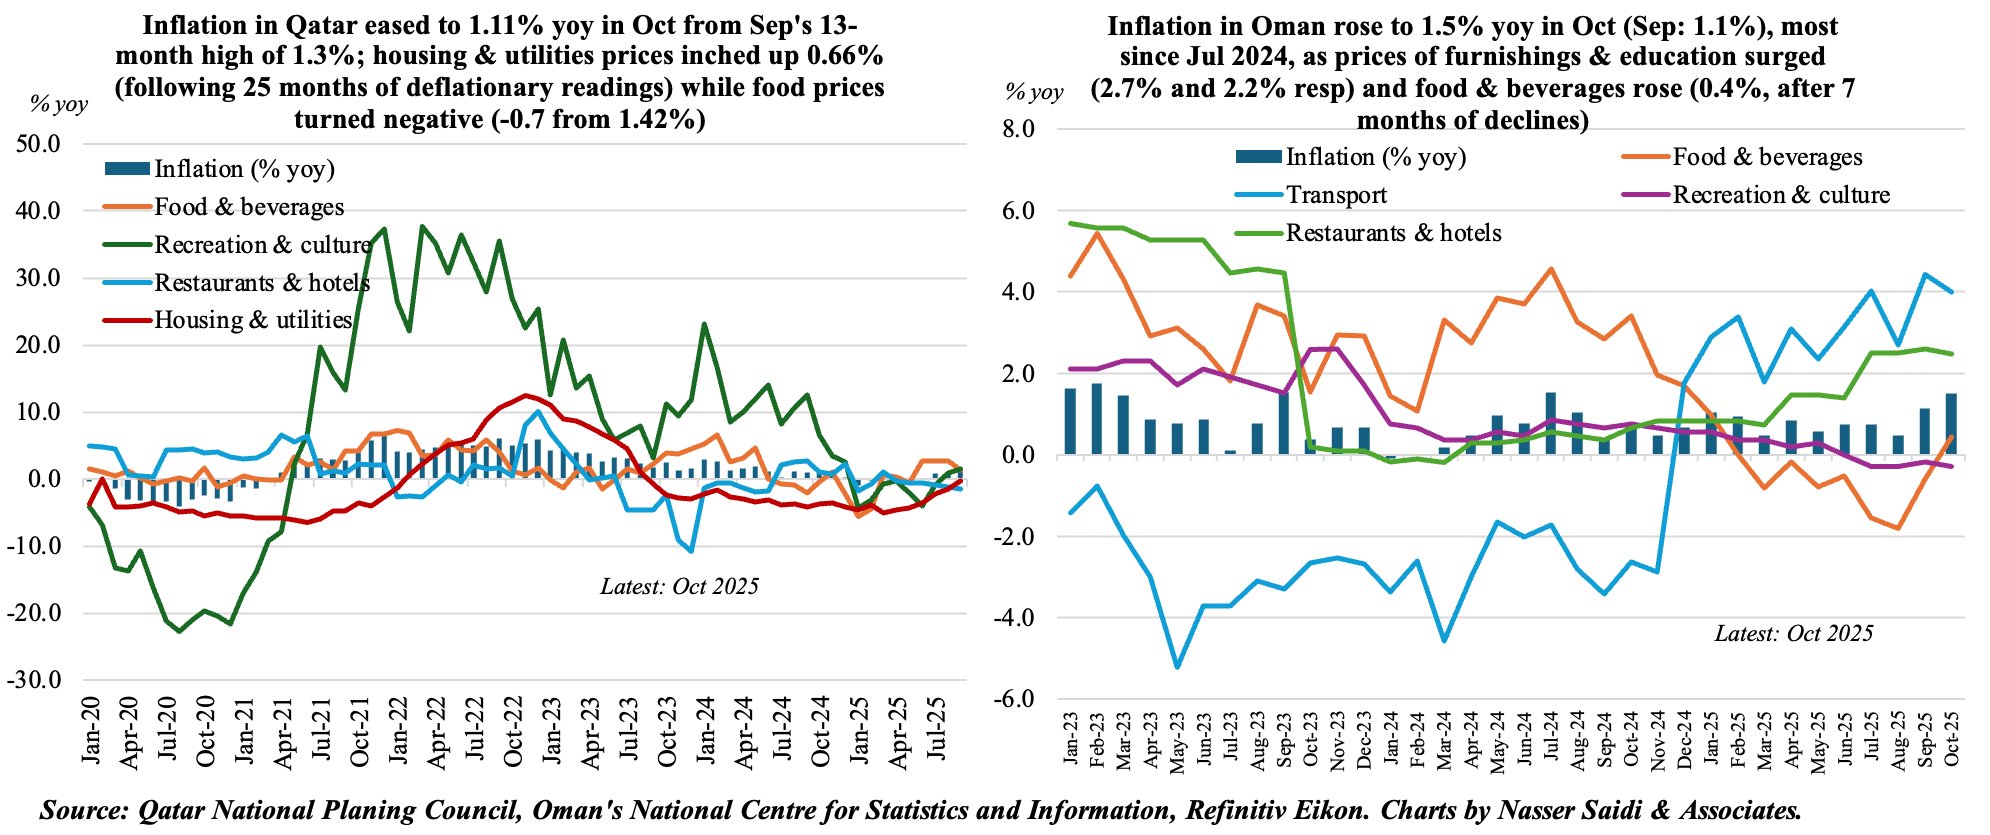
4. Inflation in Qatar & Oman clock in at 1%+ in Oct, but with distinct differences
- Inflation in Qatar eased to 1.11% yoy in Oct (Sep: 1.3%, the highest reading since Aug 2024). In contrast, Oman’s inflation inched up to 1.5% in Oct, the most since Jul 2024 (Sep: 1.1%). Points to relatively stronger near-term price pressures in Oman relative to Qatar, though both rates remain moderate.
- In both countries, the miscellaneous goods & services category posted the largest increase: up a record 15.8% yoy in Qatar (weight: 5.7%) and up 8.77% in Oman (weight: 5.276%). This could potentially be non-core service pressures.
- Prices of housing and utilities (with high weights of 21.2% in Qatar and 31.7% in Oman) turned positive in Qatar (0.66%) following 25 months of deflationary readings; in Oman, it nudged up 0.03%.
- Food & beverages costs (with weights of 13.5% in Qatar and 20.615% in Oman) turned negative in Qatar (-0.7%) while it ticked up in Oman (0.43%, following seven months of negative readings).
- Transport prices were opposite in Qatar and Oman, standing at -0.46% in Qatar while rising by a more prominent 4.0% in Oman.
- Qatar’s “restaurant & hotels” prices fell (-2.34%, falling at an increasing pace for 7 months in a row) but was up 2.5% in Oman.
- Inflation is widely expected to stay subdued this year in the GCC: IMF estimates it at 1.7%, before it edges up to 2.0% in 2026.
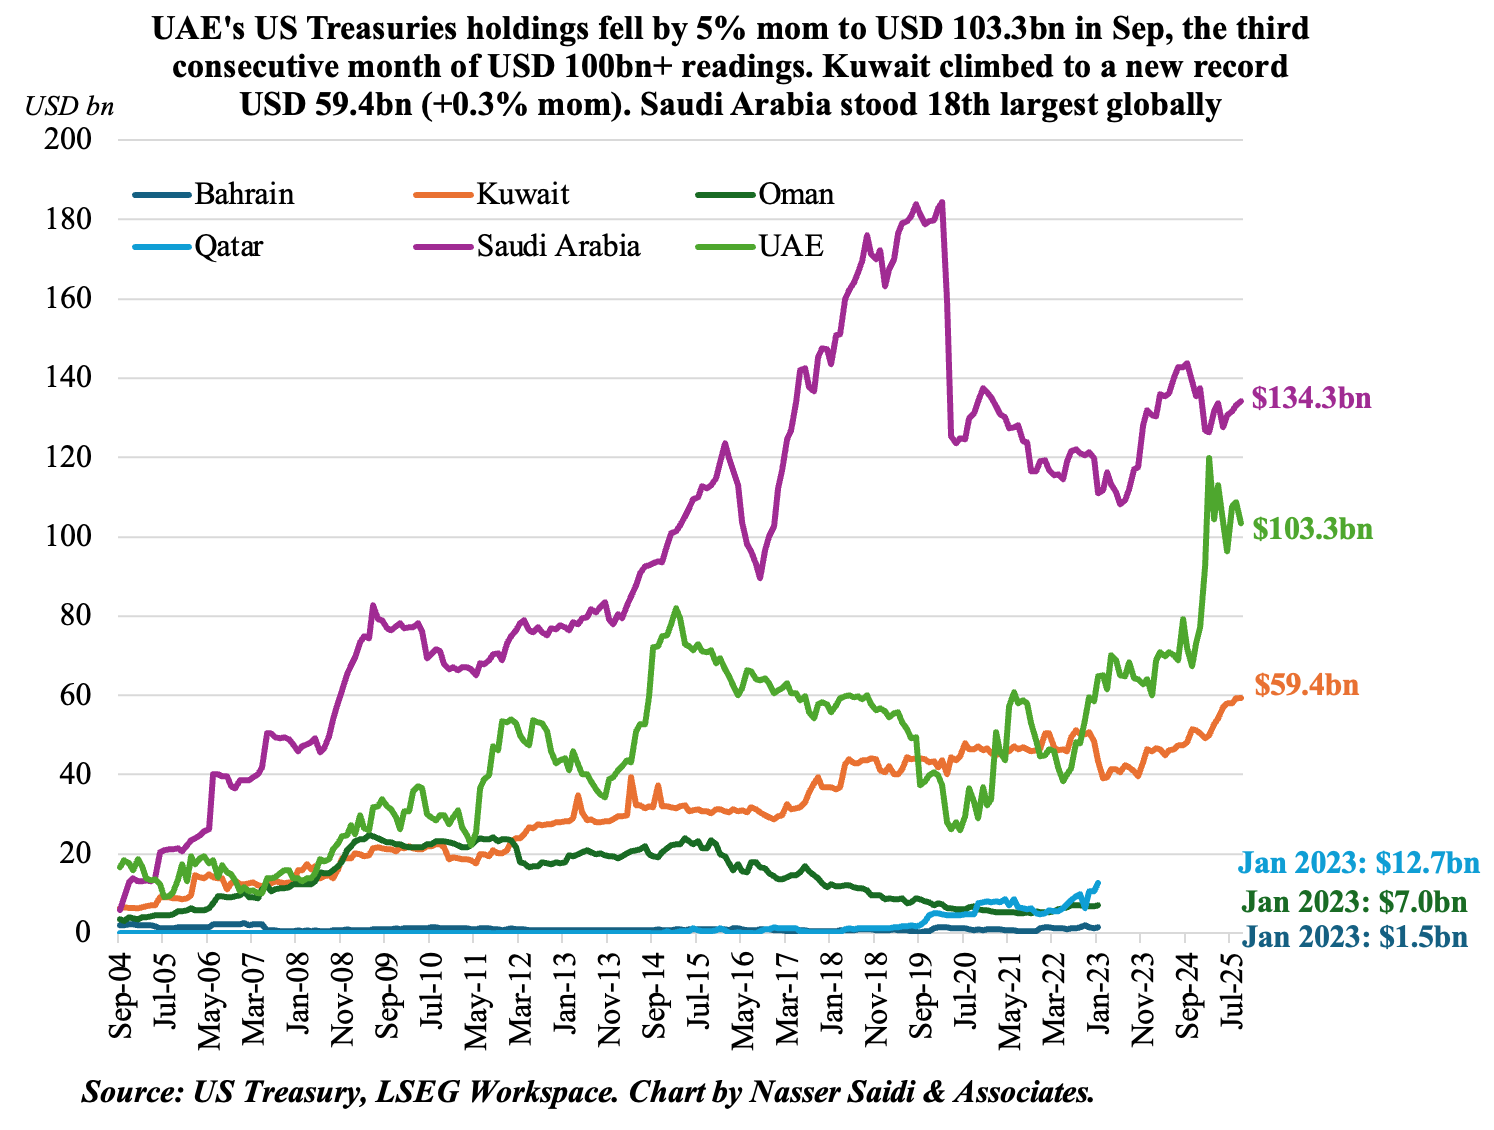
5. Foreign US Treasury holdings at USD 9.249trn in Sep declined for the first time in 6 months. Kuwait surged to another record-high, UAE’s holdings are at USD 100bn+ & Saudi was the 18th largest holder
- Foreign holdings of Treasuries inched lower by 0.14% mom but was up 5.5% yoy to USD 9.249trn in Sep.
- Japan was the largest holder, raising its holdings to USD 1.189trn in Sep, also the most since Aug 2022. UK came in second (at USD 865bn) while China was third (USD 700.6bn vs Aug’s USD 701bn & Jul’s USD 696.9bn which was the lowest since Oct 2008)
- Saudi Arabia was the 18th largest global investor in Sep: its holdings inched up 0.9% mom to USD 134.3bn; in yoy terms, it was down 6.7%.
- UAE holdings declined by 5.0% mom to USD 103.3bn, the third consecutive month of USD 100bn+ readings. It surged by 43.7% yoy.
- Kuwait climbed to a new high of USD 59.43bn, up 0.3% mom & 23.1% yoy (previous high: USD 59.24bn in Aug 2025).
- Ongoing economic and strategic partnership between the US and GCC (e.g. investments) may reinforce GCC’s appetite for US assets. GCC are also likely to continue hold/ increase Treasury allocations, given their need for high-quality liquid assets (e.g. in case of fiscal volatility).
Powered by:
![]()