Charts of the Week
1. Spread of Covid19 in the GCC
Most GCC nations have begun a phased re-opening of their economies after being in partial/ complete lockdown for weeks. Some restrictions still remain (e.g. partial capacity at mosques, restaurants, movie theatres, gyms etc.) in countries that have reopened (like the UAE); where cases are high, partial nighttime curfews and targeted lockdowns are in place. The spread of the outbreak is varied among the GCC nations.
The chart maps the share in total daily increase in confirmed cases per million persons (x-axis) against the share of the country in overall output (y-axis), with the size of the bubble denoting the 7-day average of the daily increase in cases. Among the GCC nations, the UAE seems to be performing better – when it comes to both the 7-day average of daily increase in Covid19 cases as well as the daily confirmed cases per million people.
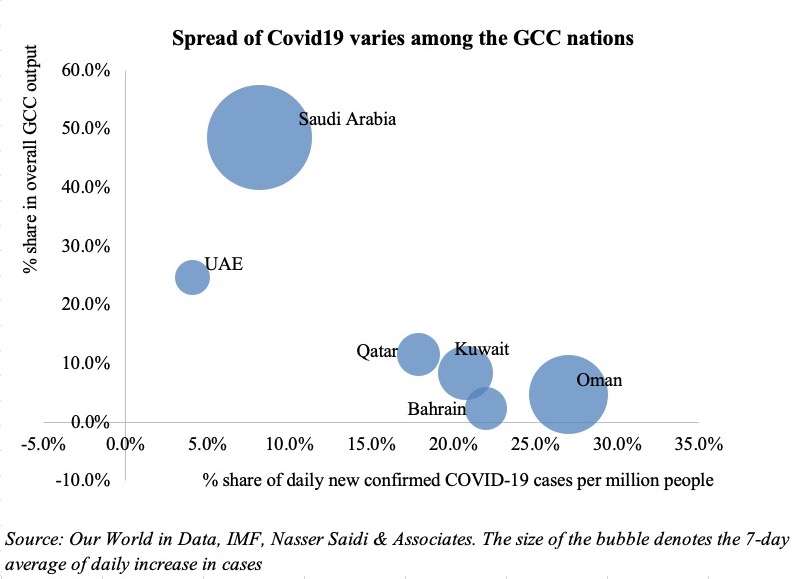
Saudi Arabia, which accounts for the lion’s share in GCC’s GDP, also has the highest 7-day average of daily increase in Covid19 cases (size of the bubble). This implies a sharper downturn in GDP this year due to the outbreak, but the effects of lower oil prices and the OPEC+ led cut in oil production will worsen the growth outlook. It is then little wonder that the rhetoric has shifted to diversifying revenue base with more privatisations and a hint of the introduction of an income tax in the future.
The GCC nations with the highest share in total daily increase in count (the highest being Oman) are among those with a lower share of overall GDP. For these nations, the worries are multiplied manyfold: not only will growth be affected by both the outbreak and lower oil prices, fiscal constraints and lower credit ratings will restrain their access to borrow from international capital markets. While governments have tightened purse strings, reducing capital and infrastructure spending will be detrimental to economic growth (especially the private sector).
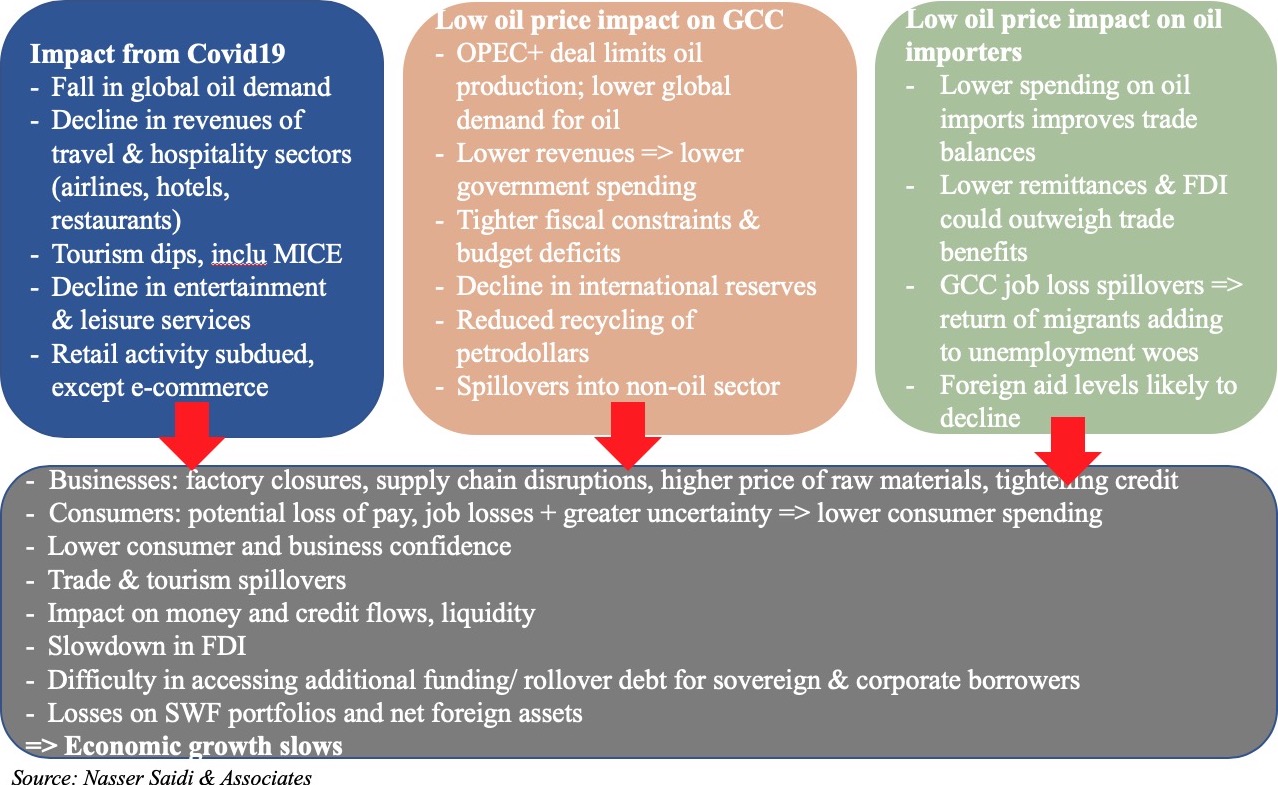
A decline in growth in oil-exporters also has a negative impact on many oil-importing nations: ranging from job losses (& the return of these residents to home countries that already face relatively higher unemployment rates), lower remittances as well as lower foreign aid and investments.
Chart 2. Economic Impact of Covid19 and low oil prices on the Middle East’s oil exporters & importers
2. Decline in global trade
Along with tourism, global trade has been one of the most-hit by the global Covid19 outbreak. Trade growth had been slowing for the past year, and the pandemic has only accelerated its pace. Monthly data from the IMF’s Direction of Trade Statistics reveal that the drop in export growth touched two-digits in Mar, and given lockdown measures and factory shutdowns it can be estimated that data for Apr-May will be far worse.
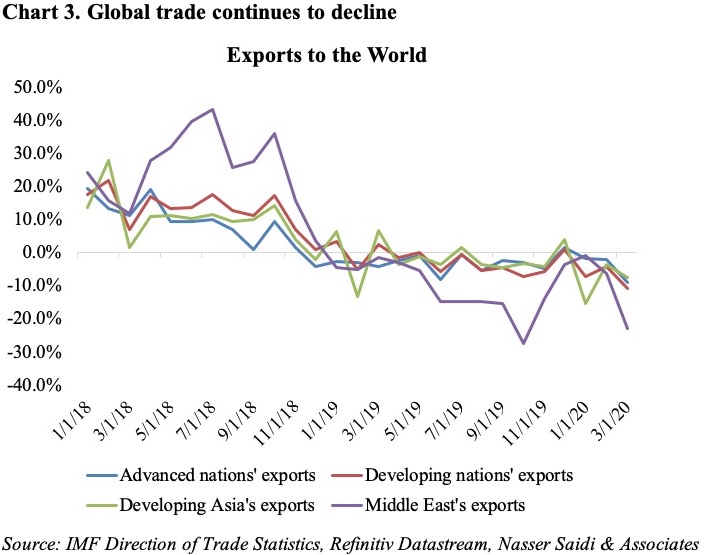
The WTO estimates that trade will drop by 18.5% in Q2 this year, with a full year dip of between 13% (optimistic) to 32% (pessimistic scenario). For the Middle East, the 13.9% decline in total exports in Mar is a result of both lower oil production and lower demand for oil.
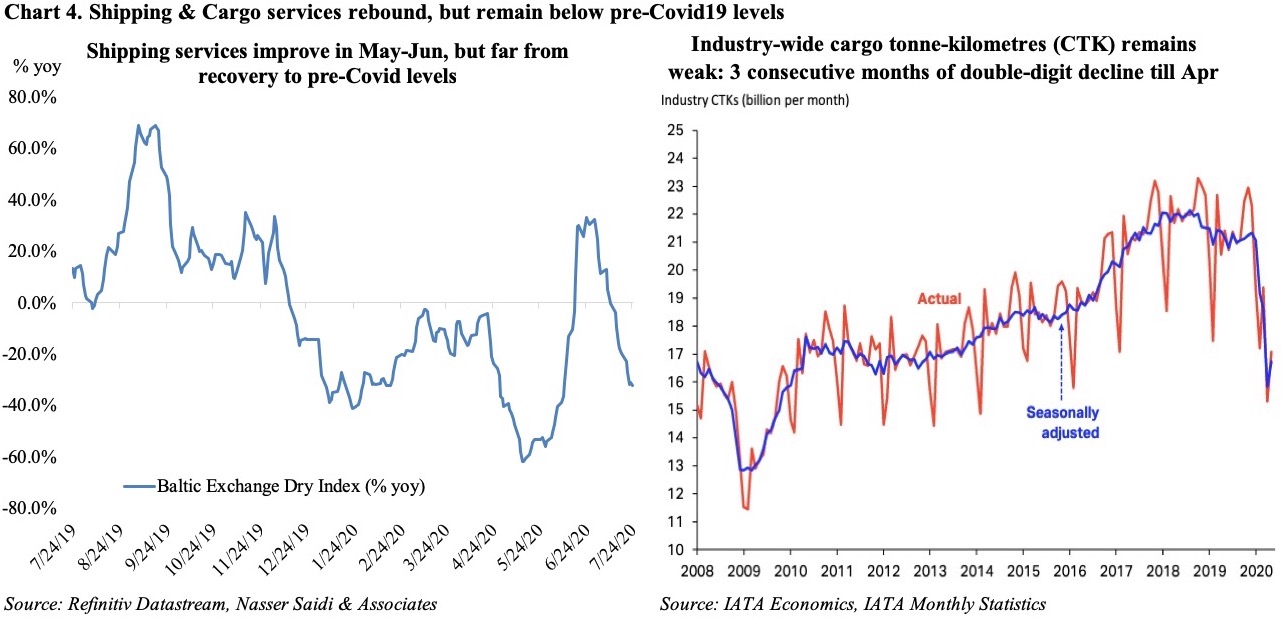
Shipping estimates, denoted by the Baltic Exchange’s sea freight index, touched a 9-month high in early Jul after recovering in Jun: this should translate into an improvement in global trade after May. Air cargo traffic data from IATA also denote that the cargo levels have shown a slight rebound in Apr (the latest available data). However, note that in both cases, there is a long way to recover to their pre-Covid19 levels. Supply chains remain disrupted though there has been a rebound in manufacturing activity across the globe (latest PMI numbers from Europe and Asia).
Powered by:

Weekly Insights 27 Jul 2020: Charts on the spread of Covid19 in the GCC + Global trade
27 July, 2020

read 3 minutes
Read Next
publication
Weekly Economic Commentary – Apr 15, 2024
Download a PDF copy of the weekly economic commentary here. Markets Major equity
15 April, 2024
publication
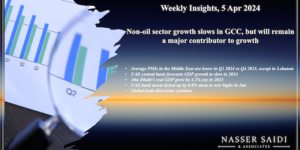
Weekly Insights 5 Apr 2024: Non-oil sector growth slows in GCC, but will remain a major contributor to growth
Middle East PMIs. UAE GDP inflation. Abu Dhabi GDP. UAE monetary stats. Global trade diversion.
5 April, 2024
publication
Weekly Economic Commentary – Apr 1, 2024
Download a PDF copy of the weekly economic commentary here. Markets Major equity
1 April, 2024


